
Update Dec 7, 2016: Check our new series on safe withdrawal rates: The Ultimate Guide to Safe Withdrawal Rates – Part 1: Introduction
Look around in the early retirement community and everybody is raving about the 4% rule. It’s a “safe” withdrawal rate, we are told, by the Trinity Study and some in the early retirement community. Some claims, we found, are downright false but more on that later.
Of course, there is not one single withdrawal rule. You can adjust not only the withdrawal rate, from 4% to 3% or 5% but also the detailed mechanics of the rule. Small changes in the rule can make big changes in your consumption path and/or success probabilities. Here are three versions of the safe withdrawal rate (SWR) and their pros and cons.
Rule 1: 4+CPI = 4% rule with inflation adjustment
This is the standard 4% rule; you pick the initial withdrawal at 4% of your investments, then inflation-adjust your withdrawals, regardless of your portfolio returns. This seems to be the most widely cited and used rule. The Trinity Study and a lot of the calculations by finance guru Michael Kitces use this rule.
Advantages:
- Simplicity. You get a fixed consumption budget every year, adjusted for inflation. You essentially created your own CPI adjusted annuity, though as we shall see later, there is some risk that you run out of money
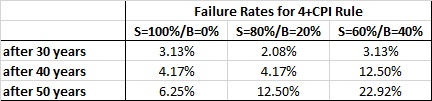
- Simulations on cFIREsim and in the Trinity Study show that this rule had a reasonably high probability of success. For a 30-year retirement horizon, the success rate is over 97-98% for equity shares between 60% and 100%, see table below
- Some people argue that retirees should not worry too much about temporary drawdowns (for example MadFIentist) because your portfolio will likely recover again. Simulating this rule with past realized returns shows that despite some substantial drawdowns throughout the simulation period, more likely than not, your investments would recover again. The 4% rule is, it is argued, self-regulating in that after a drawdown in equity prices your higher withdrawal rates are balanced against higher expected returns going forward. Since the equity market recovery is likely around the corner you can afford to withdraw a little bit more. We respectfully disagree with that view, though.
Disadvantages:
- You may run out of money:
- The Trinity Study and a lot of the calculations by Michael Kitces are geared towards the 65-year-old retirees who don’t mind running out of money after 30 years, at age 95. And indeed, over a 30-year horizon, the failure probabilities using the cFIREsim were only 2-3%
- Over a longer horizon, this rule is probably not as sustainable. See the table above; the probability of running out of money is low for the first 30 years but goes up after 40 and 50 years. So, if you try to fund 50-60 years of retirement because you retire in your 30s, a more prudent rule would reduce the withdrawal rate, just to be sure. We calculated that over a 50-year horizon the 4% rule had a failure rate of between 6 and 23%, depending on the equity share in the portfolio
- Intriguingly, the lower the equity share the higher the failure rate of the 4% rule, see table below. Getting rid of short-term volatility introduces long-term risk of running out of money!
- You are subject to “Sequence of return risk.” Two retirees with different retirement dates but identical average returns can end up with different final portfolio values depending on whether the relatively low returns happened towards the beginning or the end of the retirement period. If you were lucky and experienced high returns early during your retirement you will have a much higher final portfolio value than someone with low returns early on.
- Actual withdrawal rates in subsequent years will deviate (potentially wildly) from the initial 4%. The varying realized withdrawal rates create the following time-inconsistency problem. Imagine two families each have an identical $1,000,000 portfolio at the beginning of the year. Family 1 just retired and follows the 4% rule and thus withdraws $40,000 that year. Family 2 retired years earlier when their portfolio was at an inflation-adjusted $1,250,000, but through withdrawals and low or negative equity returns the portfolio is now down to $1,000,000. Their withdrawal is still $50,000. Despite having the exact same portfolio value, families 1 and 2 withdraw different amounts. How can they both be acting optimally? Kitces calls this the “starting point paradox” but it’s not really a paradox. It’s merely a mathematical proof (by contradiction) that the 4+CPI rule cannot be optimal under any criterion we can think of and it’s all due to this time inconsistency problem.
- The view that one shouldn’t worry too much about temporary drawdowns is severely flawed.
- Even in past simulations where this rule worked, the temporary drawdown in the portfolio, usually during the first ten years of retirement could easily be 50%. Even though the portfolio might have eventually recovered, the retirees using this rule would not have known this at that time. It doesn’t make for a very comfortable and stress-free retirement knowing that your portfolio is down 50%, you are now withdrawing 8% of your investment balance and desperately waiting for a recovery.
- Any significant drop below the initial portfolio value increases your probability of not only never recovering, but drawing down your entire portfolio, being left with nothing. Over a 50 year horizon, the failure probability increases substantially if your inflation adjusted portfolio value ever dropped to 75% or even 50% of the initial value (CPI-adjusted) along the way, especially if you have a 20% or even 40% bond share, see table below. The way to read is as follows: if you use a 60/40 portfolio, and at any given time your portfolio value dropped below $750,000 (inflation-adjusted) your now conditional probability of running out of money before year 50 is 40%, much higher than the unconditional probability. If your investment value ever dropped below $500,000 you have a 61.11% failure probability. Suddenly, the Safe Withdrawal Rate is not so safe anymore!

Some claims about the 4% rule from other blogs that are clearly false
Claim 1: “In fact, even when starting with a 4% initial withdrawal rate, less than 10% of the time does the retiree ever finish with less than the starting principal. And it has only happened four times in the ‘modern era’ of markets: for retirees who started a 30-year retirement time horizon in 1929, 1937, 1965, and 1966.” (claim by Kitces, also referenced by MadFIentist).
Truth: The probability was significantly lower, at least according to cFIREsim. Here are the probabilities computed for staying above the CPI-adjusted initial value, with simulations from cFIREsim:

Certainly false under the 60/40 portfolio rule. Even using 100% equities, the probability of ending up with more than the initial value stays way below 90%. Michael Kitces probably mixed up nominal and real (CPI-adjusted) final portfolio value. True, the nominal value might have stayed above the initial value 90% of the time, but after 30 years of inflation, that’s not a very high hurdle.
Claim 2: “the safe withdrawal rate actually has a 96% probability of leaving more than 100% of the original starting principal!” (claimed by MadFientist)
Truth: This claim is even more false than Claim 1. Incidentally, this claim of 96% success rate is contradicted with the identical claim but with 90% success rate in the following bullet point on that same blog page, which we proved wrong above.
Claim 3: “A withdrawal rate of 3.5% can be considered the floor, no matter how long the retirement time horizon, so don’t jump on the dividend bandwagon just so you can avoid selling shares during retirement” from MadFIentist.
Truth: According to cFIREsim, the 1966 retirement cohort would have had an SWR of 3.1476% for 50 years, using a 60/40 S/B portfolio. This withdrawal rate would have created a “point landing”, i.e., exactly zero money left over after 50 years. A withdrawal rate of 3.5% would have wiped out the portfolio after only 32 years. Just a 0.35 percentage point increase in the withdrawal rate would have shortened the sustainable window by 36%. Ouch, that’s not very robust!
Claim 4: Over long horizons the sustainability of the SWR becomes very robust: “If the withdrawal rate is low enough to survive the first two decades of bad returns, then eventually the good returns arrive, the client recovers and gets ahead, and adding more years to the time horizon is no longer a risk.” (referenced by both Kites and MadFIentist)
Truth: As the calculation in claim 3 shows, small changes in the SWR can have big changes in the number of years of sustainable retirement consumption. For example, for 30 years the safe withdrawal rate would have been 3.6009% for the 1966 cohort (again assuming 60/40 S/B, 0.05% fees). The 40 year SWR would have been 3.4432%. A change of 20 years of sustainability going from 3.1476% to 3.6009%!
Rule 2: 4+dynamic = 4% withdrawal of asset value, recomputed every year
Implementation: Every year you withdraw 4% of the current portfolio value.

Advantages:
- You will not run out of money the way the 4+CPI rule could
- Easy to compute, monitor and implement
- Remedy for the time-inconsistency problem in the 4+CPI rule: this rule is actually time-consistent, so two different families with different retirement timing would still withdraw the same amount if they had the same portfolio value at the beginning of the year
- The final portfolio value is independent of the sequence of returns. Thus, you are not subject to the “sequence of return risk” as under the 4+CPI rule above. But, of course, there is no free lunch. Your withdrawals, i.e., your consumption path is very much subject to the sequence of return risk.
Disadvantages:
- Even though you will never run out of money from one month to the next, like under the 4+CPI rule, you may erode your purchasing power especially if the target withdrawal rate is high. We compute that the minimum consumption is only $15,760 under this rule, over 60% below the $40,000 initial value. However, we also compute that this drop is only temporary: in the final year, the minimum withdrawal is slightly over $45,000, inflation-adjusted. So, in the sense of final consumption, you would have a 100% success rate in maintaining purchasing power!
- Your consumption budget becomes now exactly as volatile as your portfolio, which is likely a big turnoff for most retirees. In fact, the annualized volatility of consumption would have been between 14 and 21%, 18% on average, roughly the volatility of the S&P500 over this time span. Then again, things are not so bad if you have your necessities covered, say, you own your (modest!) home outright (no mortgage), have low-cost health insurance and use your withdrawals for food plus discretionary spending, e.g., travel.
Rule 3: CAPE-based = Adjust the withdrawal rate every year, taking into account equity valuations
Implementation: The default setting in cFIREsim is to calculate the inverse of the CAPE, call it the CAEY (cyclically-adjusted earnings yield). Compute the sustainable withdrawal rate as 1% plus one-half times the CAEY. We played around with different parameters but liked the simulation results with the default settings the best. We plot the time series of withdrawals below. Notice that the initial withdrawal is no longer fixed at $40,000. Depending on the initial CAPE ratio, consumption would start off at anywhere between $28,477 and $107656:

Advantages:
- The CAPE estimates are available for free on Professor Shiller’s website
- This rule is also time-consistent
- The minimum withdrawal under this rule would have been $23,300. This worst case scenario is about 50% better than the worst case under the 4+dynamic rule. And it’s $23,300 higher than running out of money under the 4+CPI rule!
- While the withdrawals can drop temporarily under this rule, all 96 cohorts had a year 50 withdrawal amount larger than their year 1 withdrawal. Under this criterion, a 100% success rate (though, again, there can be temporary reductions in the withdrawals). The lowest increase between year 1and 50 was +11% (CPI-adjusted) and the highest was +268%, also CPI-adjusted
- While still generating volatility, the year to year changes in withdrawals are much lower than under the dynamic 4% rule. We compute that the standard deviation is on average under 5% for the 96 cohorts, much lower than under the 4+dynamic rule which had 18% annual volatility on average
Disadvantages:
- There is still some volatility in the withdrawal rates, though less than in the 4+dynamic rule
- Currently, the safe withdrawal rate is only 3%. That’s because the Shiller earnings yield is only just under 4%. If we round that up to 4, then the withdrawal rate is 1%+0.5*4%=3%.
- Not as easy to compute. But then again, the CAPE data are published regularly by Robert Shiller, and every frugal retiree who made it this far should be able to gather this from the web
- You may still erode you purchasing power a little bit, at least temporarily
- You rely on some abstract concept, the Shiller CAPE, and 10 years of backward looking data. What can possibly go wrong? For example, a structural break that makes earnings going forward very different from the last 10 years:
- What if a future business-friendly White House and Congress eliminate or significantly reduces corporate taxes? We are allowed to daydream, right? The path for future corporate profits jumps up, together with the index value. But dividing the past low earnings by today’s higher index value after the structural break would give you an earnings yield far too low.
- Likewise, a tax hike or a permanent collapse of an entire sector’s earnings due to regulation (pharma) or economic realities (energy), might make the backward-looking earnings yield too high.
Summary stats:

Conclusions:
We don’t like the 4% rule. The probability of running out of money and the uncertainty along the way are not conducive to a relaxed retirement. The 4% rule, dynamically adjusted every year, might be more sustainable but creates vast swings in annual withdrawals. Not very pleasant.
We like the dynamically adjusted withdrawal rate according to the CAPE ratio. It’s a balance between long-term sustainability and manageable fluctuations in annual consumption. Right now the recommended withdrawal rate is 3%. We target a net worth large enough to give us an even smaller SWR target of 2.5-3.0%, just to be sure.
Stay tuned for future parts of this series!
Intro: Pros and cons of different withdrawal rate rules
Part 1: Equity expected returns
Part 3: The small-sample problem in historical simulations
Part 4: More bad news on equity expected returns
I’ve read over a few articles about withdrawal rates the simple answer seems to be to just shoot for using about 3% and you should be fine. Also finding a decent part time side gig for a while could help create a buffer and increase your odds of long term success. For example: if you are an accountant, just work a month or 2 around tax season. Into construction/ remodeling: take some seasonal work at Home Depot. Good with events/ food prep: work for a caterer doing weddings or corporate events. The idea is to do something you like where you can make some better money for the time spent and not minimum wage. Plus you will still have a lot of time off through out the year to enjoy yourself.
Thanks! That is definitely our plan, see our earlier post:
https://earlyretirementnow.com/2016/04/07/the-abc-and-d-through-j-of-early-retirement/
Plan B, as in “back to work”
What we liked about the CAPE-based withdrawal rates is that they will also be higher than 3% if market conditions permit. We don’t want to work when when we don’t really need to.
Frankly it’s little scary when you stop to think of all the things that could go wrong and outside forces that could impact your plans.
I do not plan to hang up my hat before I have incorporated enough contingency into my (diversified) passive income streams to help me weather some bumps. Then if the proverbial hits the fan, I guess I’ll just have to put my hat on again 😉
Better to be prepared and never need it than the other way around! 🙂
Great job in digging into the 4% “rule”and what lurks beneath.
Share your view to be shooting for a lower SWR than the traditional number everybody quotes and builds plans around. The planing around this number is scary and may be leading many down a path that just won’t be sustainable.
Thanks a lot! More to come on this topic, stay tuned!
Though, I saw on your recent post (http://www.planinvestescape.com/our-fi-date-when-and-why/) that you will be in very, very solid shape and have nothing to worry about in terms of SWR! 🙂
Cheers!
Good article ERN. This is one reason I chose to move away from a pure indexing approach to Dividend Growth Investing (DGI). Using your same figures as example, a portfolio of $1 million diversified across DGI stocks across sectors and total of say 30 companies including REITs, it’s possible to generate $40k in annual dividends (4% yield) with a expected portfolio dividend growth rate (DGR) of 5%. Dividends are more stable than stock prices but they can also get cut if the economy is in deep recession. For example, the 2008-09 Great Recession saw S&P 500 companies cut, in aggregate, 25% of their dividends. Some cut more, some none at all and some others (like McDonalds) even increased dividends through the recession. The dividends were all restored by 2010-11 timeframes. Still, you can address this risk by assigning a safety margin in spending dividends as well. For example, I take 30% Div cut at portfolio level as worse case for budgeting purpose. I assume 70% of my actual dividends as my spending budget, which puts the spend figure as $28,000 (2.8% initial WR) for the above example. Interestingly, this almost matches the lower bound figure you cite from the CAPE based WR methodology. The difference here is the remaining $12k is either saved as cash cushion or reinvested to generate more dividends (like internal compounding). If we assume that deep recessionary cuts like 30% (at portfolio level) happen at worst every 5 years, then conservatively, 5 yrs of unspent dividends of $12k/yr will reach at least $60k (assuming no growth in dividends), which serves as the rainy day stash during the next deep recession or even better, this amount invested at same 4% yield gives another $2.4k in annual dividends, thus improving the safety margin of dividends available for spending. Dividends give me a realistic feel of the underlying strength and microeconomic picture of businesses that I was unable to get from a broad index, where one is forced to rely on academic studies and formulaic adjustments to get a SWR.
Great analysis. Thanks for stopping by! I like the Vanguard High Dividend Yield ETF (VYM), yield about 3.6%, so one is almost there at 4%. Also, for stable dividend payers, the dividend yield is probably not so different from the 10Y rolling profit-based CAPE ratio, so yes, that’s interesting that the Dividend drop is about in line with the CAPE drop in withdrawals!
I am not a big fan of REITs, though. They have been bid up in the chase for yield and everybody recommending REITs tells me to stay away. But I could be wrong. We will see how REITs hold up when interest rates go up again!
Thanks ERN. VYM is a good choice but every stock in it may not be at good value. Also, their 0.1% ER, while super low, still eats about 4% of your annual dividend income. It may be worth it for the convenience it provides. But I am not seeing a predictably growing track record of dividends each year, they seem to fluctuate quite a bit so cash flow management might get tricky with VYM if you were retired. I am on track to get another double digit increase in my portfolio income this year over last year. REITs may suffer a drawdown when rates rise but if you look at the 90s period when interest rates rose, they continued to hold up fairly OK because their incomes also rise from higher rates as they pass on as lease increases. I hold about 14% REITs in my portfolio and am comfortable with this allocation. Obviously, DGIers shouldn’t load up on one sector just because of yield. I keep 15% as my max sector allocation and 6% as max individual stock allocation.
Good points. REITs have attractive yields but much higher volatility than the VYM. The VNQ has about 50-80% higher vol than VYM, depending on the window, some individual REITs I looked at have twice the vol of the VYM. Not sure if that additional volatility is worth the extra yield.
I am also currently discouraged from holding individual stocks, due to regulations and compliance issues at work. Once I’m retired I might look at REITs and even individual REITs again. If dividends hold up all right and only the price fluctuates, maybe one can have a small share of the portfolio in REITs. Your 14% sounds about right.
See also this new post on REITs: https://earlyretirementnow.com/2016/06/02/reits-pros-and-cons/
The volatility of REITs should be viewed not in isolation but as part of a portfolio. With its low correlation to SPY, REITs at a reasonable %age level (say. Under 20%) of a portfolio actually reduces portfolio volatility while keeping returns close to a 100% SPY portfolio.
Oh, yes, we always look at risk in the context of the whole portfolio see our post on Mental Accounting: https://earlyretirementnow.com/2016/08/10/beat-behavioral-bias-mental-accounting/
But REITs have a very high volatility:
VTI: 14.1% risk
VNQ: 20.4% risk
correlation: 0.69
w(VTI)=0..80, w(VNQ)=0.2, then your portfolio has 14.4% risk which is still greater than 14.1%. No diversification there. That’s not to say that REITs don’t belong in the portfolio. They had a very good run of returns recently. But that could come to a stop as well when interest rates rise again.
The 3% + recompute every year withdrawal rule seems a logical choice. That way, there is less variation of withdrawals and you can more or less estimate how many years your retirement fund can last.
Yup! agree with that!