
Update: We posted the results from parts 1 through 8 as a Social Science Research Network (SSRN) working paper in pdf format:
Safe Withdrawal Rates: A Guide for Early Retirees (SSRN WP#2920322)
Welcome back to the Safe Withdrawal Rate Series. Last week we wrote about how Social Security can impact the SWR estimates. Even under the most optimistic assumption (no changes to the Social Security benefits formula), we didn’t think that the 4% withdrawal rate is safe.
But how about tinkering with the inflation adjustments, also called Cost-of-Living adjustments (COLA)? I often hear that one way to save the 4% rule in periods when the stock market doesn’t cooperate is to not do inflation adjustments for a few years. Or simply utilize the fact that we all potentially spend less (in real terms) as we age! How much can we push the initial withdrawal rate in that case?

COLA – How not to do it
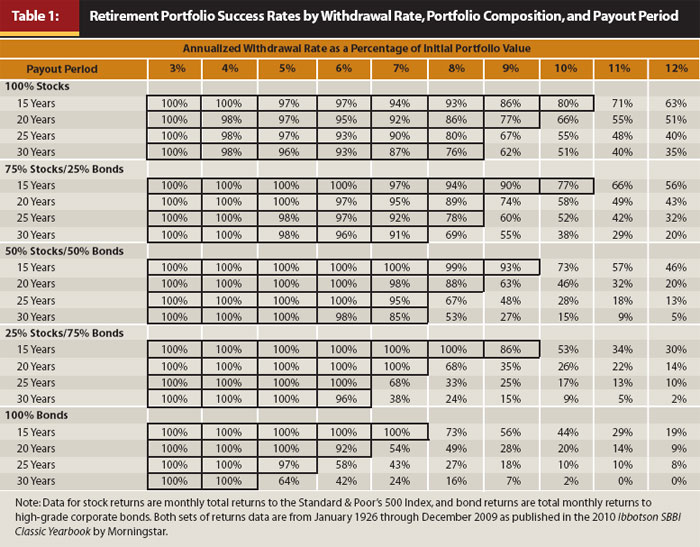
The first table in the often cited Trinity Study, apparently the gold standard of retirement research, looks at the success rates of withdrawal strategies that don’t do the cost-of-living adjustments (i.e., keep nominal withdrawals constant):
http://resource.fpanet.org/resource/FDBB107D-1D09-67A1-AC1A61924F8CAAF5/Cooley-Table-1.jpg
Source: Trinity Study (https://www.onefpa.org/journal/Pages/Portfolio%20Success%20Rates%20Where%20to%20Draw%20the%20Line.aspx)
That seems like an interesting exercise to do before jumping into the inflation-adjusted study, right? Wrong! To me, this is a pretty cringeworthy and nonsensical exercise for the following reason. See the chart below where we plot the purchasing power of an initial withdrawal of $40,000 p.a. over 10, 20, 30, and 60 years when foregoing CPI-adjustments:


Not doing inflation adjustments during the 1970s would have implied a massive erosion of purchasing power: Your initial $40,000 withdrawal in 1970 dollars would have been worth only around $8,000 in the year 2000. Not quite a Zimbabwe-style runaway inflation, but still pretty bad. Good luck living your golden years on that amount! On the other hand, in the 1930s you would have massively increased your CPI-adjusted consumption in a deeply deflationary decade. So, that retiree would have fared much better (in real consumption terms, not in final value). Lumping them all together and calculating success rates is not very meaningful then. It’s comparing apples and oranges! Sorry to say this, but in my eyes, anybody who looks at safe withdrawal rates in purely nominal terms suffers some serious loss of credibility. It proves that even the combined brainpower of 3 PhDs can create some junk science.
COLA – How to do it right
If we want to make the case that people consume less as they age, we should still do the calculations in real space but then shrink the expenses at a certain (real) rate per year, as we propose here. Essentially, chip away a small percentage of the purchasing power every year to account for the fact that we could potentially consume less over time. How much should we shrink consumption (and thus withdrawals) over time? Let’s look at what happens when we do the COLA adjustments as CPI minus x% for several different values of x, see table below.

After 60 years even a tiny value of x will erode our purchasing power by a lot. Personally, we might still be comfortable with 0.5% (around 26% erosion of purchasing power) but certainly not 1.0%. For retirees with a very high initial withdrawal amount, say, $100,000 p.a. it might be possible to go all the way up to x=1%, because that would cut down the real withdrawals to a still-generous $54,720. But does anybody want to start at $40,000 at age 30 and shrink the withdrawals to slightly less than $22,000 at age 90? That will be eaten up by medical bills alone. And forget about going to 1.5% or more. So we will study only the 0.5% and 1.0% versions, in addition to the baseline:
- Baseline: Increase withdrawals in line with CPI
- COLA=CPI-1.0%: Shrink the real withdrawals by 1.0% p.a.
- COLA=CPI-0.5%: Shrink the real withdrawals by 0.5% p.a.
We also throw in another two scenarios of tinkering with the withdrawal amounts over time:
- 5Y-no-COLA: shrink the real withdrawals by 2% for five years and hold them constant after that. Starting in year 6 this would mean that the withdrawals are about 9.6% lower than initially (0.98^5=0.904). That’s the solution often quoted as the panacea to bad market returns early on: simply forego the inflation adjustments for a while. Assuming 2% inflation forecasts over the foreseeable future, this withdrawal pattern would exactly accomplish that. Also, notice we never scale the withdrawal up again. Then a 4% initial withdrawal would mean you consume only about 3.6% of the initial net worth in the long-term.
- 5Y transition 75%-100%: Somewhat the opposite of assumption above; gradually smooth into retirement, for example, by preserving some small income source initially and phasing it out over 5 years, or by simply being extremely frugal initially. Withdraw only 0.75 times the long-term target in year 1, 80% in year 2, …, 95% in year 5 and then the long-term target in year 6 and onward. Also notice that if this procedure yields a, say, 3.5% SWR in the simulations, the initial withdrawal rate would only be 2.625% of the initial net worth and we’d scale that ratio up to 3.5% over the next five years.
See chart below for the scaling of withdrawals in real dollars, compared to $100 in the baseline:

Simulation results
As we did last week with the different Social Security assumptions, let’s look at the median increase in the withdrawal rate that the withdrawal pattern affords us, see table below. We calculate this again for all months, for months with the CAPE between 20 and 30 and for months with the CAPE in that range and the baseline SWR<4%. Quite intriguingly, for the first two assumptions you roughly increase the initial withdrawal rate by exactly the 1.0% or 0.5% rate adjustment to the COLA (+0.932% and +0.462%, respectively) when we take the median of all months. But that advantage quickly melts down to only about three-quarters of that amount when taking the median over only the current CAPE regime (20 to 30) and about half when the CAPE is elevated and the baseline 4% rule would have failed (0.558% and 0.275%, respectively). So, the unpleasant fact is that the COLA-x% works best when we need it the least. That makes perfect sense: because we have such a front-loaded consumption pattern we get hit by the dreaded Sequence of Return Risk!

We get qualitatively similar results with the other two withdrawal patterns. The 5Y-no-COLA adds about a half percentage point (0.519%) to the withdrawals (before taking it away again over the next 5 years!!!) and the 5Y smooth transition into retirement boasts a respectable quarter point increase in the median increase of the SWR (0.244%). But the bump in allowable SWRs melts away again when we take into account today’s high CAPE value and even more when we look at the retirement dates with low enough initial returns that pushed the baseline SWR below 4%. Not a pretty picture.
Next comes a similar table to last week’s; let’s look at the failure probabilities over different initial withdrawal rates, see below. The top part of the table is for today’s CAPE regime. None of the alternative withdrawal patterns offer a failure probability good enough to justify the 4% rule. OK, maybe the CPI-1.0%, where we would push the failure rate to slightly below 10%, but as we said before that would be a bit too aggressive of a cut in consumption for our taste. All other withdrawal patterns still have failure probabilities around 20%, which is completely unacceptable for us.

What the table seems to indicate is that you might gain a 0.25% increase in the SWR for the less aggressive withdrawal rules and 0.50% for the CPI-1.0% rule. In other words, the 3.25% SWR has a 3.1% failure rate in the baseline scenario and with COLA-1.0% we can push all the way to 3.75% SWR to still keep the failure probability in the low single digits. For the other withdrawal patterns, we’re talking 3.50% again, so that’s roughly a quarter point improvement
Why 100% equities?
Why did we use a 100% equity share in the simulations above? It goes back to the earlier findings in the previous parts of the SWR series (especially part 2 and part 3): The success probabilities mostly go up with the equity weight, at least over a 60-year horizon. The only time that’s not true is when right at the start of retirement stocks are seriously overvalued (CAPE>30). But for completeness, we again display the success probabilities over different equity weights, see chart below for a 4% withdrawal rate. The top chart is for all CAPE ratios and the bottom for the CAPE between 20 and 30 (current CAPE is around 28). We confirm again that the success probabilities are almost monotonically increasing in the equity weight:

And the same chart for a 3.5% withdrawal rate. There is again a plateau of 100% (or close to 100%) success rate for high enough equity shares, and that’s true even for slightly overvalued equities (CAPE between 20 and 30). It looks like the sweet spot for less than 100% that exists over 30 years doesn’t carry over to 60 years. It’s the same curse of low bond returns we’ve talked about in the past.

Why we won’t bet on COLA
We did this study about tinkering with the COLA anticipating that probably a lot of folks will ask for it. Personally, we don’t plan to mess around with our COLA and the lifecycle spending amounts very much. The little bit of gain in the initial withdrawal rate is not worth the potential for spending cuts later in life when we are least able to earn a supplemental income.
But isn’t it true that people spend less as they age? Yes, that’s what economists have shown but I would ask back: Do people spend less because they want to or because the have to? Our blogging friend Fritz at Retirement Manifesto had a great post the other day about how woefully unprepared Americans are when it comes to retirement savings. There is some evidence that people spend less in retirement because they have to: Social Security benefits are pretty modest and even adding other supplemental income from retirement savings and annuities, pensions, etc. leaves most retirees still far below the earnings potential of the median household in the 50-65-year age range.
If I were to adjust the lifecycle spending pattern at all, I’d probably raise my old-age consumption. We might travel less, but likely prefer to travel in more comfort and at a higher cost. There will be less backpacking and more cruise vacations after I reach age 60! Moreover, we will certainly have higher health expenditures than today. And on healthcare, it’s a double whammy: higher expenses when we get old and likely less help from the government than even today’s retirees are used to. So, in our personal spreadsheet of spending plans, I currently have a scenario where I bump up withdrawals to more than CPI rates after age 70 exactly for that reason. Another reason not to rely on the 4% rule.
Another great installment, ERN!
Do you mean to tell me $100 won’t always be worth the same in purchasing power as it is right now?!?! How dare you! (Maybe those Trinity guys have PhDs in fake journalism or something.)
You touch on this notion a bit with the mention of healthcare cost/utilization of retirees, and I wonder what the spend patterns (in terms of consumption category) look like for the typical retiree as opposed to the typical non-retiree. For instance, it’s been established that the price of textbooks has increased at a dramatically faster rate than pretty much any other category of good (not that I’m complaining too loudly. 🙂 ). But most retirees wouldn’t be expected to spend anything on textbooks. So it might be the case that the effective COLA/inflation rate for retirees is meaningfully different from average – perhaps lower (or perhaps quite a bit higher). I don’t have any data on this issue, but it’s something that popped to mind as I read your great work here.
Thanks again for the thought-provoking and insightful work, not to mention the great charts and graphs!
Cheers!
For the past 25 years the BLS has tracked an “elderly cost of living index”, just like the better known CPI-U (and other variants). So far CPI-E (as it is called) has been slightly, but not massively, higher than CPI-U.
Thanks, FL.Great point! The effective CPI is most definitely different from the overall CPI. The BLS once introduced a CPI-E (CPI for the elderly) where they re-weight the categories for 62+ year olds. Obviously less education, more housing and more healthcare.
https://www.bls.gov/opub/ted/2012/ted_20120302.htm
https://www.bls.gov/news.release/cpi.br12396.a06.htm
It doesn’t look like the CPI-E is part of any of the news releases so maybe they discontinued the index.
But I would suspect that my personal consumption basket will be more expensive, just based on healthcare.
Thanks for stopping by and Cheers!
ERN
“After 60 years even a tiny value of x will erode our purchasing power by a lot.”
I don’t think I’ve ever seen anyone suggesting reducing expenses over an early retirement. As you show, it leads to pretty nonsensical results over long periods. But the data does show pretty clearly that once people get into their 60s and 70s their consumption goes down in real terms (though it is still going up in nominal terms). Even world travellers find they no longer have the energy for 10 vacations a year and settle for only 5 🙂
But, as you suggest, it is worth keeping in mind that these studies — like most studies — are simply talking about averages. It is possible for people to diverge from the average, sometimes in substantial ways!
Haha, yes, I agree with you. If you keep consumption constant in real terms from age 35 to 65, then start scaling it down, the impact on the initial withdrawal rate is minuscule. I wanted to give the COLA tinkering the best possible chance to succeed. But even then it wasn’t that impressive.
If markets don’t cooperate you will run out of money long before you hit your 70s.
There is also good news in that: Remember that I actually want to increase my withdrawals when reaching my 60s/70s? It also works in reverse: The drop in the front-end SWR is not very large.
So there is some good news in the COLA research!!! 🙂
Cheers!
Another great post, ERN! Thanks!
According to https://www.cbo.gov/sites/default/files/114th-congress-2015-2016/reports/51361-SupplementalData-2.xlsx the INFLATION-ADJUSTED income of the top 5 percent households almost doubled over the last 35 years. Assuming their savings rate has not changed dramatically (I have no data on this but very likely), their real spending (which I guess defines “comfortable” or “luxurious” lifestyle depending on whom you ask) increased annually at CPI + ~2pct. Faster inflation in some categories e.g. high ed costs would be one reason, since higher income folks are more likely to send kids to college and therefore are more exposed. Another would be changes in the consumption basket – eg multiple cell phones per family vs 1 or 2 20 years ago. In any case the net result is spending increasing at CPI+ rate. I guess I did not have to write this up for an economist 🙂
My question is why this topic is never raised in early retirement discussions? In particular given all the behavioral economics findings about our satisfaction dependent on our consumption vs peer group….
Oops, a typo – their nominal (not real) spending increased at CPI + ~2%
Yeah, saw that, too, but I knew what you meant. Haha! Cheers!
Awesome! Thanks for the link. I definitely suspected that folks who have the means prefer not to curb consumption from one day to the next. Also we shouldn’t forget that part of the consumption reduction is just the good old “Your money or your life” story of not having to spend on job-related stuff. So, that means my consumption will not miraculously drop once I hit 65.
Cheers!
ERN
Another great post in the series; you’ve clearly put a lot of thought and effort into creating the various scenarios. My serial one-more-year plan seems more justified the more I read about the myriad ways in which a 4% withdrawal rate can lead to failure.
I have read many times, and been told by my father, that retirees just don’t spend all that much later in life (i.e. after 80 or so). Even if statistics agree, you make an excellent point that reduce spending may have more to do with means than desire for many.
I still say the best hedge against outliving your nest egg is to start an insightful website that has the potential to produce real income well into your early retirement years. Oh, great! You’ve done that!!
Best,
-PoF
Thanks PoF! No worries, if all goes well we should all be set for retirement in 2018. No need for “another year!”
If I learned something from doing this research it’s that 3.25-3.5% SWR works pretty well even under adverse conditions. Especially if you do the smooth transition with part-time work in NZ in the first few years you should be in excellent shape.
Oh, and the blog, too. How could I forget? That will help if it starts paying a bit more than minimum wage, as you put it the other day. 🙂
Hi ERN,
I really enjoy your articles, and am loving this series!! I’ve read the Trinity Study, and whilst I agree that it doesn’t cover nearly enough variables compared to what you’ve shown, it does have charts that are adjusted for inflation. Isn’t that the same as adjusting for CPI?
Thanks for the blog!
Luke
Yes, absolutely, they do have the CPI-adjusted numbers later. I simply find it puzzling that they start their study with the nominal only numbers. They should have just left that out and concentrate on the CPI-adjusted only.
But that said: The Trinity Study still suffers from he averaging problem (as we pointed out in part 3). Trinity doesn’t take into account that today’s valuations are a lot less attractive than their 80+ year average.
Thanks for stopping by!
“Our blogging friend Fritz at Retirement Manifesto had a great post the other day”… Wow, what a pleasant surprise! Thx for the shoutout. I continue to love this series! In our retirement cash flow plan, we’ve put inflation assumptions by category, which can easily be adjusted to build various “what if” scenarios. No where near as scientific as your work, but the same concept. You can’t ignore inflation, but you also can’t let it ruin your life. We’ll likely just modify our withdrawal rate year by year, based on market returns the preceeding year. Great series, can’t wait for the case studies!
Thanks, Fritz! Glad you like the series. That’s great to have a spreadsheet by category. I don’t get into that much detail but just do the CPI until age 70 and then bump it up by a little bit. As I mentioned in an earlier response, the good news is that increasing the COLA that far into the future, there isn’t that much impact on the SWR. Neither by increasing the COLA in the future to account for healthcare or decreasing the COLA to account for less consumption.
Thanks for a great comment!
Cheers,
ERN
Hi,
I just wanted to tell you how much I have learned and appreciated this series. You have done an awesome-I MEAN AWESOME-piece of work here! I am just a regular joe (sephine) close to 50 who wants to be sure I am prepared for retirement. While I thought the Trinity study 4% was a little high myself, I do not have your expertise to explain my concerns well. This series has given me insight on some areas that I had not considered before such as social security will give as much of a boost as I thought it could and how COLA impacts retirement dollars. COLA is an area I really don’t know much about but I know it is critical to understand in terms of retirement. I will have to read this article a few more times to get all this to sink in.
I do have a request you might want to consider. What is the best way to spend your money in retirement in terms of types of accounts, taxes, and considering other income sources such as pensions and social security? I know that is a loaded question and maybe even another series, but I have seen examples that show a significant variance in the amounts available to spend based what accounts (Trad IRA, Roth IRA, taxable accounts) are accessed first. But I wonder how taxes play into this too.
Again thank you for such a great series and I look forward to learning more from you. I am just so impressed with all the work you have done here. Thank you!
Hi Mary,
Thanks for the compliment!
The right withdrawal strategy and the correct sequence of withdrawals out of:
a) taxable accounts (mix of tax-free cost basis and taxable long-term gains),
b) tax-exempt accounts (e.g. Roth)
c) tax-deferred accounts (all taxable at ordinary income tax, e.g. 401k)
is a huge topic all by itself. There was an excellent paper dealing with all of this:
http://www.cfapubs.org/doi/pdf/10.2469/faj.v71.n2.2
If the tax structure is flat it turns out that the order of withdrawals doesn’t matter (much). But with a progressive tax structure, as we face in the U.S. there are ways to minimize taxes over time. Do Roth conversions to fill up unused portions of the lower tax brackets, for example.
It’s a fascinating topic with potentially fast changing assumptions. For example, there could be a rise in capital gains taxes from 0 to 6% in the first two brackets and a flat 12% ordinary income tax in the lower two tax brackets according to some proposals. Once there is more clarity on the tax situation I’ll definitely write more about the topic.
Cheers!
ERN
“I just wanted to tell you how much I have learned and appreciated this series.” |
I 2nd this.
You guys are definitely way smarter than me, but I’m not sure why we need to take COLA into account. Humor me with some dummy numbers for an example. $1 million dollars invested 100% in stocks growing at 7%/yr. Inflation is 3%/yr. Withdrawing 4%/yr as I can live off $40k/yr. Ignoring compounding for simplicity. At the end of year one, I retire and I should have $70k of growth. But I only withdraw 4%, or $40k to live on for the next year. Thus my new investment value is $1.03 million. Then at the end of year two, my growth will be $72k. I will withdraw 4% which is now $41k. My account value is now $1.06 million. My 4% withdrawal value will go up each year because I’ve already accounted for inflation just like you have with your “real” rates of return as opposed to “nominal”. However, in today’s dollars, I will be withdrawing and spending a flat $40k each year. So my withdrawal should keep up with in flation which drives (and thus is essentially identical to) COLA. I think by accounting for COLA, you are in essence counting inflation against yourself twice.
Ok, where did I go wrong? I’m sure you guys are right, but I’m just not able to wrap my head around why.
That’s roughly how I compute my simulations. I use a slightly different method: simply take the inflation out of the returns. So, if the nominal return was 7% and inflation was 3% then I use the 4% real return. If you withdraw 4% you are back to where you started after one year. We definitely make sure we don’t count COLA twice. When we work with real inflation adjusted return numbers we assume the withdrawals are flat, which is equivalent to COLA in nominal space.
I hope that’s clearer. Or more confusing, haha!
Thanks for stopping by!
Another reason that spending may go up around age 70 is required minimum distributions from IRA’s, 401(K)’s, etc. In my own calculations for one scenario, I find that if I retired at the end of this year that when I’m 80, 16% of my COLA-adjusted SWR is used to pay taxes on RMD’s.
Yes, good point. You could always reinvest the extra unneeded withdrawals, but the tax bill is there to stay. Can get expensive as you point out. Thanks for sharing!!!
Let me see if I’ve got this straight: we’re supposed to ignore the peer-reviewed academic studies of licensed financial analysts, economics professors, and Nobel prize winners, and instead stake our financial futures on the postings of an anonymous blogger? Right, got it.
Let me see if I got this straight: we’re supposed to ignore my well-researched and thoughtful analysis and tie our financial future on the Trinity Study? I wish you good luck, my friend. In the South we’d say “bless your heart”
Also, let me be clear, I have great respect for Nobel laureates. That’s because I studied under 2 of them in my PhD program. Last time I checked, though, the authors of the Trinity study have not received the Nobel. Unless there is a Nobel prize for bungling safe withdrawal rate studies. How many classes from Nobel laureates have you taken?
I also have great respect for academic publications because I have many publications in top journals myself. And I have served as referee for many journals. Have you?
RD,
I does not take much to determine that the writer of this blog is more than qualified to contribute. Before you “snark off’ in the manner you have you should done at least a bit of homework, it’s really easy. If you had you would have garnered immediately that lying under all the high quality quant work provided (free and without sales agenda) is a deep understanding of the subject. I suggest you do a bit of soul-searching and perhaps retract your unfounded indictment. Then, you might consider consuming the contents here as it may well be to your advantage. My comments here should be deemed less a defense of ERN and more an assault on unfounded statements by others. Our would is already ‘noisy’ enough and we are sorely in need of objective conversations on all important matters. This blog is a very worthy addition.
Thanks for the kind words! 🙂
This part was comic relief… enjoyed it very much!
In my opinion, not only is Ern’s analysis logical and convincing, several other readers who are clearly educated and experienced in this space have come forth with supportive comments and compliments. I’m not sure what kind of ax Rocket Dog thought he had to grind (14 months ago), but it seems quite misplaced here.
Is there a calculator or a study that shows taking the cola every other year. Not forgoing it totally, skip year 1 and in year 2 take both. year 3 no increase and year 4 take both etc. out till year 50 or 60? Thank you
With 2% inflation you’d lag behind the initial year by 2% every second year. I’d simply approximate this as all withdrawals are 1% lower, so your 3.5% rule became a 3.465% Rule.
Thank you for taking the time to answer me. , I thought it would have had a much bigger impact. Forgoing a yearly cola and making up for it the next year only nets 350 dollars per million increase in the initial swr. Guess this is why I never read about this strategy before.
Yeah. It’s a small difference. 🙂
With the average long-term inflation being 3.7% since the end of WWII, why not take at least a 2% COLA every year if not much more? I understand how devastating it is to gross dollar amount, but isn’t that just the reality?
That 3.7% average was very unevenly distributed! Very high in the 1970s/80s. But going forward, I doubt that the CPI will be much above 2%.
Karsten, do you see any reason to simply not inflate one’s projected retirement expenditures by a conservative rate (I assume 4%) and run one’s spend down/survivability projections based on that? (I’ll note I’m amused that my last projection showed me needing to draw down my portfolio by over $1m in the year I turn 99…)
Some older retirees can certainly draw down their real withdrawals, i.e., CPI-x%. Most people slow down in their 70s and 80s.
Something I don’t understand when I look at inflation and retirement is why are there no articles about how over time you could keep your standard of living the same but have a lower SWR every year?
ex. Assumptions: CAGR 10.16%, inflation 2.52%, 100% equities for simplicity, fund each year of retirement up front on Jan 1st.
YEAR 1
$1mil equities
$40k withdrawal for living expenses on Jan 1st
SWR = 4%
YEAR 2
$960k*1.1016 CAGR = $1,057k
$40k*1.0252 inflation = $41k
SWR = 3.87%
As a percentage of your overall wealth, aren’t you spending a smaller percentage every year if your only goal is to keep up with inflation?
If that is true, then assuming you can mitigate sequence of returns risk, perhaps by using a bond tent, wouldn’t a much higher initial withdraw rate be advisable? Like 5% or 4.5% if at the end of the bond tent you are down to 3.5% or below?
You don’t get 10.16% return for sure.
The retirement-phase part of the bond tent is the glidepath back to a higher equity share. You can alleviate Sequence Risk somewhat, but never completely. See parts 19 and 20. The SWR with a GP are still below 4% in the worst-case scenarios.