
Update: We posted the results from parts 1 through 8 as a Social Science Research Network (SSRN) working paper in pdf format:
Safe Withdrawal Rates: A Guide for Early Retirees (SSRN WP#2920322)
If you’ve been following our series on withdrawal rates (part 1 here) you have noticed that we’re quite skeptical about the 4% rule. That would be especially true for early retirees with a much longer horizon than the standard 30 years. Though, by reading through some of the research from the heavy hitters in the retirement research world, even the foundation of the 4% rule over 30 years seems to be crumbling a little bit:
- Wade Pfau has been warning that due to high equity valuation and low bond yields the Trinity Study success rates are likely overrated. His argument is similar to ours in Part 3 of this series: we live in a low return world now and comparisons with past average returns could overstate the success probability of the 4% rule. He uses a slightly different methodology (Monte Carlo simulations) but reaches similar results.
- Even Michael Kitces, arguably one of the great defenders of the 4% rule, has (inadvertently?) demonstrated that the 4% rule over 30 years isn’t all that sound. In the discussion after the famous “ratcheting post,” some readers (including yours truly) pointed out that we can’t replicate the success of the 4% rule with 1965/66 starting dates. Nothing to worry about, Kitces replied, all you needed to do is to use a very short-term bond (1-year T-bills) for the bond allocation, and you sail smoothly during the 1970s. Who would put 40% of the portfolio into 1-year Treasury bills (essentially CD interest rate) rather than trying to harvest the term premium of longer-term bonds? Very easy: someone with 20/20 perfect hindsight who knew that longer duration 10Y bonds will get hammered in the 70s and sink the 4% rule even over a 30-year horizon.
And I just became a little bit more skeptical about the 4% rule even over a 30-year horizon! But there is (at least) one prominent 4% SWR firewall still standing. In countless blog posts, discussions, forums etc. I have heard this quote (or variations of it):
“The 4% rule worked just fine during the Tech Bubble and Global Financial Crisis”
Let’s shine some light on that claim.
Real Returns 12/31/1999-12/31/2016
The first suspicions about the validity of that claim came when I looked at the average returns in equities and bonds since December 31, 1999, and they didn’t look so appealing. Equities (S&P500, dividends reinvested) returned only slightly more than 4% p.a. in nominal (!) terms, and 2.36% p.a. in real, CPI-adjusted terms. How can that justify a 4% withdrawal rate? Isn’t the real portfolio return supposed to be roughly equal to the real rate of return to make this work? Below we plot the cumulative returns (before even withdrawing anything!) of different Equity/Bond portfolio mixes, adjusted for inflation.

Note, these are already the returns taking out 0.05% p.a. in ETF expense ratios, hence, the 100% equity portfolio return dropped from 2.36% to 2.31%. None of these portfolios would have stayed even close to a 4% real return target over time. Every month and every year we stay below that black line we dig deeper into the principal. When someone wants to tell me that the 4% did well since 2000, that doesn’t even pass the smell test.
ERN Simulations
So, without simulating anything I already know that the 4% rule would not have fared very well and you would have wiped out some portion of your principal. How much? Well, let’s run the ERN simulations and see for ourselves. Since we started this series I updated the realized returns all the way to December 2016 (Parts 1 through part 5 used realized returns only up to 9/30/2016). Let’s see how the 4% rule would have performed under different portfolio allocation assumptions. We also took the liberty to extend the equity and bond returns beyond the first 17 years. As described in our initial SWR post, we assume that future real equity returns are equal to the average real return since 1871 (about 6.6% p.a.). We now assume that the bond return is going to be equal to the 12/31/2016 10Y nominal bond yield (around 2.5%) minus 2% inflation = 0.5% p.a. real for the next 10 years, then also returning to its long-term average of 2.6% real.
Side note: That’s actually a pretty aggressive estimate for future returns given that the CAPE is so high! Recall our post from last year, where we plotted the current CAPE earnings yield (=1/CAPE) vs 10-year forward equity returns: If the CAPE is above 25 (yield <4%) the 10Y forward equity return never exceeded the 6.6% mean real return, see chart below!

Below is a time series chart of the real portfolio value over time for different equity portfolio shares between 50% and 100%. A portfolio would have taken a serious hit after 17 years: In real terms, the portfolio is down by anywhere between 30% and 75%.

But can the portfolio recover? Well, of course, it can if stocks go up by between 50% and 300% in the next year. But even the somewhat optimistic assumption of 6.6% real equity returns over the next 13 years will only further deplete the portfolio, see the downward-sloping portfolio values starting in 2017.
Next, we can also calculate the SWRs that would have exactly matched a specific final value target after 30 years. Again, that’s using the 17 years of actual return data plus the 13 years of return forecast. See chart below:

In January 2000, you could have withdrawn 4% or more if you weren’t too aggressive on the equity allocation and you’re OK with running out of money after exactly 30 years. 4% probably wasn’t such a bad assumption for regular retirees who were 65 years old in 2000. But early retirees? You probably want to ensure that you have about 75-100% of the initial principal available half-way through your retirement. Depending on the equity weight, 2.6-3.1% for capital preservation and 2.9-3.5% for 75% capital preservation was all you could start withdrawing in 2000. And that’s under the somewhat rosy assumption of 6.6% real equity returns for the next 13 years (despite elevated CAPE ratios) and zero volatility along the way. Not a pretty picture! If anything, the 2000-2016 episode was a worst-case scenario for early retirees. Quite the opposite of the “4% rule did OK” myth.
Welcome to the Potemkin Retirement Village: Successfully using the 4% Rule since January 2000!
So, how can one still claim that the 4% rule is A-OK after 2000? We’d have to be deceived by a financial Potemkin Village. I gathered some examples below:
Potemkin Village #1: Michael Kitces’ post on the topic
Just to be clear, I am not saying that Kitces wants to deceive anybody in his post on the 4% rule post-2000. He’s obviously an extremely smart guy and puts out very fascinating material. I also found that he’s very kind and gracious in replying to questions and requests.
But his post on the matter is still a Potemkin Village. All the pertinent information is in that post. It’s all 100% accurate, completely confirmed by yours truly. Everybody who wants to get an objective picture of the 4% rule in the 2000-2015 period will walk away with the exact same information that I saw:
- The 4% rule worked probably all right for the average 65-year-old who retired in 2000. That person may make it through to 2030, especially considering that the person is now 82 years old and may curb consumption a little bit, in line with losing almost 40% of the real portfolio value. Not so much, though, if there are medical bills piling up and withdrawals actually grow faster than CPI!
- But the average early retiree would have trouble making the 4% rule work. By 12/31/2016, only 17 years into the retirement you would have wiped out a big chunk of the portfolio as we show in our calculations above and even then you have to cross your fingers and hope for above average equity returns, something unprecedented when the CAPE is at 28. Good luck with that!
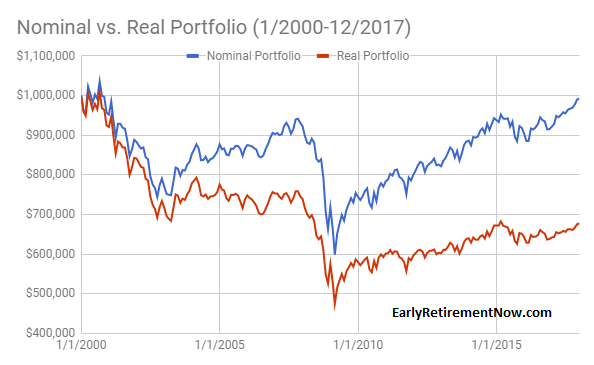
But how about folks who don’t want to see the faults in the 4% rule? Say, someone who has a predetermined conclusion that the 4% rule worked great in 2000 even for early retirees. If that person reads the Kitces article he/she will come to the exact opposite conclusion. See the following chart, here reprinted with permission:

Kitces used a 60/40 Stock/Bond mix and now it looks like the year 2000 cohort is back to maybe $930,000. Doesn’t look so bad, right? That proves the 4% succeeded during that time! Not so fast: read the fine print! This is the nominal value. $930,000 in nominal terms means that the real value is down to somewhere in the low $600,000s, consistent with our calculations.
Also, right after the Kitces post (July 2015) the portfolio value is trending down, see our time series chart above. Recall, that our calculations take into account the pretty impressive 2016 equity return (12% with dividends!) and we’re still continuously melting away our principal! That’s because the 4% withdrawal rate has now grown to a 5.7% to 16% withdrawal rate (depending on the equity share). Remember, there’s only between 25 and 70% of the portfolio left, so the withdrawals are now higher relative to the principal (4%/0.7=5.7%, 4%/0.25=16%). You will eat into the principal even more during the remaining 13 years (and we are not even taking into account equity volatility and Sequence of Return Risk). It may all still work out for the traditional retiree with 13 years to go, but not for the early retiree with 40+ years to go.
Update 2/27/2018
I ran the simulations all the way to the end of 2017. Now the nominal value is almost back to $1,000,000! But the real value is still depressed at less than $700,000 and below the peak in early 2015. Despite the impressive equity performance in 2016 and 2017!
Potemkin Village #2: The Stock/Bond Allocation
Recall the “ratcheting post” from Kitces, written in June 2015? Compare that to the post about the 4% during the post-2000 period, written only a few weeks after that, and you will notice one subtle difference:
- In the ratcheting post, the 4% rule worked during the 1970s because the 40% bond allocation was invested in short-term bonds (1-year T-bills).
- In the post on the dot-com bubble and global financial crisis, Kitces uses a 10-year Treasury bond.
If you had followed the advice from the ratcheting post and invested in 40% short-term bonds starting in 2000 you would have lost the beautiful diversification benefit of bonds and you would have missed out on the big bond rally. The nominal portfolio value would have gone down to just under $500,000 in nominal dollars and below $350,000 in real, CPI-adjusted dollars by December 31, 2016. Good luck making that money last until even 2025. If you haven’t cut your consumption yet, the annualized rate of withdrawal would be almost 12% now. To bring back the withdrawal rate to a more manageable 4% we’d have to cut withdrawals by about two thirds!
I wonder if all those who tout the 4% rule as so safe realize that in the most optimistic interpretation it will involve timing the bond vs. cash allocation. Better get your term premium model up and running, everybody! And the worst possible interpretation is that the success of the 4% rule is based on some pretty blatant data snooping and hindsight bias, even for the traditional retiree with a 30-year horizon.
Potemkin Village #3: The Trinity Study
Strictly speaking, the Trinity Study indeed covers the DotCom bust and the Global Financial Crisis. And it shows that the 4% rule is safe. But only towards the end of their 30-year windows. To my knowledge, the most recent installment of the study is from April 2011 with data covering 1926-2009. Therefore, we don’t have any data about the year 2000 retirement cohort yet. Strictly speaking, it will take until December 31, 2029, to get word from the Trinity Study about whether the 4% rule worked with the January 2000 starting date. What if that cohort already runs out of money in 2025? We show that is a real possibility unless stocks return more than their historical average going forward. Will the Trinity Study still be quoted as the defender of the 4% rule for the early 2000s until they actually confirm it didn’t work?
Summary
The often quoted statement above needs a few important qualifiers for us to agree with it:
The 4% rule worked just fine during the Tech Bubble and Global Financial Crisis IF:
- You have a 30-year retirement horizon.
- You are comfortable depleting your money at the end of that horizon and/or significantly cutting your real withdrawal amounts.
- You had a relatively low equity portion (60% or less).
- You are not a passive investor but rather have the foresight to time long-term vs. short-term bonds. Specifically, you needed the ability (or dumb luck?) to implement the exact allocation that didn’t work in 1965/66 and avoid the allocation that did actually work quite beautifully in 1965/66.
- Did we miss any other qualifiers? Please let us know in the comments section!
I’m slowly working my way through your blog starting back from 2016. I’m currently sitting here in the first 1/4 of what turns out to be a long, detailed and interesting series on SWR. The holy grail of SWR = 4% across ALL blogs and discussions (pro or against) is interesting.
In my case I came across the 4% rule and its many derivatives AFTER I worked out via many personal Excel simulations how much I would need based on my projected (guess) spending needs for 30 years of retirement which starts this year at age 60. And what is interesting, based on my personal MM/CD/Bond/Equities/Brokerage/Deferred Tax/Roth/HSA etc etc accounts, is that I end up with VARIABLE annual spending rates from 2.9% to a little over 5%. So let’s say I seem to average out at… drum roll… 4%.
It’s not necessary to go into the details of my spreadsheets (ugly but functional for me) BUT I think it is amusing (outright funny!) that pesky 4% keeps showing up! Even if it is an average. And in the fact I wasn’t aware of it or the FIRE community until about 12 months ago. I was just doing my own thing.
Thank you for the thought provoking series and to all the comments that add their own ideas and flavor to your series. I can’t wait to see what the future holds for you when I catch up to you in 2019! 😉 I don’t always agree with what you have to say but if I agreed with everything I wouldn’t be here reading your blog and learning!
Thanks for sharing!
And I tend to agree: Among all the different scenarios, a very young retireee with a SWR=3.25% and an older early retiree with a SWR in the high 4%, if you average you get again the 4% rule of thumb. But just like shoe size 10 is the average (for guys, I presume) we shouldn’t all wear size 10. It’s a very personal affair.
Year 2000 retirees who used the 4% rule look to be in very good shape today, despite the current bear market in stocks. For those who started with 60/40 portfolios (TSM and TBM), they now have about 59% of their inflation-adjusted starting balance remaining, almost 14.7 years of spending if we assume 0% real growth, but only 10 years of spending left. They could buy 10 years worth of TIPS (despite the current negative real yield) and still have a good 4.5 years of spending that they could invest very aggressively if they so desired. But even if they left it all in the 60/40 allocation, they’re still very likely to be fine.
William, that’s one way to look at it. But I think you’d find if you retired in 2000 in that situation you’d be freaking out. You have less money now than when you started (despite experts telling you’d it’d likely grow), your 4% inflation adjusted withdrawals are now closer to 7% and the world would feel like it’s on fire. The plan has “worked so far”, but I think it’d feel like it’s failing.
That’s the problem with many projections – they don’t take into consideration how someone would feel as time goes on, and what they’d likely do in response. Human behavior is the biggest killer of plans and performance!
Ron, I entirely agree that year 2000 retirees would have had many opportunities to be justly fearful along the way. See their portfolio down by almost 50% in inflation-adjusted dollars by early 2009 would have freaked out almost anyone. Withdrawing 3.5% or 3% would not have changed that very much though. Those who withdrew 3% would still have lost about 44% of their inflation-adjusted starting balance by March of 2009 and were probably still freaking out. About the only assets that would have really helped during that crucial first decade from 2000-2009 were small-cap value and gold, the former of which Karsten is very skeptical of going forward and the latter of which he’s shown would have likely benefited retirees in the worst historic periods but he’s still at least ‘on the fence’ about.
But the point I was mainly addressing was Karsten’s remark that he was dubious as to whether the ‘4% rule’ would hold up for year 2000 retirees. It’s obviously possible, but it seems very unlikely at this point. Stocks could fall by another 50% and these retirees would still have almost enough to make it 10 more years with 0% real growth.
Again: the 2000 cohort was often touted in the FIRE community: “see, they are doing fine, so the 4% Rule is safe for early retirees” which is still very dubious. Even though the traditional retirees will likely make it now. 🙂
Yeah, in 2009, even the traditional retiree would have been scared even though it turned out that the next 10 years would have saved your retirement.
Also, the retirees with a longer than 40-year horizon in 2000 are still in grave danger of running out of money.
Very good point.
First, as you show, 2000 may just work out pretty sweet for traditional retirees. Not so much for early retirees who had a 50-year horizon back then and now still face another 30 years. You will likely not make it another 30 years with an effective WR of now 8%.
Regarding 60/40 safe withdrawal rate (SWR) starting in 2000.
If you hadn’t used the S&P500 and used a value fund instead, you’d be just fine. Value funds didn’t experience the huge drawdowns of 2001 and 2002.
It makes sense that the S&P500 would experience the huge drawdowns since it contains the top bought stocks. Stocks that in 2000 often didn’t have any profits.
Here’s an example using value funds and 40% long term treasuries.
Note that the tool I used threw out an S&P500 fund (VFIAX):
Fund…… Portfolio Percentages
FLPSX…. 23
VUSTX…. 40
VFIAX…. 0
OSMAX…. 0
PRBLX…. 15
MERFX…. 10
FNMIX…. 5
SGENX…. 7
ANNUAL PORTFOLIO RETURNS
2021…. 4.11
2020…. 13.52
2019…. 18.38
2018…. -3.20
2017…. 11.77
2016…. 5.84
2015…. -1.05
2014…. 14.17
2013…. 8.58
2012…. 9.36
2011…. 12.30
2010…. 11.75
2009…. 13.24
2008…. -4.96
2007…. 7.49
2006…. 9.57
2005…. 6.43
2004…. 11.20
2003…. 18.00
2002…. 5.00
2001…. 10.36
2000…. 15.60
CAGR…. 8.80
If we plug the returns into a tool to backtest SWR starting at 4% withdrawal. Assumes a 3% raise each year for inflation:
Year………………….Port Return…Ending Port Val… AnnualWithdrawal
2041……. 2020……. 13.52……. 3,433,563.80……. 74412
2040……. 2019……. 18.38……. 3,088,311.44 ……. 72244
2039……. 2018……. -3.20……. 2,668,045.39 ……. 70140
2038……. 2017……. 11.77……. 2,826,562.81 ……. 68097
2037……. 2016……. 5.84 ……. 2,588,171.56 ……. 66114
2036……. 2015……. -1.05……. 2,506,021.30 ……. 64188
2035……. 2014……. 14.17……. 2,595,618.14 ……. 62319
2034……. 2013……. 8.58 ……. 2,326,364.42 ……. 60504
2033……. 2012……. 9.36 ……. 2,196,734.39 ……. 58741
2032……. 2011……. 12.30……. 2,060,844.66 ……. 57030
2031……. 2010……. 11.75……. 1,884,445.71 ……. 55369
2030……. 2009……. 13.24……. 1,734,425.62 ……. 53757
2029……. 2008……. -4.96……. 1,577,707.86 ……. 52191
2028……. 2007……. 7.49 ……. 1,713,438.76 ……. 50671
2027……. 2006……. 9.57……. 1,639,840.03 ……. 49195
2026……. 2005……. 6.43 ……. 1,540,261.64 ……. 47762
2025……. 2004……. 11.20……. 1,490,802.46……. 46371
2024……. 2003……. 18.00……. 1,381,154.94 ……. 45020
2023……. 2002……. 5.00 …….1,207,489.07……. 43709
2022……. 2001……. 10.36……. 1,190,357.68 ……. 42436
2021……. 2000……. 15.60……. 1,115,981.89……. 41200
2020……. Starting Port Value……. 1,000,000.00……. 40000
I hope formatting comes out readable!
Good point. But value funds also underperformed post-2009. And all the styles that previously outperformed the market (small-cap, value, small-cap-value) have been total duds recently.
My personal working assumption is that all style premiums are zero in the future. There is no magical 2% extra performance out there anymore. Even though Merriman et. al. still keep up their hopes.
Value has been doing great this year:
2021 returns
FLPSX…22.57
spy…13.11
prblx… 12.56
CAGR from 2009 to 2021
FLPSX…13.7
SPY….14.6
prblx….14.4
All I want is “Guaranteed. Safe Investment. 8%”. (There was a fellow in Indy that had a commercial where he said that back in the late 90’s except it was 6% instead of 8.) No such thing of course but it’s what I shoot for.
I’m going to try to keep positive like Buffet rather than Hussman. I’ll have to look at who Merriman is.
Thanks for all the work you’ve done. Lots to read.
Best wishes.
Good luck.
Jim
That’s great! Win some lose some. Hence my working assumption: all styles biases have an expected zero excess return going forward. Hard to time this.
James, the tricky part about performance stats is they can be pretty misleading unless you stand back and look at the complete picture. If you added just five years, 1995-2000, to that calculation the numbers would likely look very different. Normally twenty years is a good healthy time frame but it starts just on the eve of a giant crash. Including a crash without including the run up to the crash will usually make those crashers look much worse. Include the runup that lead to the crash and see what happens. I’ll use Fidelity’s Value fund vs the S&P500:
2000-2020
FDVLX 8.8%
S&P500 6.5%
1995-2020
FDVXL 9.8%
S&P500 10.4%
This isn’t an argument for or against the funds, just a discussion of the underlying stats.
“Statistics are like bikinis. They show you a lot, but can cover up some very important things!”
Great analogy on statistics!
My goal is to avoid sequence of returns problems. We see that if you retired in 2000 and were using the S&P500 or QQQ, you’d have been hurt badly. That’s hindsight of course but it makes sense to me that a value fund would be more stable because the S&P500 mostly favors fads. I’ll sacrifice some return for stability.
Good luck!
Value used to have the property of getting hammered more during recessions. It used to be explanation for the excess return. That correlation changed in 2001, though.
See here: https://earlyretirementnow.com/2019/06/12/my-thoughts-on-small-cap-and-value-stocks/ (section “More on the value premium”)
Good points! Knew the bikini quote but it’s always a good laugh! 🙂
I just read your SSRN working paper, and look forward to reading the remaining parts. Thanks a lot for sharing these interesting results. A few of comments:
[1] The 1994 paper by Bengen (https://www.retailinvestor.org/pdf/Bengen1.pdf) that recommended a 4% SWR for a 50-75% stock portfolio also showed that the portfolio lasted shortest for those who retired in 1966 (please see Figures 1b and 3a), but he concluded that the above recommendation works for a 30 year retirement horizon. It is surprising that you found it doesn’t, and I wonder if it is due to small differences between historical return data from different sources.
[2] The aforementioned 1994 paper by Bengen also shows that the 4% rule does not work for a 100% stock portfolio (Figure 2) or for retirement horizons longer than 30 years (Figure 2). So the 4% rule isn’t meant to be a blanket rule and is for a specific portfolio (50-75% stock) and a specific retirement horizon (30 years or less). His paper recommends a 3% SWR for retirement horizon of 50+ years (Figure 2), and it is very reassuring that your results confirm that in great details.
[3] Are you sure you are using the correct return data for those who retired in Jan 2000? A quick backtest in Portfolio Visualizer (https://www.portfoliovisualizer.com/) for retirement start date Jan 2000, initial balance $1M, and inflation adjusted annual withdrawal $40k shows that while the 4% rule was disastrous for a 100% stock portfolio (e.g. adjusted for inflation, SPY dropped to $241k in Feb 2009 and remains at $314k as of Aug 2021), it worked just fine for balanced funds with ~70% stock allocation (e.g. adjusted for inflation, VWELX dropped to $733k in Feb 2009 but crossed $1M in Oct 2010 and reached $1.72M as of Aug 2021, FBALX dropped to $636k in Feb 2009 but crossed $1M in Jul 2013 and reached $1.63M as of Aug 2021). Can you please double check your calculation for allocations other than 100% stock?
[4] While the results shown in your SSRN working paper is very informative, it will be extremely helpful if you could add results on maximum drawdown for different retirement dates (assuming 3% withdrawal from 50-100% stock portfolio).
[5] Your conclusion that a 100% stock portfolio is suitable for early retirees sounds nice in good times, but is really scary in bad times like great depression. According to yahoo finance, S&P500 dropped (nominally) from $31.83 in Sep 1929 to $4.41 in Jul 1932, so a 100% stock portfolio may drop from $1M to $139k nominally (~$173k inflation adjusted) in less than 3 years. Perhaps you can tolerate such extreme drawdown in your retirement portfolio, but most people (including me) can’t. Don’t you think it is better to have 2 separate portfolios: a balanced fund (67% stock) to cover the early retiree’s expenses (3% SWR for 60 years) without extreme drawdowns, and a separate 100% stock portfolio for heirs that will be left alone for 60 years (extreme drawdowns are acceptable here as the funds are not needed for several decades)?
Disclaimer: I am not a financial/investment advisor and have no expertise in finance. I am just a random guy interested in financial independence.
Thanks for your comments. Here are my replies:
[1] Bengen’s paper was written in 1994, so he didn’t even have 30 years of return data to simulate the bad cohorts starting in the mid-to-late 1960s. According to my simulations, anything between 50/50 and 75/25 allocation had at least several failures of the 4% Rule between 1965 and 1968.
[2] That said, I agree with Bengen’s work in that you will need a lower WR to sustain longer horizons. Never claimed anything else.
[3] Yes, I’m using correct return data. My results line up pretty nicely with the simulations at portfolio visualizer:
https://www.portfoliovisualizer.com/backtest-asset-class-allocation?s=y&mode=1&timePeriod=2&startYear=2000&firstMonth=1&endYear=2016&lastMonth=12&calendarAligned=true&includeYTD=false&initialAmount=1000000&annualOperation=2&annualAdjustment=3333&inflationAdjusted=true&annualPercentage=0.0&frequency=2&rebalanceType=4&absoluteDeviation=5.0&relativeDeviation=25.0&leverageType=0&leverageRatio=0.0&debtAmount=0&debtInterest=0.0&maintenanceMargin=25.0&leveragedBenchmark=false&portfolioNames=false&portfolioName1=Portfolio+1&portfolioName2=Portfolio+2&portfolioName3=Portfolio+3&asset1=LargeCapBlend&allocation1_1=60&allocation1_2=100&asset2=TreasuryNotes&allocation2_1=40&allocation2_2=0
Check the balance at the end of 2016, CPI-adjusted and you get slightly above $600k for the 60/40 portfolio and about $250k for the 100% equity portfolio.
Also: I never used any “balanced funds” in any of my simulations. We don’t have enough return data going back to 1929 or even 1871. All my simulations are for fixes S/B weights, not for balanced funds.
[4] I have an extensive series on the topic and get tons of requests about what I should include in future posts. I can’t promise I will implement every suggestion. If you don’t want to wait, you can simulate your own numbers in my free Google Sheet. See Part 28 of the series.
[5] I don’t recommend a 100% equity portion. 75%/25% Stocks/Bonds would be best. 100% will give you a louse failsafe WR.
That said, there are circumstances where 100% equities “optimizes” your objective: when you try to maximize the success probability. But keep in mind that while failures will be less frequent, they will also be more painful if they occur. Not recommended!
Excellent analysis. Appreciate all the great work you do. Could you update this topic with 2000-2022/2023 YTD data? Interesting to see how things are shaping up for 2000 retires.
Please see here: https://earlyretirementnow.com/2022/11/02/2022-worse-than-2001/