
When we read about withdrawal strategies in early retirement, the cash cushion is often one crucial ingredient. Simply keep a little bit of cash sitting around on the sidelines, dig into that cash during an equity market drawdown and avoid selling equities until the next recovery. How much cash? Well, the Global Financial Crisis raged for “only” 18 months and the average garden-variety recession should last a year or even less. Thus, even if we assume that the equity market takes a little bit longer to recover it will take only very little cash and very little opportunity cost to achieve this. The whole issue of Sequence of Return Risk is solved! Who knew this was so easy? This is almost too good to be true! Well, unfortunately, it might be just that; too good to be true.
Here are our top six concerns about the cash cushion:
1: Funny accounting: We can’t keep our dividends and eat them too!
One tripwire to avoid is the following funny accounting mistake: For this example, let’s assume a 3.5% withdrawal rate and a 2% dividend yield. Great! We need only 1.5% to supplement our dividend income. So, a cash cushion of around 7.5% insures against a 5-year equity drawdown, right? Yes, but here’s one pitfall. We have to pick one of these two options:
- Either we assume that we eat the dividends but then we need insurance against a longer event because without reinvested dividends the drawdown will take longer.
- Or, we assume we don’t eat the dividends and they help us recovering faster from the drawdown. But then we’d need a bigger cash cushion because now we need 3.5% in cash for each year of drawdown we want to insure against.
Sorry for pointing out something so trivial, but you’ll be surprised how often we see folks making the mistake of double-counting the dividend yield, i.e., design the annual cash cushion size as withdrawal rate minus yield (i.e., assuming consumption of dividends) but then using the equity drawdown length of the Total Return Index, i.e., with dividends reinvested. As we show in the chart below, without reinvesting dividends the drawdowns can be painfully long (top chart). Several decades long, so good luck keeping enough cash around for that! When reinvesting dividends, the drawdowns are shorter (bottom chart) but also require more cash cushion per year, i.e., the whole 3.5% in our case, 4% per year for with a more aggressive withdrawal rate. There’s no free lunch!

2: Drawdowns can last even longer when taking into account inflation
Another pitfall: The length of the drawdown can be substantially longer than some people assume. We need to reach not just to the previous equity market peak, but that peak plus inflation if we assume that we make cost-of-living adjustments in our withdrawals. That doesn’t make much of a difference, you think? Think again! Most drawdowns in the past have lasted substantially longer when taking into account inflation, see chart below.
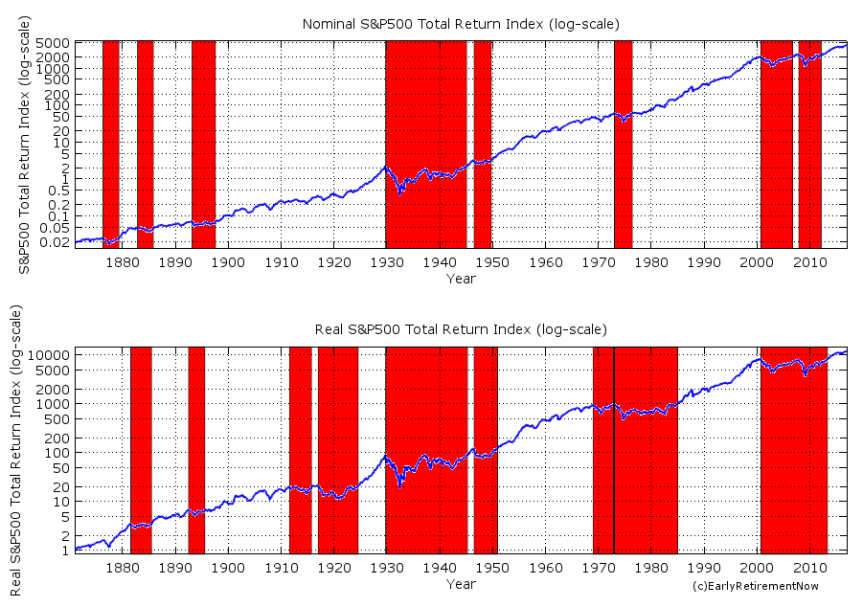
The bottom panel plots the real S&P500, with drawdowns of 36+ months shaded in red (nominal chart in the top panel for comparison). Since 1910, there were seven major drawdowns in the real S&P500 index. Some of them were back to back with a short reprieve in between, and each time it was too short to restock the cash cushion in preparation for the next bear market. So we might as well interpret them as one single event, which means that in the last 107 years there were four major drawdown events:
- 6/1911 – 8/1924: 13 years and 2 months comprised of two drawdowns with a short 13 months of reprieve in between.
- 8/1929 – 12/1950: 21 years and 4 months comprised of two drawdown periods with a short 13 months reprieve in between.
- 11/1968 – 1/1985: 16 years and 2 months comprised of two drawdown periods with a short 1-month reprieve in between.
- 8/2000 – 5/2013: 12 years and 9 months
In other words, over the last 107 years, we would have spent 60+ years in major, decade-long drawdown phases. Over the last 50 years, we would have spent almost 29 years in the red. So, pronounced drawdowns that require 10+ years of cash cushions are not the exception but the norm! Multiply the drawdown length above with our desired withdrawal rate (3.5%) and we get completely unrealistic, downright preposterous cash cushions of somewhere between 42% (12 years) to 73.5% (21 years). Ain’t gonna happen!
3: Don’t expect much help from consuming the dividends
What if we had consumed the dividends? As we said above, it’s a tradeoff. Consuming the dividends will lower the amount needed per year of drawdown but also create longer drawdown periods. Let’s plot how long the drawdowns last when we plot the real, CPI-adjusted price return only (without reinvested dividends), see below:

The most recent drawdown would have lasted 14.5 years (2000 to 2015). During those 14+ years, the cash cushion would have to support the shortfall between a withdrawal rate of 3.5% and the dividend payments. Those dividends were, on average, only 1.5% of the index level in 2000, so we’d have to compensate for the remaining 2% with the cash cushion: 2% times 14.5=29% cash cushion. 36% cash cushion when using a 4% withdrawal rate. Good luck with that!
The 1970s recessions would have been very unpleasant for the cash cushion as well. A 24-year drawdown coupled with a drop in the real dividend (more on that below). We won’t even mention the multi-decade drawdowns between 1900 and 1960 because this cash cushion myth is pretty much busted!
4: When do we replenish the cash cushion?
Now assume we have just dug out of a multi-year equity drawdown and thanks to the cash cushion we never had to touch our equity stash. Great job! But now the cash cushion is zero! The equity portfolio has to do double-duty now: It has to generate enough returns to cover the 3.5% withdrawals, 2% or so inflation plus all excess returns to refill the cash cushion. How long will that take? It looks like there have been bull markets long enough to achieve that eventually: 1951-1969 and 1985-2000. But we won’t have any illusion that this is feasible after every single drawdown.
5: More funny accounting: Cash has a low expected return!
Let’s use the following example where we keep 5 years worth of withdrawals on the sidelines, 17.5% of the portfolio. But that means a $1,000,000 portfolio will have only $825,000 in productive assets and $175,000 in zero or even sub-zero expected real return (current return in a money market account or short-term CD is less than the 2% expected inflation rate). So, a $35,000 annual withdrawal is 3.5% of the overall portfolio but 4.24% of the equity portion. That’s getting dangerously high. One alternative would be to keep $1,000,000 in equities and save an additional $175k for the cash cushion. But now the effective withdrawal is not really 3.5%. It’s 35,000/1,175,000=2.98%. If the withdrawal rate is so low we might as well invest the entire $1,175,000 in productive assets (80-100% equities) and have a withdrawal rate of just under 3%, which seems pretty darn safe, even for a cranky old pessimist like yours truly, see our previous research on the topic. Specifically, in that post, we showed that a 3% withdrawal rate and a 75-100% equity share had a 100% success probability even for capital preservation, not just capital depletion, over 60 years.
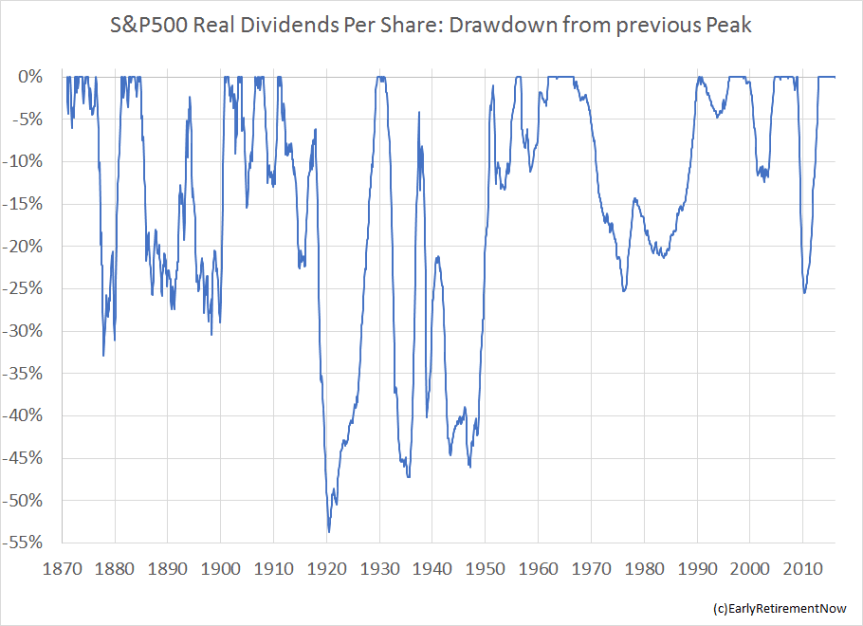
6: Dividends can be cut!
Let’s assume we do withdraw the dividend income. In the past, there have been numerous occasions where dividends have been cut significantly during the recession and/or were eroded by inflation. Professor Shiller has a nice long time series on S&P500 dividends as part of the spreadsheet to construct his CAPE (even though dividends aren’t even used in the CAPE calculation). Don’t let the experience from the 2000s with only short and shallow dividend cuts fool you. There have been some nasty long drawdowns for the real dividend income in the past, see charts below. And those drawdowns in dividend income, you guessed it, coincide with the bear past markets.

What are the alternatives?
Ideally, we’ll just stick with a simple dynamic withdrawal strategy, see Part 11. Also, check out Part 18 for a deep dive into the CAPE-based withdrawal rule. Rules based on the Shiller CAPE seem to check all our boxes: a) we don’t run out of money, b) muted volatility in withdrawals, and c) moderate drawdowns in consumption levels.
One could also keep a very small cash cushion knowing full well that during a big drawdown it will not last through the entire bear market. We did a case study in a blog post a while ago that assumed we have a 3.5% withdrawal rate, consume the dividends to stretch out the cushion even longer and keep 12-36 months of expenses in the cash cushion (3.5-10.5%). In each case study, we ran out of money before the market came back. When we started the exercise in December 1997, a little over two years before the market peak with a $1,000,000 portfolio, the equity portfolio without a cash cushion came back to $956k in 2016. With the cash cushion, the different parameterizations would have beat the equity portfolio by $3k to $17k. Not really that much. If we had started the exercise in December 1996 or before, the cash cushion portfolios would have all lagged behind the no-cash portfolio. Opportunity cost!

Another solution would be to use the dynamic withdrawal scheme, called “Prime Harvesting” proposed by a fellow called Michael McClung (see nice summary here). Instead of cash, you hold safe government bonds (10 years maturity) with a higher yield and some diversification potential. Simply draw down the bond portfolio before touching the equity holdings when there’s a drawdown. Thus, as we pointed out in Part 13, the McClung method is very similar to a rising equity glidepath (see Part 19 and Part 20).
Some folks suggest to “juice up” the expected return of that cash cushion with higher-yielding assets. That might lower the opportunity cost but also increase the risk. I am not making this up but I read suggestions for keeping the “cash” in Preferred Stocks, Junk Bonds and REITs. Of course, all of them had nasty drawdowns in the 2008/9 recession. Not much of a help as drawdown protection!
Conclusion
The Cash Cushion approach is really caught between a rock and a hard place. Either the drawdown is so long that you can’t possibly have enough cash to make it through or the drawdown is short enough that the cash cushion likely wouldn’t have made a big difference. We are not convinced!
Thanks for stopping by today! Please leave your comments and suggestions below! Also, make sure you check out the other parts of the series, see here for a guide to the different parts so far!
Title Picture Source: Pixabay.com
I just started reading the series, very instructive. A bit off topic (maybe), other reasons for some cash: reinvest during market declines, position withdraws in taxable, non-taxable buckets. Thoughts?
Thanks!
Sounds like a great idea in theory. But in practice this is market timing and might backfire. After the 1,500+ market peak in 2007, I thought the bottom is near when the S&P fell below 1,000. If a retiree had moved cash into stocks, you’d have to withdraw your depleted stock portfolio at below 700 points at the bottom.
Love your site ERN. Just coming back for a refresher after viewing a YT from Morningstar about the 3 bucket strategy. I’m frankly not a fan of this approach.
With just a few months to go before my retirement starts I am focussing on the nuts & bolts execution of my withdrawal strategy. I will go with a fairly simple 65:35 equity bond allocation, but I will keep a bit of cash for 3 reasons:
Firstly, I will need a small amount of cash to draw on for day to day expenses. I plan to replenish this every quarter.
Second, a cash asset is a hedge against deflation. Who knows what is around the corner for the world economy?
Third, and most important, I have read a study which shows that simply having cash in the bank makes you happy. Whilst there might be no hard financial benefit, a key purpose of money is to make life more enjoyable, so the financial ‘cost’ of holding cash is money well spent!
Bonds are an even better hedge against deflation. (lower yields + duration effect)
But I can’t argue with the psychological effect of cash. Good point.
Possible typo…
In the section headed, ‘What are the alternatives?’, you say:
“If we had started the exercise in December 1996 or before, the cash cushion portfolios would have all lagged behind the all-cash portfolio.”
Should that not read, “… the cash cushion portfolios would have all lagged behind the no-cash portfolio” ?
Thanks! Hard to belive this stayed undetected for so long! 🙂