
Welcome back to our series on Safe Withdrawal Rates. This is already the 17th installment! See Part 1 here and make sure you also check out the Social Science Research Network Working Paper we posted on the topic, now with 2,000+ downloads!
In any case, if you have followed the series so far you must have noticed that we are no fans of the 4% Rule and much of what we posted here dealt with the “4%” portion of the 4% Rule. For example, in Part 3 of this series we show that when equities are as expensive as today (Shiller CAPE > 20), failure rates of the 4% Rule have been unacceptably high in historical simulations.
But I think I missed this really important point:
The only thing more offensive than the “4%” part is the word “Rule”
That’s because the word “Rule” makes it sound as though the 4% is some sort of a scientific or mathematical constant. But it’s not. It ain’t scripture either, even though it’s often portrayed that way! There is no one-size-fits-all solution for withdrawals in retirement. With today’s lofty equity valuations and measly bond yields, a 3.25% to 3.50% initial withdrawal rate would be much more prudent. But there is another element that creates just as much variation in SWRs: Different assumptions about Social Security and/or pension benefits: The benefit level, the number of years before benefits kick in, how much of a haircut you want to assign to account for the risk of potential future benefit cuts, etc. and they all create so much variation in personal SWRs that the whole notion of a safe withdrawal rate “Rule” is even more absurd. The 4% Rule should be called the 4% Rule of Thumb because 4% is merely a starting point:
SWR = 4% Rule of Thumb
+/- adjustments for equity/bond valuations
+/- adjustments for idiosyncratic factors, e.g. age, Social Security, pensions, etc.
How much of a difference do these idiosyncratic/personal factors make? A huge difference! A prime example is the case study I worked on over at the ChooseFI podcast: a couple in their early 50s expects pretty generous Social Security benefits after a long career and probably wouldn’t have to worry too much about future benefit cuts. If they both wait until age 70 to claim benefits and are able to reduce their withdrawals from their portfolio dollar for dollar once Social Security kicks in, their Safe Withdrawal Rate estimate goes up from a measly 3.5% to somewhere around 4.5% or even 4.75%. Instead of saving 28.6x annual expenses, they’d need only 22.2x or even 21.1x. That’s a difference of several $100k!
How to quickly and easily gauge the impact of future cash flows from Social Security or pensions on the SWR is the topic of today’s post!
How do we translate future benefits into today’s SWRs?
OK, if you’re not a math wonk you might want to skip to the next section. But for the mathematically inclined, those who didn’t unsubscribe from our email list after the Technical Appendix in Part 8, recall that the safe withdrawal rate can be expressed as:

The terms Ct are used to calculate the opportunity costs of taking withdrawals at different times, please refer to technical appendix for more details. So, it turns out that the impact from future cash flows on the SWR enters linearly into the SWR formula. If a future benefit of X translates into an increase in the SWR by Y, then 2 times X will increase the SWR by 2 times Y. That’s very convenient! All we need to calculate is how, say, a $10,000 future benefit (with inflation adjustments) impacts the SWR of a $1,000,000 portfolio and we can easily scale up/down the numbers for $20,000 or $30,000 benefits. Or $23,456 in benefits for a $1,987,654 portfolio.
Also, quite amazingly, the impact on the SWR is independent of the targeted final asset value (FV). Of course, FV enters the formula for the SWR but the two terms for FV and supplemental cash flows are completely separate and additive. How cool is that???

Introducing: Big ERN’s cash flow translation tool
Let’s use the above formula to calculate the potential marginal impact on the SWR of an additional annual cash flow worth 1% of the current portfolio.
- Cash Flows start at between zero and 40 years after the retirement date, in 5-year steps.
- Cash Flows are adjusted for inflation (though, we will also calculate a table for non-COLA cash flows below).
- Retirement horizons are 40, 50, or 60 years.
- Equity Allocations are 60%, 80%, or 100% in an S&P500 index fund, the remainder in 10Y U.S. Treasury bonds, e.g., the iShares IEF ETF.
- Since I want to get a feel for the range of possible outcomes I calculate the minimum, median and maximum SWR impact over the simulation windows from 1871 to 2015. Please refer to Part 1 of this series for more details on the historical simulations.
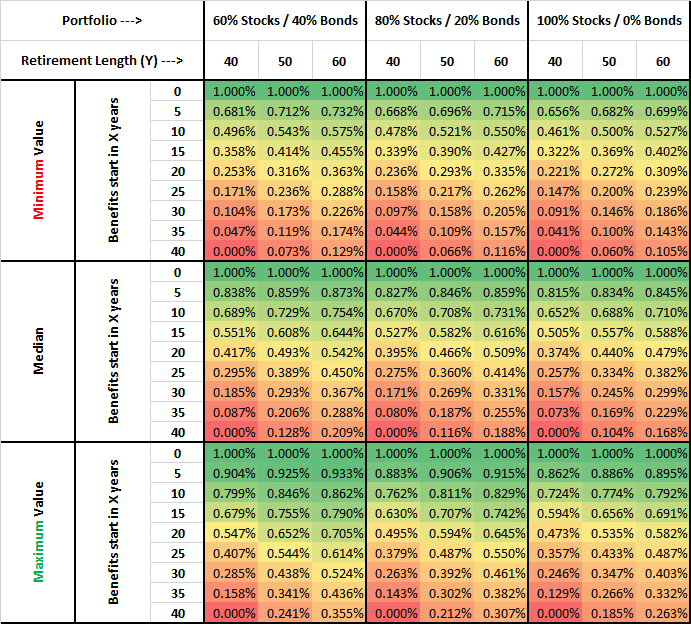
The results are displayed in the table below. A few observations:
- If benefits start in year zero you can raise your consumption level by exactly 1%. Makes sense because the supplemental cash flow is adjusted for CPI just like your withdrawals. Technically speaking you don’t really raise your SWR from the portfolio but you raise your sustainable consumption level one for one with the additional cash flows.
- The longer you delay your benefits the smaller the impact on the SWR. In the extreme case where the retirement horizon is 40 years and benefits start in 40 years (month 481 to be precise), you get zero impact on the SWR!
- There is a small but still noticeable impact from the asset allocation. The higher the equity share the lower the impact on the supplemental cash flows. Makes sense because what we do in the SWR formula above is to discount future cash flows by cumulative portfolio returns. Since returns are higher on average with a higher equity weight we discount future benefit flows with a higher rate.
How exactly do we use this tool? Let’s look at a few case studies:
Case Study 1:
- Retire at age 30. Portfolio $1m, 80% Stocks.
- Expect $15k p.a. Social Security (=1.5% of today’s Net Worth) at age 70, i.e., 40 years from now. This may seem low but keep in mind that people starting to receive benefits in the year 2057 will already be subject to substantial benefit cuts in Social Security.
- Retirement horizon 60 years.
- The impact on the SWR: Minimum: 0.174% (=0.116%x1.5). Median: 0.282% (=0.188%x1.5). Maximum: 0.461% (=0.307%x1.5).
Case Study 2:
- Retire at age 40. Portfolio $1m, 80% Stocks.
- Expect $25k p.a. Social Security (=2.5% of today’s Net Worth) at age 70, i.e., 30 years from now.
- Retirement horizon 50 years.
- The impact on the SWR: Minimum: 0.395% (=0.158%x2.5). Median: 0.673% (=0.269%x2.5). Maximum: 0.980% (=0.382%x2.5).
Case Study 3:
- Retire at age 50. Portfolio $1.4m, 60% Stocks.
- Expect $56k p.a. Social Security (=4.0% of today’s Net Worth) at age 70, i.e., 20 years from now.
- Retirement horizon 40 years. Not too different from the case study I did for ChooseFI, by the way.
- The impact on the SWR: Minimum: 1.012% (=0.253%x4.0). Median: 1.668% (=0.417%x4.0). Maximum: 2.188% (=0.547%x4.0).
Case Study 4 (close to the ERN family situation)
- Retire at age 44 (Big ERN) / age 35 (Mrs. ERN). Portfolio $3m, 80% stocks.
- Expect $24k in benefits at age 70 (in today’s dollars) = 0.80% of the initial portfolio . This already reflects a hefty haircut to the Social Security benefits.
- Retirement horizon 60 years (due to age difference and longevity in both families)
- Benefits start in 26 years, so we do a linear interpolation: 0.2 times the 30-year and 0.8 times the 25-year row: Minimum: 0.200% =0.8x(0.8×0.262%+0.20×0.205%). Median: 0.318%, Maximum 0.426%
Results so far: The range of the potential impact of Social Security is huge. Only around a quarter percentage point for the very young retiree. Combine that with the 3.25% SWR over a 60-year horizon given today’s high CAPE ratio and lo and behold you land at a 3.50% SWR, exactly the rate we prefer. Even for the ERN household with maximum benefits rolling in only 26 years after retirement, Social Security’s impact on the SWR is only around 0.2%-0.3% (being conservative we consider only the range between the lower end and the median of the historical simulations). That’s because the benefit level is still relatively small compared to the $3m portfolio target!
On the other hand, a couple where both spouses are in their early 50s and both expect substantial Social Security (especially compared to the moderate portfolio size) can expect a massive boost to their SWR (minimum of 1%, median over 1.6%!), see Case Study 3! That would put the SWR into the mid-4% range!
What if benefits are not adjusted for inflation?
Glad you asked! We can also do the same exercise with future cash flows that are not adjusted for inflation. This would be the case for many corporate pension plans and most annuities.

What I did in this table is to assume that the initial cash flow is again 1% of the initial portfolio value. But then, every month, we decay benefits by an estimated 2% p.a. inflation rate. Notice that even an immediate benefit of 1% of the portfolio value (e.g. an immediate annuity) translates into significantly less than 1% extra SWR. That’s because the benefit will slowly decay by 2% p.a. in real terms.

A simple example on how to use this table: A retiree has $1,200,000 portfolio today, expects $20,000 in 20 years from a company pension (in future dollars, not adjusted for inflation). The retirement horizon is 60 years, the portfolio allocation is 80/20.
- Step 1: At a 2% annual inflation rate the initial future benefit is $13,459 in today’s dollars, which equals roughly 1.122% of today’s portfolio value.
- Step 2: We look up the three values from the table: 0.247%, 0.376%, 0.456% and multiply with 1.122. So the impact on the SWR is between 0.277% and 0.511%. with the median at 0.422% over the 1871-2015 simulation period.
Conclusion
I’m not the Grinch who is against the 4% Rule all the time. Quite the contrary! If someone had retired around the market bottom in March of 2009, any withdrawal rate under 5% would have been crazy conservative considering how undervalued equities were back then. Moreover, even with today’s elevated CAPE ratio, I have recommended 4%, even close to 5% safe withdrawal rates for some case studies I performed! But that’s due to idiosyncratic factors. For the typical extremely early retiree in their late 20s or early 30s, Social Security benefits will have a negligible impact on the personal withdrawal rates. You are compounding three factors that all diminish the usefulness of Social Security:
- You have relatively few years of prime earnings, thus benefits will be lower.
- Benefits are far away in the future and have to be discounted more severely than for retirees in their 40s or 50s.
- There is more uncertainty about future benefit cuts the younger you are.
What I learned from the calculations here and from some of the case studies I have done (one at ChooseFI, one here on my blog, and another one coming next week) is that determining a safe withdrawal rate is more than pulling an arbitrary number from the web just because the Trinity Study or some FIRE bloggers say so. Instead, determining your SWR is a highly customized exercise! We don’t all wear the same shoe size, we don’t all wear the same clothes and we all have very different drawdown strategies, see the #drawdownstrategy initiative started by Fritz Gilbert and Physician on FIRE for a sample and our own ERN family retirement plan here. Then why should we all use the same withdrawal rate? We can certainly start with a 4% Rule of Thumb, but we have to be cognizant of macro-factors (equity valuations and bond yields) and, equally important, all the different idiosyncratic and personal parameters of the individual retiree. The path to wealth may be simple, but the withdrawal phase is much more complicated than many in the FIRE community want to admit!
And just for the record, even this customized SWR is just the starting point. In practice, of course, we’d have to revisit the withdrawal amounts, for example with a Guyton-Klinger or CAPE-based dynamic withdrawal method to temporarily scale up or down the withdrawals, if the market goes through a bull or bear market, respectively. See Part 9, Part 10 and Part 11 of this series for additional information.
Hello ERN,
Does the tool take into account the risk of depleting the portfolio before the supplemental cash flow kicks in?
To demonstrate the issue, I use the toolbox spreadsheet and intentionally fill the future cash flows with very large values, say 100% p.a. of current portfolio size, that is 8.33% each month.
But I choose a starting date as far as 30 years in the future.
The results are showing a ~17% SWR but I obsiously if I choose such a high SWR I will run out of money during the 30 years until the cash flows kicks in.
In that case, it would mean that you’ll have to go into debt and pay back the debt with the humongous cash flows later in life. If that’s an issue you probably shouldn’t use the tables. They were intended for smaller supplemental cash flows later in retirement, not 100% of today’s value. 🙂
Hi Big Ern, thanks for the post, I’ve been reading through this series with interest although I suspect I’ll have to re-read it a few times for understand it all!
I’ve got a question about corporate pensions. My pension is a defined contribution pension and when I can access it I intend to draw it down like I would my pre- pension age money using a safe withdrawal rate that accounts for inflation. In this case would it be correct to treat my corporate pension like social security with regards to inflation?
Thank you,
Calum
Thanks!
There is no such thing as a “defined contribution pension” It’s either a pension (defined benefit) or it’s a 401k or similar plan (defined contribution).
If you do have a pension, make sure you check if it’s COLA. If it’s COLA then it is similar to Social Security and thus belongs in the same category as Social Security.
If the pension is purely nominal you’d have to account for the fact that it will by slowly erode d away by inflation, and thus your withdrawals have to make up for that later in retirement.
Hi, thanks for your reply. I should have mentioned I’m a UK investor and in the UK we have defined contribution pensions.
Thanks,
Calum
Ah, interesting. Didn’t know that. So, once you decide to draw on the pension, who decides how much you get out of this? Can this run out of money or is someone (your employer, or insurance company) covering the risk of running out of money?
You as the retiree makes all he decisions on drawdown and takes all the risk!
When you decide to drawdown the pension you can either:
1. Drawdown normally like you would any account
2. Purchase an annuity
3. Take 25% of the pot straight away without tax penalties and either drawdown or purchase an annuity with the remaining balance.
A defined contribution pension in the UK can run out of money and if it does that’s your problem. In fact many company pensions here are moving from defined benefit to defined contribution for that reason.
Well, in that case that’s part of your stash and you have to find a SWR that doesn’t run out of money. So, in that sense, your pension is decidedly not to be treated like Social Security.
Does the 4% rule, as traditionally discussed, recommend withdrawing 4% of the current portfolio value at the beginning of every year or 4% of the portfolio value at the day of retirement at the beginning of every year?
I’m trying to digest one part per day of this stuff… tremendous blog mini-series. Thanks for writing it!
The traditional 4% RUle (Trinity Study, Bengen, Kitces, MMM) assumes you set the initial amount to 4% of the initial portfolio, but then keep growing the withdrawals by CPI regardless of the portfolio performance, hence the risk of running out of money.
THe other option is called “constant % Rule” which would readjust the withdrawals to x% (e.g. 4%) every year. Less risk running out of money but more risk for extremely volatile withdrawals! 🙂
How do the safe withdrawal formulas account for different rates of taxation depending on the location and type of retirement assets?
While pension plans, IRAs, Social Security, profit sharing plans are taxed as ordinary income, assets in non-deferred accounts are taxed as capital gains, potentially at a much lower rate.
It seems that determining withdrawal rates should factor in the percent of total retirement assets that are in non-deferred accounts as well as their cost basis.
That’s up to everyone individually. If you withdraw a combined 4 percentage points from your accounts, you’d still do an adjustment to account for taxes and you’ll see what you’re left with. Maybe only 3.8%. So, here’s another reason to be suspicious about the 25x.
I did some case studies a while ago where I took that into account:
http://earlyretirementnow.com/2018/01/17/ten-lessons-from-ten-safe-withdrawal-rate-case-studies/
Have you studies the idea of an “on-condition” decision of when to take social security? I plan to retire at 60 and I can take SS at 62 (1.23% of initial retirement portfolio after adjusting for inflation), 65 (1.75%), or 70 (2.17%) – I can take it at any other time from 62-70 as well, but that’s what I’ve calculated.
So if the market is doing well I can hold off on SS longer, and if it’s down I can take SS earlier. Would adding in this flexibility increase the bump that I could achieve? Or will it always be bound by that 62/1.23% case?
Because you don’t have 2 year delays before fixed payments I only compared the 5 and 10 year cases, which indicates the 5 year case is better (adds 1.17% vs 1.04% – I used the 80/20 mix and a 40 year retirement). Would this imply it’s always better to take SS early in terms of the survivability of your nest egg?
Or if your first few years of retirement are good market years can you enhance survivability even further by delaying SS?
You could use his safe withdraw google sheet and add additional cashflows as needed.
According to cfiresim calculator, the 1.75% at 65 is best of those 3 options:
https://www.cfiresim.com/13601d51-5a4b-411b-8004-6137f0cabcd9
I thought the payouts increased more from 65 to 70 more than 4% per year that you are suggesting.
Thanks for the link. Can’t vouch for the simulations on other sites. It reminds me to do my own analysis! 🙂
I like the customizability of your google sheet but I think some people get overwhelmed but all of the dials that are available to turn. I always get SWR’s within 0.1% of your sheet with the same inputs on cfiresim.
Hey, it’s a marketplace of ideas. If some folks like other tools better, so be it.
One issue that cfiresim will have trouble with is to pin down the SWR during the Grat Depression. Not a good idea to work with annual data.
But if the failsafe occurs during 1965-1968, you should get similar results.
Oops. The 1.75% is @ 67, not 65. At 65 it’s 1.58%.
Still, the result is slightly better at 65 (a 1.05% bump) vs 70 (a 1.04% bump).
I did a second comparison between 62 and 67 and found 67 is better.
The likely reason these are different is because of the larger deficit in benefit from taking SS before 65. With 67 as “retirement age” you lose 5% of the benefit for each of the first two years early, but earlier than that you lose 6.67% per year.
This has me leaning toward 65 as the optimum age, though it’s only slightly better than 70. So it may be that you can use the 65 calculation to start, but then decide what to do when you reach 65 based on what the market is doing.
Yeah, I need to look at that in my own retirement sim sheet. I still believe that 70 is the optimum even for singles. For married couples with spousal survivor benefits there’s even more rationale to go to 70.
It’s on my to-do list! 🙂
Social Security is tricky. For married folks, there is a spousal benefits optimization issue.
For singles, it’s often optimal to delay as long as possible. The running out of money scenario is only relevant if you live really long, in which case the SS benefits have a sizable IRR.
I haven’t done any simulations (yet) trying to condition the early claiming of SS conditional on the market being down early in retirement. It’s on my to-do list.
But: If you believe equities are so undervalued at the bottom and you have a really long life expectancy, there might be an even better alternative than claiming early: go into debt to bridge the time until age 70. Then pay back when SS kicks in. Only works if you have access to cheap credit (e.g., Interactive Brokers, HELOC, etc.)
Again, these are just conjectures. I have to run some careful simulations first!
My problem is that every calculation I’ve seen just uses a straight comparison of the dollars collected. But that’s not right, because every dollar I collect at 62 means one less dollar withdrawn from my nest egg.
If you run of calculation of simply saving your SS with a fixed rate of return, you only need a 6.7% return for taking SS at 62 to beat the other options assuming you live to 100 (only 5.6% if you live to 90).
Of course you won’t get a fixed rate of return that high (unless something really bad happens and interest rates skyrocket like in the 80s), but if you expect market returns to beat that (i.e. if the market is at low valuations) then taking it earlier is likely to win out.
That’s what led me to the idea of an on-condition decision. If my portfolio is way down in the first 2 years, take SS then so that I can reduce my withdrawals while my portfolio value is low because my forward looking return would make the earlier SS withdrawals win out.
I hadn’t considered the debt idea though. I suppose if you can get debt below 6.7% (assuming you plan to live to 100) then that would make delaying SS a better idea.
First, that’s not true. I find https://opensocialsecurity.com/ quite useful.
Serious people compare the lifetime expected discounted benefits, i.e., taking into account a) suvival probabilities and b) the time-value of money, i.e., discount future benefits.
People who don’t understand this this should not be trusted with money advice,
But even that is not factoring in the interaction between SS claiming strategies and Sequence Risk. So, absolutely, more work needs to be done in this space. Hopefully, I can write a post about this topic soon! 🙂
If you use the chart and increase your initial withdrawal rate by the suggested amount, for example 3.5% bumps up to 3.8%. How do you adjust once social security starts?
Example: Start with a $1m portfolio. Withdraw $38,000 initially. Once SocSec kicks in you still consume $38,000 a year, but you reduce your withdrawals 1-for-1 when the benefits kick in.
No double-counting! 😉
Hi Big Ern, thank you so much for this! It’s exactly what I’ve been looking for. I’m wondering if the formula accounts for the impact of inflation on the p.a. value between the date of retirement and the date that p.a. payments start. For example, in case study 1, p.a. amount is 15k, and payments start 40 years after retirement. Does the tool account for the impact of inflation on 15k over those 40 years? I can see inflation is accounted for once payments begin, but I’m unsure about the period between retirement and start of payments.
In my situation, I have a defined benefit pension (I’m in Canada) that will begin paying me an inflation adjusted amount at 55. If I retire at 45, my pension will be $30k p.a. starting at 55. Once payments begin at 55, they will increase annually for inflation. But from 45-55, inflation will eat away at that 30k value. If we have high inflation for those 10 years, my 30k pension will not be as valuable and will have a smaller impact on SWR. I’m wondering if your tool accounts for this risk.
Your situation is covered by the calculations in section “What if benefits are not adjusted for inflation?”
You can also read part 28, which allows you to run your own sims with the exact payments. You’d enter your cash flows in the columns that are nominal dollars (not CPI-adjusted), columns G-K in the Cash Flow Assist Tab.
Thanks for your quick reply! However, my pension IS adjusted for inflation, but only after the payments begin at 55. My understanding is your second tool doesn’t account for inflation adjustments whatsoever, unless I’m missing something.
OK, got it. Sorry, didn’t understand that initially.
In that case you’d need first discount to discount amount by 10 years of inflation into the future, for example 2500 per month divided by 1.025^10 (if you assume 2.5% inflation over the next 10 years). Then use that monthly amount in the real inflation-adjusted columns in the Google Sheet: columns B-F in tab “Cash Flow Assist”
Your case study 3 above is very close to my scenario so I would like to listen to the case study you did on ChooseFI. I searched their episodes and it appears you’ve been on several times. Can you tell me in which episode you did that case study?
Nevermind. I just found this post. https://earlyretirementnow.com/2018/01/17/ten-lessons-from-ten-safe-withdrawal-rate-case-studies/
Glad you found it! 🙂
Suggestion for you.. IMO, these case studies are invaluable. Fantastic way to understand the concepts. Then find one that most resembles your scenario and spin off to customize. An index of them within your SWR intro post would be a great addition.
W[h]e[n] entering your future SS amounts into the spreadsheet, Should you take the 70 year old monthly number right off your current statement? The enter the same amount until the end?
That’s what I would do. The number form the SSA statement is already inflation-adjusted.