
One of my favorite Mr. Money Mustache articles is the “Shockingly Simple Math” post. It details how frugality is able to slash the time it takes to reach Financial Independence (FI). That’s because for every additional dollar we save we reduce the time to FI in two ways: 1) we grow the portfolio faster when we save more and 2) we reduce the savings target in retirement by consuming less.
That got me thinking: Is the math really that simple? How sensitive is the savings horizon to different rates of returns? What happens if we use historical returns instead of one specific expected return assumption? How important is the asset allocation (stock vs. bond weights) on the path to early retirement? How much does the equity valuation regime (e.g. the initial CAPE ratio when starting to save) matter?
So, in typical Big ERN fashion, I take an ostensibly simple problem and make it more complicated!
Let’s get the computer warmed up and start calculating…
Simple Math: 5% real returns
Just to warm up, let’s quickly replicate the results from the MMM blog post. Like MMM, I use a 5% real (inflation-adjusted) annual return but I use monthly contributions, while MMM uses annual contributions. Just like MMM, I use 25 times annual consumption as the FI target. And, of course, I am fully aware that a 4% withdrawal rate might not work for everybody and all the time. As I have written before, we should view the 4% number merely as a rule of thumb, rather than a scientific constant!
Qualitatively, I get pretty much the same results, even slightly shorter savings horizons than MMM (by a fraction of a year) because regular monthly savings get you to FI a little faster! For savings rates around 5-15%, it will take many decades to reach FI but at around 50-65% savings rates, we can cut down the accumulation phase to somewhere between 10 and 16 years. That’s exactly the sweet spot: it’s still a manageable savings rate for many FIRE planners and a surprisingly short time horizon to FI!

Slightly more complicated math: What if we use different returns?
5% real returns isn’t necessarily a bad assumption. Over the very long-haul, equities returned 6.7% even after inflation, see our post on the history of equity returns. But of course, over any given decade, returns can be much higher or lower than that. In the bar chart below I use 2%, 5% and 8% annual real returns. I also use savings rates from 20%-95% (the 5-15% bars would have been so high and messed up the scale). How responsive is the path to FI? Well, it depends on the savings rate:
- Regular retirees with a low savings rate will face a large impact when we change the rate of return. Going from 5% to 2% could add a decade or more to the FI path!
- The higher your savings rate and thus the shorter the horizon to FI, the less susceptible the length of the FI path becomes. For example, at a 60% savings rate going from a 5% return to a 2% average return, the path to FI goes from 12.2 to 14.4 years. For some of the higher savings rates, the reduction of the return rate from 5% to 2% adds only about a year to the FI path!
That all makes perfect sense: early retirees with a very short horizon rely less on compound returns. When reaching FI, most of their nest egg should be the contributions (cost basis), while traditional retirees rely much more on capital gains compounding over many decades!

Just for your record, I also include the whole table with savings rates ranging from 5% to 95% and portfolio returns between 0% and 8%.

Again, it’s astonishing how little of a difference the return assumption makes on the path to FI. Example: with a savings rate of 60%, going from 5% to 6% return reduces the path to FI by only 0.6 years. There are two important lessons from this table:
- Nobody wants to throw away money so, yes, please go ahead and shop around and find funds with the lowest possible expense ratios. But don’t stress out over a 0.01% or 0.02% difference. The impact on the time to reach early retirement would be measured in days!
- It’s tempting to get lazy with the savings rate and hope to compensate for that with better investment results. Don’t delude yourself! Imagine person A plans for a 5% return and a 60% savings rate. The path to FI would take 12.2 years. If person B’s savings rate is 55%, even with an 8% annual return, the path to FI would take 12.3 years. Three full percentage points are not enough to overcome just a 5% difference in the savings rate!
Shockingly Complicated and Random Math: Simulating the path to FI with actual returns
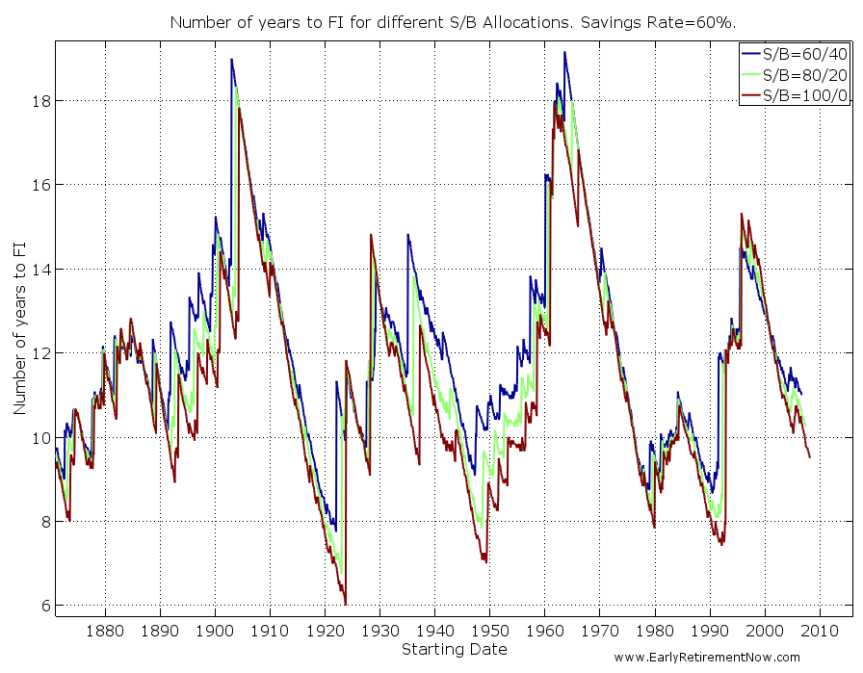
There is no investment that guarantees a fixed 5% annual real return. In the real world, we’ll have to try our luck with volatile equity and bond returns. So, how long would it have taken to reach 25x annual consumption for folks starting their FIRE savings at different points in time? Let’s simulate how each of the different cohorts would have fared with different Stock/Bond allocations (60/40, 80/20, 100/0) and different savings rates (5-95% in 5% steps). In the simulations, I use the same returns as in the Safe Withdrawal Rate Series: S&P500 equity returns and 10-year benchmark Treasury bonds, net of a 0.05% annual expense ratio. Each cohort starts with $0 initial savings. And again, just for the record: the contributions and consumption (and thus the savings target) all adjust with U.S. CPI Inflation!
In the chart below, I plot the number of years to FI for the three different asset allocations and a 60% savings rate. There is quite a bit of variability: Anywhere between 6 and 19 years. Uhm, that’s a lot! It shows the futility of trying to pin down one specific number of years to FI!
Anyone who posts estimates of “Years until FI” should put the disclaimer “Individual Results May Vary. Wildly!“
Also, notice how close together the three lines are. For a given savings rate, the length of the accumulation path is mostly determined by things out of our control, not so much by picking the “right” asset allocation. Also, notice that the 60/40 “low risk” asset allocation has the longest run to FI for some cohorts (19 years!). On average, a 100% equity allocation gets you to the target faster!
In the chart below are the years to FI for a fixed 100% Stock allocation and different savings rates (30%-70% in 10% steps). Notice how the lines stop significantly before 2017. That’s because all cohorts with a 30% savings rate that started saving after 1992 are still not at FI! On the other hand, both the 70% and even the 60% savings rate would have gotten you to FI if you had started out around or even after the Global Financial Crisis!

In any case, the one lever that is in our control is the savings rate. And it has a huge impact on how long it takes to reach FI. So let’s summarize again: The savings rate matters more than the asset allocation! This is again consistent with the result from the table with the deterministic returns: Increasing the savings rate is the only reliable rate to cut the time to FI!
Natura non facit saltus? Maybe it does!
One peculiar feature of the simulation results is that the lines look really jagged. It’s a saw-tooth pattern! What causes the sudden jumps? For example, the number of years to FI jumps from just under 8 years to over 12 years when you go from the October 1992 to the November 1992 cohort. The October 1992 cohort reaches FI in the year 2000 at the market peak while the November 1992 cohort fell short by just a few dollars only to fall back 15x annual consumption in 2002. That cohort reached 25x only in 2004. Of course, one could argue that the November 1992 cohort came so close and likely would have retired in 2000 as well. But in the simulations, you have to draw the line somewhere. If I had picked a 24.9 cutoff then maybe the discrete jump would have occurred with the December 1992 cohort. Pick your poison!

Also a little side note: The November 1992 cohort would have been wise not to retire in 2000 even after coming so close to 25x! As I showed in Part 6 of the SWR series, the year 2000 retirement cohort would not have fared very well with a 4% withdrawal rule, contrary to popular belief.

Complicated Math: Saving for retirement in different equity valuation regimes
When you start saving for retirement, does it matter how expensive equities are at the start? You bet! Just like the sustainable safe withdrawal rate depends on equity valuations (see Part 3 of the SWR series), the time horizon to FI will be impacted as well. In the scatter plot below I plot the earnings yield (=1/CAPE) on the x-axis and the number of years to FI on the y-axis, assuming a 60% savings rate and a 100% equity portfolio. It’s mostly downward sloping. Specifically, at an earnings yield of about 3.3% (today’s CAPE is 30 right now), we would have observed a slightly longer horizon to FI, around 12-15 years, which is a little bit higher than the median of 10.8 years. For folks starting out on their quest to FIRE today, that means they might have to budget a little bit longer. Some people are more fortunate and some are less fortunate with the time and conditions when they start saving. Don’t get discouraged if your path to FI might take a little bit longer than Mr. Money Mustache’s!

Shockingly Complicated Math: Puting it all together
Here are some more summary tables. They are the median number of years to FI for 60/40 and 100/0 portfolios, both for all starting months and those when the Shiller CAPE was elevated. I also throw in the results with the deterministic returns, both my calculations (monthly contributions) and Mr. Money Mustache’s numbers (annual contributions). 100% equities usually get you to the finish line the quickest. The median numbers from the historical simulations are indeed quite similar to the estimates with 5% deterministic returns! Expensive equities have a little bit of an impact on the length but it’s not a huge difference. Sequence of return risk is not quite as damaging for the saver as it is for the retiree!

Let’s look at the 100% equity portfolio and display not just the median but also the range from minimum to maximum time to reach FI. Both for the entire sample as well as for an elevated initial CAPE ratio. Quite intriguingly the maximum time to FI does not occur when the initial CAPE is above 20 (one exception, 17.9 years for when the savings rate is 60%). This is where sequence of return risk works in your favor. The high initial CAPE correlates with a bear market early on, you save when equities are cheap which shortens the worst case scenario FI length. But it is still true that the cohorts that reach FI the fastest faced initial CAPE ratios lower than 20. Makes sense: they tend to be the cohort that start saving for FI right around the bottom of a bear market when the CAPE is low!

Conclusions
- Early retirement is simple; a high enough savings rate could get you FI in a little over 10 years.
- But let’s not oversimplify: The actual number of years it takes to reach FI is highly uncertain. It isn’t quite as simple as looking up a number in a table. Don’t be surprised if you reach FI much earlier or much later than the “estimates” you see on the web.
- A 100% equity allocation is likely going to get you to FI in the shortest time span. But that said, for early retirees, an 80/20 or even 60/40 allocation will get you there almost as quickly. This is the beauty of early retirement and the 50%+ savings rates: A larger portion of your nest egg will be principal and you rely less on capital gains and compounding than the typical retiree with a 40 or 45-year horizon. For early retirees, asset allocation “mistakes” are less damaging!
We hope you enjoyed today’s post! Please leave your comments and suggestions below!
PS: as someone pointed out via email, Go Curry Cracker published a post in 2015 with a similar approach that I must have missed somehow. They also calculate the time to FI with historical real return data, though at an annual frequency only, over a shorter simulation window and without regard for equity valuations. One interesting additional calculation at GCC is how much longer it takes to reach 30x and 50x annual expenses after you’ve reached 25x. Only a few more years! How cool is that?!
Great post! Thank you for all of the charts — personally, it helps me to have the visuals.
And my favorite paragraph was this one: “In any case, the one lever that is in our control is the savings rate. And it has a huge impact on how long it takes to reach FI. So let’s summarize again: The savings rate matters more than the asset allocation! This is again consistent with the result from the table with the deterministic returns: Increasing the savings rate is the only reliable rate to cut the time to FI!”
As a bit of a control freak, I like being reassured that our savings rate is so important AND it’s something within our control, for the most part.
Ha, glad you liked it. Yeah, the main determinants are savings rate (in my control) and market “luck” (not in my control). As a fellow control freak it feels good to have at least one part under control! 🙂
Nice, sobering post ERN. ER is all about the ‘brute force’ impact of savings accumulated and less about compounding. Compounding is a slow friend as I explain here (even more so during low forward expected return periods) : http://tenfactorialrocks.com/the-dog-years-of-investing/
I think the pervasive use of the 4% “rule” can only be stemmed by first recognizing that its not a rule to begin with! Even Wade Pfau in his Reddit interview today acknowledged as much and is talking about 3-3.5% as the SWR in today’s overvalued stock environment. It takes some understanding for a FIRE aspirant to take some risk off the table under high CAPE environments and go all in after some correction at least. These dynamic moves are required to make the 4% rule work under current environments or one must have the ability to cut 20-30% from spending budget during lean times, going down to 3-3.5% effective rate. These complicated realities are part of long retirement horizons. There is no “shocking simplicity” in SWR as your research and mine as well point out.
Thanks a lot TFR! Brute force, indeed!
Yes, that pesky 4% again. I let that one slide because who knows, when you start saving today and reach FI in 12 years, chances are that equity valuations have normalized again and 4% is OK again. But I see your point!!! 🙂
Cheers!
This is excellent, as always!
I know it wasn’t the purpose behind the article, but have you come across or given much thought to the “safe savings rate” approach described by Wade Pfau (https://www.onefpa.org/journal/Pages/Safe%20Withdrawal%20Rates%20A%20New%20Approach%20to%20Retirement%20Planning%20over%20the%20Life%20Cycle.aspx)
Basic idea is to tie accumulation and decumulation together and not concentrate on a “wealth target” per se. For instance, that 2000 retiree may have reached their wealth accumulation figure, but could probably only support a lower withdrawal rate. While the 2002 retiree may not have met the 25x target, but could potentially support a higher initial withdrawal rate. I am oversimplifying but believe I have the basic idea down.
Again, thanks for the great work you’re doing around retirement income!
Very good suggestion. That’s gone straight to my to-do list! Tie the FI target to some CAPE-based SWR instead. That’s a nice topic for a future post!
Cheers!
In the spirit of complexity, I think if you’re going to introduce initial CAPE then it seems that it would make sense to also introduce CAPE at retirement and the corresponding safe withdrawal rate, which would change the multiple that you’re aiming for. If that additional factor was introduced, I wonder if the observation would still hold that those who start saving at an initially low CAPE would reach FI faster, since the median years to retirement for high savers is similar to the average business cycle (~6 yrs).
Similar to another comment above. It’s a good suggestion for a future post. My suspicion is that it would lower the variability of the # of years to FI. It would lengthen the extremely short FI paths because it increases the multiple for some folks in the 1990s. But it would also scale back some of the very long paths because you could retire sooner if there is a market crash towards the end of the accumulation period. Good point! On my to-do list!
Hey Dr. ERN,
I agree, early retirement is simple. But simple is NOT easy, as I wrote today in my post.
We would have been quicker to FIRE with a higher savings rate earlier in our careers when we earned much. much less, no doubt.. Even with the dot-com and GFC setbacks.
However, the savings rate and capital allocation we have adopted at the peak of our earning power over the last 4-5 years has helped greatly. Many others in the FIRE community have trodden a similar path.
Our journeys may be different, the destination of FIRE is the same. It’s not the destination that is important. The journey is invariably a lot of fun. But never simple.
Hi Dr. PIE. Thanks for stopping by! What are the odds that we both write about something simple being not so easy after all? Well, very different topics, of course. Your post today was really awesome! Very touching!
This was a great post! Really liked the balance of visuals and explanation. It definitely illustrates how average return calculations really just give you a ballpark result, rather than a broader, but more informative answer. Do you have standard deviations for the median years to FI with a 100/0 mix for CAPE20? I would be curious to see what the spread is.
This post gets me thinking you could create a calculator that outputs the relevant min/max/avg times based on a given savings rate and approx beginning CAPE (with a variance disclaimer!). Could be fun.
Good idea about the calculator. Even though I’m good at calculating stuff I’m not good at programming the whole thing. Does anyone want to volunteer to write a script for this???
Standard Deviations of Time to FI:
Conditional on CAPE>20:
60/40 100/0
2.18 2.55 SR=20%
1.13 2.10
1.36 1.84 SR=30%
1.65 2.04
2.10 2.12 SR=40%
2.24 2.41
2.36 2.16 SR=50%
2.29 2.19
2.10 2.14 SR=60%
1.90 2.18
1.42 1.69 SR=70%
0.89 1.12
0.66 0.85 SR=80%
0.42 0.62
0.27 0.46 SR=90%
0.09 0.17 SR=95%
ERN, I love your site, the in-depth analysis and the service you are providing to all of your loyal followers. I look forward to each and every Wednesday email to see what is new in the Big ERN world and I have yet to be disappointed! I just want to say: thank you, thank you, thank you.
This blog post leaves me wondering about savings rate percentages. What exactly do you mean when you say someone is saving 5%? 5% of what? Would it be gross income, after tax income or something else? The percentages will obviously vary dramatically so without having a formal definition of what savings rate is in regards to this post I’m left wondering what my own savings rate is and has varied over time. I’m going to assume you are using the Federal Reserve definition which is: savings_rate = disposable_income – expenses where disposable_income = all sources of income – taxes
As always, looking forward to future posts and please keep those case studies rolling because they offer the most real world benefits to those on this journey.
Excellent point! I wrote a post about this savings rate issue. It’s not trivial.
For the purpose of this post, I would probably use SR=Savings/(savings + spending). So use net income but also include your pre-tax savings. This raises the issue of your withdrawals matching your savings only if you expect zero taxes in retirement, which can a good assumption for many retirees (zero tax state and stay within the 0% tax brackets for federal income). But for most other folks you probably want to give a haircut to your pre-tax savings:
SR = (after-tax savings + (1-taxrate)*pre-tax-savings) / (spending+after-tax savings + (1-taxrate)*pre-tax-savings).
Alternatively, one could assume that some work-related expenses will be eliminated and that compensates for taxes in retirement.
“One interesting additional calculation at GCC is how much longer it takes to reach 30x and 50x annual expenses after you’ve reached 25x. Only a few more years!”
I wish more people understood that. There seems to be a wave of young people that are DYING to leave their “crappy jobs” as soon as mathematically possible, and can’t understand why someone wouldn’t jump on the 4% rule as soon as it looks like it might work. Giving yourself the wiggle room of going from 25x to 33x or 40x annual expenses is really not going to take much patience, and you’ll likely not regret it. Wiggle room is highly underrated by people who don’t need it yet.
Of course, if you hate your job I think should abort and find something you like unless you’re so close you can taste the finish line.
Totally understand! I’m worried about some of the folks pulling the plug too early. Some even consider 20x “safe”. I think 28x to 33x would be ideal (3-3.5% SWR) if generally healthy. 40-50x seems a bit too risk-averse, though.
Thanks for stopping by!
I like this post a lot. I’ll have to reread again sometime. In addition, it has a reminder to visit GCC’s website :-).
One question. When you say “Initial CAPE>20”, how many years does such a variable last in your calculations? Or does it all depend on the cycles of historical CAPE as you incorporate historical data in your simulations? Does that CAPE stay constant by any chance and if not, how does it change (downwards or upwards or a blend)? I’m not a math whiz (far from it), but got me curious at the moment.
Great question! I grouped this by how high the CAPE was at the beginning of the accumulation phase. The CAPE moves around quite a bit because the 10Y-rolling earnings (=denominator) move very slowly but the P, the numerator, is the volatile S&P500 price index.
A daily update (or almost daily) and time series chart is here:
http://www.multpl.com/shiller-pe/
Thank you for the most in-depth and informative research I can remember on the topics of all things SWR and early retirement.
Please clarify the asset allocation assumes that the portfolio balance is re-balanced at the end of each month. I ask, because there can be “friction” in the form of transaction fees that lowers returns (particularly in employer 401(k) accounts).
As an alternative, I suggest a buy and hold strategy, where the contributions hold constant at the asset allocation assumption and the portfolio allocation drifts with returns. Or, to add complexity, only new contributions can be used to re-balance the portfolio so there will be less drift but still no transaction costs.
Please excuse me if I am adding too much complexity, but “complicated” is in the title.
Andrew, does your 401k charge you to rebalance funds? I hope that it doesn’t, as I’ve never heard of one doing so. Even moving among load mutual funds is a non-expense if you’re staying within the fund family. The only thing I could see as an obstacle is if your plan admin decided they’d only allow a certain number of changes a year, but even then I assume it’d be often enough to rebalance properly. “Properly”, as I’m sure Big ERN will address, may be less often than you think. Monthly rebalancing will likely not help you – Michael Kitces I believe said that every couple of years was historically proven optimum. Having said that, I’d personally have a hard time NOT doing it at least yearly. And I hate the fact that my spell check keeps flagging the word “rebalancing”!
Agree, there should be no cost.
Less-than-monthly rebalancing helps you during trending markets but hurts you during mean-reverting markets.
I find it intellectually and academically cleaner to rebalance monthly. Less frequent rebalancing opens up a can of worms: more parameters to specify. More ways to unintentionally (or intentionally???) introduce backward-looking bias.
Also, I find it curious that some financial advisers want you to rebalance less frequently but then also propose dollar-cost-averaging. 🙂
The word complicated is in the title, indeed! But for the portfolio, I use the simplest possible (numerically at least) assumption. The portfolio is rebalanced every month exactly to the target weights. In a 401k you should be able to rebalance free of charge. If your taxable account weights drift, simply compensate inside the 401k.
Great article! I think the key takeaway for me is to focus more on your savings rate (in your control) and less on investment returns (out of your control). I think this is illustrated very well when you look at a 100/0 vs a 60/40 allocation and time it takes to reach FI. The gap narrows as the savings rate goes up.
Exactly! Over very long horizons, 60/40 can significantly fall behind the 100/0!
Cheers!
Suppose I had a liquid NW of 600k and a retirement target of $1.2M (and a SR=50%). Suppose I’m currently allocated 90/10 stocks and bonds.
Retirement would be maybe 6 years away… unless a 15-25% correction came along sometime during that period and wiped out 2-4 years of savings. A correction does proportionally more damage, time-wise, as your NW in stocks gets bigger. What used to be a 6 month setback can become a 4 year setback if it occurs close to the finish line.
Now, suppose I have the opportunity to shift some of my portfolio to Navient bonds backed by student loans and earning 7.5%. Or, suppose that by setting up an options collar on SPY, I could buy insurance against anything greater than a 10% loss at a cost of about 3% per year, plus having my gains capped. Or suppose I find some lower-volatility REITs to hang out in.
Any of these choices would probably underperform the market over long periods of time. Yet I wonder if they’d be rational choices for an early retiree in an expensive market with rising interest rates and political turmoil? Would they make sense if a 2 year setback was utterly unacceptable?
I’m not familiar with Navient bonds. In general, bonds offer a bit of cushion right around retirement but in the long-term I’d still phase then out and back into stocks.
A collar is expensive insurance. You give up a lot on the upside because the implied vol so low for Calls right now.
Caution with REITs. They are under pressure when interest rates keep rising!
Great article! Also excellent point about how important savings rate truly is in the scheme of things… I’d be interested in seeing something with a similar analysis but starting mid career. I’d guess most of your readers are along the path rather then just starting.
Ha, good point. WHat’s the time to FI if you’re starting out at more than 0%? I will have to write a follow-up post! Great suggestion! Thanks!
This post is pure gold. When my son told me his debt-service rate was 80% i did some really crude algebra and noticed all but T cancelled out. I got 6.25 years to FI if he continues saving as fast as he’s paying down debt, but I wasn’t considering all sorts of things–most prominent interest earned and compounded. This bothered me, but I realized the math would be gnarly. I am grateful for you having done hard work I was too lazy to attempt.
My main take-away is that the FI aspirant must “mind the gap” between income and expenses then ruthlessly maximize it. Other things like sequence-of-returns favoring the saver are eye-opening, but I guess they just show dollar-cost-averaging in action.
Thanks again.
You bet! Glad this helped!!!
Cheers
Fantastic post, thank you! The one other thing I would love to see is, at a given savings rate (say 60%), what is the min, median, and max years to FI at a few different asset allocations (say 100/0, 80/20, and 60/40 S/B). My intuition is the more conservative asset allocations will have a shorter maximum years to FIRE, though the median (and certainly the minimum) will probably be longer.
Good question. See below the same type of table but for 60/40. I didn’t include the 80/20 because it’s roughly half-way between the 60/40 and 100/0.
It seems like with the more cautious Asset Allocation you increase the min and the median. But for low enough savings rates you even increase the max as well! Over very long horizons the lower expected return gets you in the end, even though you lower the volatility a little bit.
Only for the very aggressive savings rates would you shorten the max. Makes sense!
Man, that “number of years to FI for different savings rate” chart is the craziest takeaway from this for me. This is a solid takeaway to spend less time worrying about getting asset allocation “perfect” and prioritize focus on optimizing SR.
Exactly! Or expense ratio differences of 0.005% (Vanguard vs. Fidelity). All that matters is the savings rate. 🙂
Cheers!
Excellent post! This is really great stuff. Will link to it. Keep up the good work!
Awesome, glad you liked it! Greetings and “skal” back to Denmark!
I love how your brain works (which mine did the same), nice analysis once again on a topic that is (perhaps all too often) oversimplified. As noted earlier the visuals give a great explanation of the variability in reaching FI. Thanks for Dr. ERN, great appreciated.
Thanks, Team CF! Glad you liked it. Math geeks of the world, unite!
Apologies for the badly written comment with many typo’s/missing words, but glad the message came across (i.e. you rock you math geek). It was an early morning, let’s keep it a that.
Amazing post, dude ! You proved with numbers what i knew from experience. I have never been an investment expert but due to consistent, early and substantial savings I was able to get where i am, very close to FIRE. Asset allocation did not matter to me. You should work with the Mad FIentist to update his calculation tools with the variables of the post. Great job !
From one dude to another: Thanks for the compliment! Keep up the hard work and save diligently!
Great post! I am glad you pointed out the reality of the unknown. Unfortunately, so many investors assume that just because the last 10, or 30, or 50 years have seen a long term great equity appreciation, that the next 10-50 years will do the same. Most don’t consider that the overall monetary and economic environment we are in today is wholly uncharted, and to plan an entire financial future on assumptions based on past performance is risky, at best. The next 30 years may continue to see increased valuations and returns in the stock market, but to be overly confident in this would be a mistake, in my opinion.
So great post, very helpful, and I loved all the quant and charts!
Thanks FT! Quant and Charts is we do here! Cheers!
Note how the swings (sd in years) decrease with increasing savings rate. This is an important observation because it makes very high (75%+) very robust in terms of years; whereas with low savings rates (<25%), work years is very very dependent on returns. I showed the same analytically in the ERE book back in 2010 (you might like the final graph in the book which actually used to be featured on MMM's "shockingly simple" post) which summarizes this point. The higher the savings rate, the narrower the calculated range of working years for a given range of return rates until the range becomes 0 at 100%. I wish I had thought of running the actual sequences at the time of writing. I had the numbers, but I think I was blinded by a strong belief that the past is no guarantee of the future. (I wrote that chapter right around the bottom of the recession.)
https://permaculturenews.org/2010/11/08/early-retirement-extreme/ The graph I’m talking about is the first one (about half way down) on this link.
Thanks, Jacob! Good point! Beautiful chart!
Fantastic post! I️ really appreciate the analysis that goes beyond the surface. Also, actual numbers and figures make FIRE a bunch more tangible concept.
Thanks for stopping by, siliconvalleysaver!
Thank you for taking the time to do this analysis and posting it in a fun and engaging way!
Glad you enjoyed it! Thanks for your feedback!
Thanks for a great post on how the savings rate is so so important for reaching FI. Also that being in 100% equities usually wins the race. Have you done a post on whether diversifying the concentration of equities will matter in swr’s.? (Eg. Small cap, value funds, emerging mkts, etc)
Good point! I haven’t simulated that yet. The outperformance small-cap over S&P500 or EM over DM is very episodic. There would have been some decades where non-S&P500 equities would have gotten you to the finish line a little bit faster. And some other decade it would have taken slightly longer. But again, the savings rate is the main determinant.
Looking at the source of the MMM post and being mathematically minded I decided to see how simply the it could be presented in the hope that it would provide some more insight. I ended up as follows
n = ln(1+kr) /ln(1+r)
where n = years to financial independence (FI)
r is the real rate of investment return and
k = (x1-x0)*(1-y)/y
where
x0 and x1 are your current and FI investment values divided by your annual expenditure (respectively)
y is the savings rate
So for example with a 4% SWR, no initial investments and a 50% savings rate
k = (1/0.04-0)*(1-0.5)/0.5 = 25 and if r = 5%
n = ln(1+25*0.05)/ln(1+0.05) = 16.6 years
It’s interesting that n only depends on the increase in expenditure multiple (x1-x0), the savings rate y and the real return r.
For people wanting to reach FI quickly k has to be small.
The Taylor expansion for ln(1+x) is x – x**2/2 + x**3/3 …and this is close to just x for small x.
So n reduces to kr/r = k for small k and r. The dependency on r disappears – as pointed out in this post.
Happy to provide the derivation if anyone is interested.
Nice! I calculated this based on monthly contributions, so the results are slightly different. But qualitatively it’s just as you derived. Thanks for sharing!
Outstanding. This is the post I have been looking for from the FI community since starting out on this path. Thank you.
Nice! Glad this was helpful! Best of luck!
This blog post is really helpful 🙂 Thank´s for sharing!
Thanks! Greetings back to Denmark! 🙂