
It’s been three months since the last post in the Withdrawal Rate Series! Nothing to worry about; this topic is still very much on my mind. Especially now that we’ll be out of a job within a few short weeks. I just confirmed that June 1 will be my last day at the office! Today’s topic is not entirely new: Flexibility! Many consider it the secret weapon against all the things that I’m worried about right now: sequence risk and running out of money in retirement. But you can call me a skeptic and I like to bust some of the myths surrounding the flexibility mantra today. So, here are my “favorite” flexibility myths…
Myth #1: Flexibility is cheap
We just have to be flexible. Great! How flexible, though? Reduce withdrawals by 1%? Or 10%? Or 100%? Obviously not 100%, because that’s the level of “flexibility” inherent in running out of money with the 4% Rule. But how substantial would the flexibility have to be?
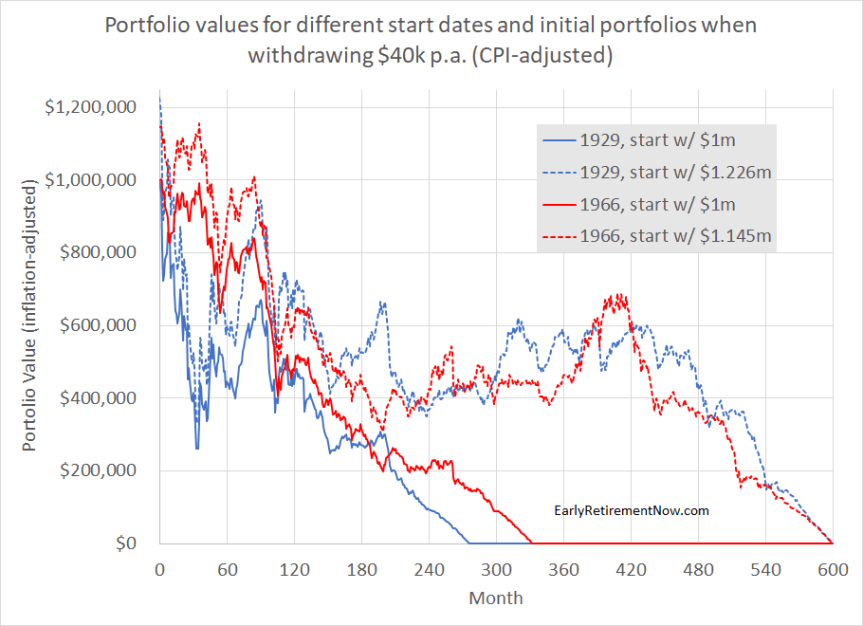
Well, let’s look at the two classic historical retirement cohorts where the 4% rule didn’t work: The Great Depression and the 1970s/80s. Some of the worst failures of the 4% Rule occurred for the September 1929 cohort and the January 1966 cohort. And now let’s do the following thought experiment: How much more money would we need to add to the initial portfolio to make the $40,000 annual withdrawals last the entire 50-year horizon, and not run out of money halfway through retirement? I got good news and bad news: To roughly double the lifespan of the retirement portfolio we need a lot less than double the initial portfolio value. Makes perfect sense because of the time value of money: the withdrawals in the second half of the 50-year retirement horizon require a lot less initial capital. But one would still need $226,019 in additional funds in the case of the 1929 cohort and $145,579 to make ends meet for 50 years. Double that money for the folks who want to withdraw $80k out of a $2m portfolio. That’s a substantial sum, so let’s forget about any kind of cockamamie flexibility rule like “I’ll forego the Starbucks Lattes for a year” or “I will work some Uber/Lyft weekend shifts for a year!” Unless those Lattes and Uber shifts can generate a six-figure sum over a year!

But that said, here’s one flexibility rule that I think will save your retirement: The flexibility to work one or two extra years past that 25x annual consumption target. That would be one form of flexibility that I have always wholeheartedly supported. That’s what I did and it wasn’t so bad! Flexibility is easy pre-retirement. Flexibility post-retirement becomes a little more challenging once you go past the hand-waving and wishful thinking and look at some hard numbers!
In any case, here’s how the time series of portfolio values would have looked like for the two retirement cohorts with and without the additional funds, see the chart below. Notice the difference the cash infusion at the beginning would have made: It would have translated into about $400,000 in year 23 and 28, respectively, and that was enough to make the portfolio last until year 50! Pretty cool! Even though, for me personally, this wouldn’t have been a very stress-free retirement either: having drawn down the portfolio by 60% half-way through early retirement might look a bit scary if you didn’t know about the subsequently strong returns that lifted the portfolio again!
Myth #2: Flexibility has to last only as long as the downturn
How long do I have to be flexible? That’s pretty pertinent information! Though nobody in the flexibility crowd seems to really care very much about this issue. Or could it just be that one has to tighten the belt only for as long as the bear market lasts? Maybe a few years?! Sounds intuitive, right? But there are (at least) two flaws with this logic:
- Inflation! In nominal terms your portfolio recovers. But remember that your withdrawals are adjusted for inflation. Thus, the portfolio has to recover in real inflation-adjusted terms, too. So, it’s true that a sample retirement portfolio with 80% stocks and 20% bonds would have experienced some drawdowns in 2002 and 2008/9 it now would have gained almost 180%. See the blue line in the chart below. But the real return was lower and the drawdowns would have lasted longer when taking into account inflation, see the green line, being mostly underwater between 1999 and early 2012!
- Withdrawals! Your portfolio would have only recovered so fast if you hadn’t withdrawn anything. Unless you’d have found a supplemental income source to fund your entire (!) early retirement budget between 1999 and 2012, the portfolio would have been dragged down by withdrawals. And those withdrawals during drawdowns are especially painful, compliments of Sequence of Return Risk! So, the red line in the chart below simulates a constant 4% withdrawal from this portfolio (0.333% every month, recalculated every month) and the result isn’t that impressive anymore: Even though the portfolio excluding withdrawals might have recovered, the one taking into account the withdrawals is still underwater by the end of 2017!

So, in summary, people who adhere to this flexibility mantra might suggest that one could have weathered the last 18 years pretty easily by tightening the belt during the two recessions (one lasted only 8 months, the second lasted 18 months). But that’s bogus! You would have tightened the belt, measured as the inflation-adjusted withdrawals for the entire 18 years! (Side note: If this finding sounds familiar, it’s a similar logic to the one we pointed out in the SWR Series Part 12 on why a cash cushion doesn’t really work)
Myth #3: I can always be flexible in some other way that you haven’t even considered yet!
Discussing flexibility pitfalls with folks in the FIRE community is a bit like a game of whack-a-mole; after you show that one approach to flexibility would have failed in historical simulations people come up with another method. I can fix that! How about I list a bunch of different flexibility schemes and simulate them all for a few episodes where the 4% Rule would have failed. Here are the simulation assumptions:
- A 50-year horizon.
- $1,000,000 initial portfolio, $40,000 annual spending target.
- All portfolio values and consumption values are displayed in real, CPI-adjusted terms!
- Two start dates: 9/1929 and 1/1966, i.e., months where the 4% Rule would have failed.
- A portfolio comprised of 80% equities (S&P 500) and 20% government (10-year) bonds.
- Assume 0.05% p.a. expense ratios.
Under the fixed and non-flexible 4% rule (withdraw 4% p.a. initially and then adjust by CPI inflation regardless of portfolio performance) we’ve already seen above that we’d run out of money after 23 and 28 years, for the 1929 and 1966 retirement cohorts, respectively. So let’s look at how different withdrawal patterns using “flexibility” would have fared:
- Perfect Foresight: Adjust the withdrawal amount to exactly exhaust the capital after 50 years. This would imply $32,626 p.a. for the 1929 cohort and $34,917 for the 1966 cohort. Of course, this is more of thought experiment because no one would have ever known what was the “correct” initial withdrawal rate at that time. Consider this a baseline against which we measure the other flexible rules!
- Tighten Belt (5Y): Adjust the withdrawal amount for 5 years only and then revert back to the baseline $40,000. Pick the initial withdrawal amount to exactly exhaust the money after 50 years. This is also a flexibility rule that can’t be implemented in real-time because nobody in 1929 and 1966 would have known how much you’ll have to tighten the belt to make the $40k p.a. withdrawals work for months 61 to 600. But it’s a good baseline to compare with!
- Guyton-Klinger: This rule uses guardrails around the 4% withdrawal rate. We keep withdrawing the same amount (adjusted for inflation), but if the effective withdrawal rate (current withdrawal amount divided by current portfolio value) goes above 4.8% (i.e., the portfolio value has dropped enough) then we reduce the withdrawals by 10%. Likewise, if the effective withdrawal rate drops below 3.2% (because the portfolio did really well) then increase the withdrawal amount by 10%. It’s essential to note that the ratcheting up/down can (and will!) occur multiple times, so Guyton-Klinger will potentially reduce the withdrawal by much more than 10%, something that is sometimes lost in the discussion of GK! See Part 9 and Part 10 for more of my thoughts on this sometimes overrated flexibility approach.
- Guardrail to work (30%): See our post from a few months ago (Part 23), i.e., whenever the portfolio falls to 30% under the target level, go back to work and make enough money to finance a 30% drop in withdrawals (or simply cut consumption or a combination of supplemental income plus consumption cut, worth $12,000 p.a.). Discontinue the side hustle when the portfolio recovered again to 80% of the target value. (Side note: Why not 100%? See the discussion on that issue in SWR Part 23!)
- Guardrail to work (50%): Same as above, but wait until we drop to 50% under the target portfolio level and then get a job to cover 50% of the expenses. Set the upper guardrail (stop working) when we reached 60% of the target.
- Inflation Rule: Similar to the Guardrail to Work approach, let’s assume if the portfolio drops by than 20% we start slowly (!) reducing the monthly real withdrawals by 0.1652% (2.00% annualized) to mimic an often suggested flexibility method: Simply don’t do inflation adjustments while the portfolio is underwater! But when the portfolio has recovered again start increasing the withdrawals by twice 4% faster than inflation to ratchet up consumption again!
- Constant 4%: The simplest flexible rule. Simply withdraw an amount equal to 4% annualized (0.333% per month) of the portfolio value of the previous month’s end. This guarantees that you’ll never completely run out of money. But the withdrawals might be seriously depressed for extended periods, see the calculations for Myth #2 above!
- Bogleheads VPW: Similar to the Constant 4% rule but we increase the withdrawal rate to take into account that the retirement horizon is getting shorter and shorter. This will allow higher withdrawal rates but also engineer a complete portfolio depletion as the retiree gets older!
- CAPE-based rule (a=1.5%, b=0.50): Look up the Shiller CAPE value from last month, invert it to generate the cyclically-adjusted earnings yield (CAEY) and use an annualized withdrawal rate of WR-annual = 0.015 + 0.5xCAEY. Divide this by 12, though, because this is a simulation at monthly frequency!
- CAPE-based rule (a=1.5%, b=0.50) with VPW adjustment: Same as the CAPE based rule, above but also walk up the intercept parameter “a” by the same amount as the VPW. That’s because the other CAPE-based rule with a constant “a” parameter was calibrated to preserve capital. So all we’re doing here is to gear this rule deplete capital as the retiree gets older, just like VPW.
Let’s look withdrawals under the different flexibility rules. There are too many of them to display in one single chart so for each cohort, we’ll have two charts. Let’s start with the 1929 cohort, Part 1, see below:
- As we already knew, the inflexible 4% rule runs out of money after only 23 years. So the baseline is $40,000 withdrawals for 276 months and zero dollars after that. Ouch!
- With perfect foresight, we’d need to reduce the withdrawals to $32,626 over the entire 50 years…
- … or tighten the belt for five years to about $12,400 withdrawals (-69%, ouch!!!). But again, these are not exactly viable flexibility rules because nobody would have known about the future returns!
- The inflation rule would have slowly walked down the withdrawals by 2% every year, pretty much starting from the beginning. But over a much longer horizon that might not be palatable for the average early retiree. You would have slowly eroded your purchasing power over 30+ years to a little more than half the initial withdrawal. And then only started to recover between years 35 and 50.
- The guardrail to work program would have been active for a total of 272 months (almost 23 years) if the side gig brings in $12,000 a year. Or 186 months (15.5 years) for the 50% version, i.e., with $20,000 supplemental income and/or consumption cut. Not a very pleasant way of spending my first 25 years of retirement! I did this to get away from work not to be forced to do side hustles for almost half my early retirement!

And for the 1929 cohort, Part 2 with the remaining 5 flexibility rules:
- All rules would have suffered serious declines in withdrawal amounts for about 25 years. The Constant 4%, the Bogleheads VPW and the Guyton-Klinger approach would have tracked each other extremely closely. For most of the first 25 years in retirement, withdrawals would have been around $25,000 on average. 38% less than the $40,000 annual baseline! Then between years 25 and 45 you’d have withdrawn a lot again, only to decline back to $40k and even a bit below during the final 5 years of the simulation.
- The CAPE-based rules experienced much smaller declines but they would have also started with much smaller withdrawals (around $30,000) due to the high initial CAPE ratio in 1929! And they wouldn’t have risen quite as much during years 25-45. Overall not a pretty picture!

Let’s look at the other cohort: January 1966. Again start with the same first subset of the flexible rules, see chart below:
- With the benefit of perfect foresight, a constant withdrawal amount of about $35,000 or a temporary “tighten the belt” rule dropping the withdrawals to only $12,000 would have ensured the survival of this portfolio for the entire 50 years.
- The inflation rule would not have kicked in until about 5 years into the retirement. But then would have eventually dragged down withdrawals to about $24,000 per year (-40%!) after 30 years. Withdrawals would have recovered to their initial $40k only by year 48!
- The guardrail to work program would have been in effect for a total of more than 16 years for the 30% version and more than 12 years for the more aggressive 50% version. Working in my 60s is not what I would have envisioned in my early retirement!

And on to the other 5 rules for the 1966 cohort, see chart below:
- The constant 4%, VPW, and Guyton-Klinger dynamic withdrawal rules held up all right during the first five years. That’s because the real bad returns didn’t start until later in retirement. But the 1973-75 recession and the early 80s definitely took a toll. Just like during the Great Depression, withdrawal amounts will be depressed by around 50% for an extended period. 20 years into retirement there is a bit of a reprieve and the withdrawal amounts return to the $30-40k range. Still below the initial withdrawals but at least off the really nasty trough (in 1982). Only after about 30 years will we see withdrawals that are above initial amounts. Not a pretty picture!
- The CAPE-based rules start at about $36k and are dragged down to about $25-27k. You held up better during the 1970s and 80s but in exchange, the drawdown in withdrawals lasts longer! There is no free lunch!

What about other rules to flexibly withdraw money? Well, I’ve looked at a lot of rules with very unpleasant withdrawal time series. Notice that it’s numerically impossible to come up with a new flexibility rule that would look better than one of “my” rules at every horizon (at least for a given passive asset allocation). Sure, one can find a rule that would look better in year X, but that means that it has to look worse in year Y. You already see some of this “squeezing a balloon” business in the rules I presented: The inflation rule does a better job at not dropping too drastically during the early part of retirement, in contrast to the back to work guardrail scheme or a VPW where you drop the withdrawals substantially during the first half of retirement. But then in the second half of retirement, it’s reversed: you no longer need the side gig and VPW withdrawals recovered, but the inflation rule is still depressing withdrawals! Pick your poison!
But just to be sure, I’ll be up for the challenge: If you can think of a better rule, let me know and I’ll include it here! We’re at close to 3,000+ words already and I got a lot more material. So, there will be a followup post with several more flexibility myths to bust and reader suggestions for other rules!
Thanks for stopping by today! Please leave your comments and suggestions below! Also, make sure you check out the other parts of the series, see here for a guide to the different parts so far!
Picture Credit: Wikimedia
.jpg)
That helps….and makes sense. Essentially, I run 2 VPW calcs with only the time horizon changing and compare the difference. With current age at 50, the 2 VPW calcs could use 50 & 70 year spans in retirement. From previous VPW “what-ifs”, I think you’re pretty close with your example and the difference being in the 0.2-0.4% range. Thanks for the quick reply. Safe travels.
What about a rule that is:
1) CAPE based withdrawals but with a floor
2) Rebalances between cash, bonds and equities depending on CAPE and bond yields
3) Recalculates the SWR each month based on updated life expectancy and current portfolio value and CAPE
All good points!
CAPE-based rules have the same self-similarity and permanent exposure to the equity market and thus sequence risk.
If you tactically rebalalance between Cash/Bonds/Stocks, yeah you can do that. I used to do that in my professional life. It’s not easy. Even professionals can’t get this right all the time.
You should definitely recalculate your SWR occasionally (monthly seems overkill, though) and factor in your changing parameters (stock valuations, your life expectancy).
With the SWR spreadsheet tool does it rebalance between asset classes (how often) or just stick with the initial allocation and allow these to vary with the historic market data. EG start 50% cash, 50% equities, equites up 20% in y1 is Y2 42% cash – 58% equities?
You rebalance every month.
How about upside flexibility Vs downside flexibility?(perhaps just framing?) Perpetual withdrawal rate seems to be around 3%. 4-5% fixed percentage with lower guardrail of 3% indexed dollar seems to work (at least over 40 years) with some combination of global equities, gold, and local bonds and equities, even in Switzerland, Italy and Japan. Limits downside flexibility and maximises upside.
Or more conservative would be the CAPE adjusted, equity glidepath 60 yr number (3.2% say), used as both the VPW and the indexed dollar floor.
I’ve seen there’s a variation on this in the update to Part 25. I did experiment with that version, starting at 3.2%, but (at least backtesting) there seemed to be little downside to starting higher as a market downturn quickly reigns in spending to the floor (20% drop for 4%->3.2%, 36% for 5%->3.2%).
Obviously requires budgeting at 3.2% / 31x expenses so won’t appease those throwing in the towel the day they hit 25x.
You should definitely plan for upside flexibility, which is even more likely than the downside. A CAPE-based rule would again achieve exactly that objective.
That makes sense, although I haven’t seen any/much calibration or testing for global or non-US portfolios (yet).
By rights it should catch on and get dissected by the researchers and blogs.
Even for US investors it would be consoling that a strategy worked with inflation and returns in different developed economies.
Yeah, the non-US portfolios are getting a bit neglected. Maybe some other blogger can pick up the slack here? 🙂
The problem with non-US markets: you don’t have much data. And even if you go far back (Wade Pfau did a study once) you’ll get a real low failsafe due to WW2. Who wants to plan a retirement strategy factoring another traumatic event like WW2 again?