
“The recession is near!” Headlines like that have become more common recently. And I’m not talking about those ridiculous “sponsored posts” on Yahoo-Finance (“Reclusive millionaire’s warning: get out of cash now”) but the actual news; the Yield Curve inverted recently and then you add the “Trade War” and weakness abroad and everybody gets nervous. Even the U.S. Federal Reserve is nervous enough to start lowering rates again; one cut already in July and another 0.25% cut likely coming tomorrow! So, will the longest-running economic expansion end of “old age” soon and cause a sizable market correction? Or a bear market? Or a market crash? Should we even care? Since lots of readers have asked me to weigh in on those issues I thought this might be a good time to write a post on this.
First of all, hell yes, we should care. If the economy really goes South and the stock market with it, that would be detrimental for retirees and even folks well before retirement. Fortunately, despite all those bad headlines, I’m still sleeping well at night. Sure, the outlook has worsened since earlier this year and I am a bit more worried about the market now compared to before. But I’m still not too concerned in absolute terms. And my view is mostly based on economic fundamentals. Notice how that view is different from some places in the FIRE community where “no worries” has become something of a mantra. The standard applause line there is that “the market always recovers, so we don’t have to worry about a bear market!” But that’s really a strawman argument. Nobody ever argued that we’ll have a recession and a permanent bear market that we’ll never recover from! The stock market is tied to macroeconomic fundamentals and as long as the economy grows we can be confident that the market keeps delivering. But eventually getting back to the old peak is a pretty lame criterion. Why? Let’s look at the chart below from my post earlier this year, but updated to 9/13/2019. It plots the real (inflation-adjusted) total-return performance (dividends reinvested) of the S&P 500 since 2000.

Of course, the market recovers eventually. But it may take a while! The index didn’t reach the 2000 peak until 2013. And a zero-percent real return over 13 years is a pretty lousy goal. Or here is another way to look at the chart: Let’s start at the peak in 2000 and assume the 2001 and 2007-2009 recessions had never happened and the index had instead advanced at 6% per year (even a little bit less than the long-term average). We’d be 50+% richer today. Don’t tell me recessions and bear markets don’t matter! Also, we did catch up to the 2007 peak plus 6% growth, but even that took about 10 years. So, yes absolutely, recessions and bear markets matter because of what they can do to our retirement plans, compliments of Sequence of Return Risk.
I’m just pointing this out to stress that I’m not categorically unconcerned about a recession. I just don’t see enough evidence yet to run for the hills. Let’s take a look at the details…
Where are we now? Update on my three favorite macro indicators
In early 2018, I published two posts to showcase how I think about the connection between the macroeconomy and my personal finances:
- Joined at the hip: The Macroeconomy and the Stock Market: We obviously go through equity market fluctuations, even corrections and bear markets all the time. But from a Sequence Risk perspective, the only market events we really have to worry about as a retiree (or someone close to retirement) are the bear markets that coincide with recessions.
- Market Timing and Risk Management – Macroeconomics: Here I detail what would be good indicators to at least get an initial idea on whether we’re even close to a recession. I presented my three (yes, only three!!!) favorite macro indicators that I follow to get a sense about the health of the economy. Quickly, because I’m retired and don’t have time to follow hundreds of indicators!
So, how are those three indicators holding up as of September 2019? Let’s go through them one by one and assign a letter grade (A-F):
1: The Yield Curve (Grade: C-!)
A yield curve inversion, defined as a negative slope between the 2-year and 10-year Treasury yields, has preceded each and every recession in recent history, see the chart below.

In this monthly chart, you don’t even notice the very brief inversion in late August. In the chart below, I plot the 10Y and 2Y yield and with a magnifying glass, you can see that the very short inversion. But in September, the yield curve “normalized” again and the 10-year yield is now back above the 2-year yield.

What do we make of that? Does that qualify as a bona fide yield curve inversion? Should we be worried about this inversion? I’m obviously marginally more worried than when the yield spread was at +0.20% but this short-dated inversion doesn’t seem like a reason to run for the hills yet. To put this short-lived yield curve inversion into perspective, let’s compare our current inversion with two prior yield curve inversions in 1998 and 2000. The current curve inversion (very short, very shallow) looks much more like the false alarm in 1998, not the significant and long-lasting inversion in 2000, right before the 2001 recession:

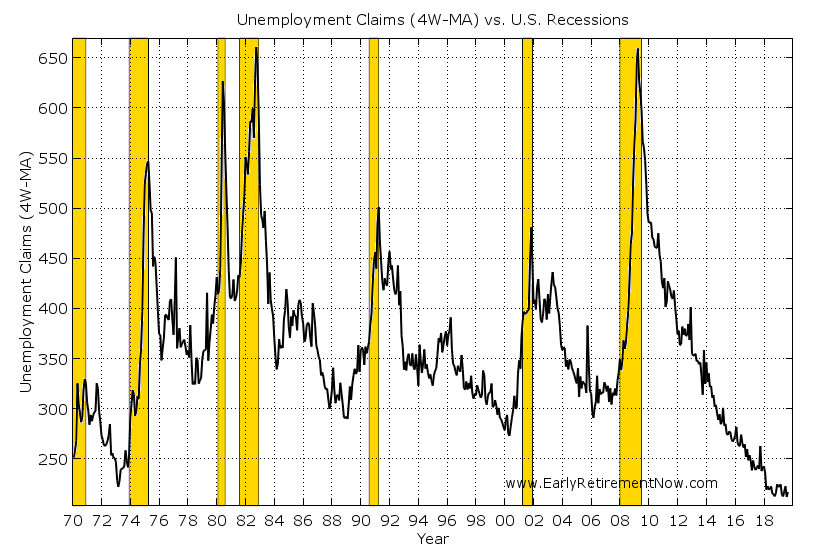
2: Unemployment Claims (Grade: A-!)
The weekly unemployment claims still look really, really solid. They have been stuck close to a multi-decade low and even all-time low when calculated as the ratio of unemployment claims the overall size of the labor market. So, by this measure, it still appears that we’re long ways away from a recession. To even start getting worried about a recession I’d need to see a rise by 50k or even 100k in the unemployment claims.
3: The Manufacturing Purchasing Managers Index (Grade D+!)
The PMI has weakened quite noticeably since I wrote my last update. We used to be in the high-50s, even above 60 when I first wrote about this topic. Now we just dipped below 50, which is indeed in “contraction” territory, meaning that the share of Purchasing Managers surveyed with a negative outlook exceeds that with a positive outlook.

How far below 50 should we drop to get really nervous? In the past, recessions mostly correlated with a drop below 45. A mere fall below to slightly below 50 is mostly consistent with a false alarm. But again, don’t get me wrong: every fall below 45 also started with a drop below 50. This is the indicator I’m the most nervous about right now!

What if you follow hundreds of macro indicators?
One legitimate criticism is that with just three indicators we don’t get a really comprehensive picture. True! But I don’t have the time to collect, process, monitor, and interpret all the different macro indicators that come out regularly. What can you do if you want to understand the impact of all those different indicators (literally hundreds!) on the health of the macroeconomy? Two great resources for that are easily accessible on the web:
- The Federal Reserve Bank of New York: Nowcasting Model. The current, third-quarter GDP forecast is 1.6%. The one-quarter-ahead projection is even weaker, at 1.1% (though with very large error bands!).
- The Federal Reserve Bank of Atlanta (my former employer!): GDP NOW model. The current estimate of the 2019 third-quarter GDP growth is at 1.8% (as of Sep 11, next update Sep 18).
What I like about the “nowcasting” approach is that you are less likely to fall into the “confirmation bias” trap, where you cherrypick certain indicators that confirm your preset notion of what you want to find while ignoring all the other information. You simply look at all indicators and build a model for determining how each one of them marginally impacts your forecast target.

So, these underwhelming growth numbers are largely consistent with my “poor man’s” version three-indicator model. The growth rates under 2% (I’d call that a letter grade C) could certainly look like the late expansion growth rates right before the economy keels over and goes into recession. They also look like the many other temporary weak spots, e.g. 1995 or the numerous false alarms post-2009, where everybody ran around with their hair on fire (fire, not FIRE). But they never turned into anything even close to a recession.
What does that all mean?
So, again, the grades for my three indicators:
- Yield Curve: C-
- Unemployment Claims: A-
- PMI: D+
That would make the average grade still a C or even C+. Not pretty but still a passing grade. It looks like an economy that’s muddling through a soft patch. But this “mixed bag” of indicators also means that the degree of uncertainty has gone up. So, the probability of a recession has certainly gone up! You take a bell curve and shift it to the left and increase the standard deviation (dispersion) and the probability for left-tail events will go up. It’s simple math! But while the probability of a recession certainly increased, it’s nowhere near 100%! But it’s on my radar screen now!

Conclusion
Of course, I’ve planned conservatively enough that even with a recession and a bear market, my early retirement withdrawal rate should be safe. Should! But it doesn’t mean that I would derive a lot of pleasure trying out how my plan works out in the worst-case scenario. It’s a bit like a SWAT Team; despite wearing all sorts of fancy gear, bullet-proof vest, etc., they still wouldn’t like being shot at! So, despite all the safety margins, the prospect of a recession would indeed make me a bit nervous and, therefore, it’s natural for me to follow what’s going on in the economy and the markets. And following the economy, I want to be neither this guy – panicked all the time:

… nor this guy – never worried because he’s resistant to any data coming in:

The best approach is to look at the data with an open mind and some level of consistency. So, I’ll keep writing about this stuff here, especially if my view changes! Stay tuned!
Hope you enjoyed today’s post. Looking forward to your comments and suggestions below
Title Picture Source: Pixabay.com
Ern please discuss Michael Burry’s comments about index funds when you get the chance. I want hear your opinion on the topic. Thanks.
Mr. Money Moustache wrote about recent Burry’s comments recently…
That was on my mind, too. But the post got too long. Not sure If I want to write a whole post on this. I think Burry is exaggerating here. You can’t compare this to the CDO bubble! Burry’s fund is underperforming and he needs a scapegoat to put the blame on. 🙂
Do you think MB is focused on broad-based equity ETFs? I most certainly believe not. There are massive holdings in niche and levered equity ETFs (all “passive”) and then there is the large issue of credit (bond) funds, again passive. I also think the scapegoat comment is off-sides. It’s worth mention that prior to the the “big short” MB had a very admirable record as a ken and objective forward-looking investor. Certainly better at it than me, you for anyone here. A little reverence on “our” for true outperformance might be in order. But that is just my own opinion.
I would take MB’s comments with a grain of salt. But I agree that ETFs with very illiquid underlying assets (e.g. high-yield bonds) could get into some hot water in the future. Not too concerned about equity ETFs.
Excellent article. Much appreciated.
Question…for those of us in ‘Save’ mode, how should your final figure (left shift/bell curve) impact asset allocation over time?
My approach has simply been to say,
“Deciphering macroeconomic signals is too complicated for the individual investor (me).
I’m better off:
a) dollar-cost-averaging an asset allocation that changes as a function of my age and horizon to retirement,
b) sticking to it that allocation through thick and thin regardless of macroeconomic conditions, and
c) focus on those things I can control e.g. personal income and savings ratio.”
However, if one could quantify the leftward shift there’s an argument to be made that my allocation should alter accordingly. Not necessarily sell everything, buy gold and “run for the hills”. Rather, exchange some equity % for cash until the indicators improve (within a retirement account so-as to avoid a taxable event).
I suppose this is a form of active management which generally doesn’t work. None-the-less, this current market has me thinking about it.
Cheers and thanks in advance for any thoughts/comments.
The earlier in the save mode you are the less you should worry. Use the DCA in your favor if you’re jsut starting out.
Also, right now, I’m only looking at “necessary conditions” to do anything. Doesn’t mean that I will do anything if they are pointing South. Maybe at that time the market has already lost 30% and it’s too late to get out.
But you’re right, if the market is still close to the all-time-high and my indicators get much worse, it might not be a bad idea take some chips off the table.
Thanks!
You are honestly my favourite FIRE blog out there. As an Econ and Math degree I truly appreciate all your charts, numbers, and details!
Thanks! Math/econ is a great combination! Glad you find this helpful! 🙂
My inner psyche has always been closer to BEAKER but thanks to your writings I get a little closer to the oblivious dog.
Thank you.
Thanks! I feel very much the same way: it’s too easy to panic if I read the news these days. Beat that beaker in you! 🙂
The recession will not be publicized, at least not in a way from which we can consistently profit. There will be a decade of gloom and doom stories, scary news, and railings about some metric deviating from its average – and then one day our worst fears come true. If all one does is read “finance news” one will be sitting in a savings account for life, which is many times more expensive than taking the hits.
The only consistent signal we get is the buy signal received when markets collapse. This single reliable signal leaves us with exactly one dominant strategy:
1) On a normal basis, invest in an asset allocation slightly more conservative/hedged than you are comfortable with and rebalance as usual.
2) When the buy signal is received (e.g. stocks fall 25% from their peak) shift to an aggressive asset allocation. Shift back to strategy 1 when stocks have recovered to some point beyond their previous highs.
Nice! That would have worked really well in December 2018. Well, it was only a 20% fall. But I hope you went on a bargain hunt at that time!
Nice post. I’ve been following unemployment index, too, only I’m using a year on year rolling 3month average of the change in unemployment. Currently standing at about -0.4%. When it hits +0.5% it’s saying a recession is imminent.
Regardless of what you use for your crystal ball, the big question I have is what are you supposed to do about it when your inidicators start flashing red?? For you, let’s say that would be when your average drops to a D- or below, For me, that would be when my rolling average starts creeping up above 0, then above 0.4%, and then at 0.5% it’s time to…what?
Everyone says don’t time the market. I sort of agree with that. OTOH, if I agree with that, then why am I even bothering to do any crystal ball gazing?
The hard part isn’t knowing when to get out and go to cash, btw. It’s figuring out when to get back in! Thoughts?
How do you know when to get out? Of course it doesn’t really matter unless you also know when to get back in AKA buy low, sell high. If anyone has figured it out they’re not going to tell anyone because the method would no longer work
The “what to do” question is pretty simple during your accumulation years: dollar costs average.
During retirement the answer is much less clear. Personally, I don’t use an allocation based on percent. Instead I keep a fixed dollar amount in high yield savings equivalent to 5 years of predicted spending needs and the remaining is indexed. If there’s a recession or big market drop, I’d start reducing my spending if recovery seems to be taking more than a year.
I early retired almost 3 years ago and haven’t yet had to test the plan IRL. Having low debt gives me confidence my plan will work, but it’s will take serious discipline.
I recommend making your own plan BEFORE you need it, and stick to it. There’s no right plan, but having a plan can give you a starting point
Necessary condition: further deterioration
Sufficient condition: the above + market hasn’t dropped by much yet.
Exactly, YYZ. I retired in early 2018 and have set myself up almost the exact same way as you describe. Main difference is that we have a two-year cash stash, which we could stretch to make last a bit longer if needed. Overall strategy is the same, though. I’m using a robo to maintain our target asset allocation and also do tax loss harvesting and automatic reinvestment, resulting in what is effectively DCA.
Still, I don’t like the idea of a big drop. Part of me wants to go run and hide, and wait for the big fall – but I know that’s not what you’re supposed to do. Stick with the plan! Man, it takes a lot of discipline.
I recommend a simple switching strategy where one is invested in 30% T-Bonds and 70% stocks (index fund). If at the end of any year the S&P 500 has lost -20% or more then change the allocation to 100% stocks (index fund) and hold that allocation for 2 years then switch back to 30% bonds and 70% stocks (index fund). One could also lower the bar and switch if the S&P 500 lost -13% or more in a year with that loss occurring over a 5-6 month period during a year.
The switch is based on the average bear market length (13.2 months) and recovery period (22 months). The lower bar used for the switch is based on the average market correction being -13% and lasting 4 months with 4 months to recover. The switch won’t eliminate the hit one initially takes. But having a good allocation of T-bonds gives one some dry powder of sorts to put to work on the recovery, which is typically very strong following a bear market. Clearly this won’t time things perfectly but it can provide significantly higher returns vs. being 100% in a balanced portfolio or 100% in stocks/S&P 500.
Returns from 1998 to 2018 using the -20% switching strategy ($1 million invested at the start)
Switch Returns CAGR 8.07%
$5,101,580
30% T-Bonds (LT) + 70% S&P 500 Returns CAGR 7.13%
$4,245,749
100% S&P 500 Returns CAGR 6.51%
$3,759,578
Interesting thought. That switch would have been a bit early during the really big recessions. I also wonder if this still works during the withdrawal phase when you’re exposed to Sequence Risk. You can’t compare the simple buy-and-hold point-to-point returns then! 🙂
Unemployment is a lagging indicator. Companies put on hiring freezes and start layoffs only after their sales have dropped. They don’t know a recession is occurring any more than we do; the pieces are only put together a couple of months after the fact when those layoffs appear on the unemployment numbers. Because stocks tend to drop months BEFORE a recession, this info is of little use.
If you want to use the unemployment rate as a leading indicator, consider that the US economy has never been able to sustain unemployment numbers this low for more than a year or two. Eventually, the lack of available employees makes it physically impossible for businesses to grow, and the lack of growth is a recession. My own company is having a very hard time finding people with high school diplomas who will even show up for $30k a year plus a 90% health insurance subsidy.
The last time unemployment was below 4% was 2000. Prior to that was 1967-69. Historically, there’s NEVER been a time the unemployment rate breached 4% and a recession did not follow within roughly 1-3 years. We’re at about 1.75 years below 4% now.
I wasn’t talking about the unemployment rate (monthly data, mostly lagging, significant revisions) but the more timely weekly unemployment claims. They ARE regarded as a timely indicator.
But if you have a better indicator (it takes a model to beat a model!!!) please let me know! 🙂
Good point. I should have mentioned this in the post:
A necessary condition for me to do something: further deterioration in the indicators.
But this is not sufficient. If the market already tanks by 20-30% or more then it’s too late. Might as well sit it out! 🙂
If only there was a method to get a guaranteed steady 6% return!
Yeah, no more return like that. So, these 6% return “trend lines” are only for illustration! 🙂
Coincidentally about a week before your post, I also drew a similar graph (also using google sheets) comparing my own IRA vs 5% for comparison. For a brief moment I thought you had a copy of my chart because they looked so similar
Do you know of any data source to use an actual interest rate vs date? I’m not sure which interest rate, but something that could stand in for high yield savings rate. Just seeing the shape of the curve would be interesting (no pun intended)
Haha, I stole the idea from you! 🙂
You could use “risk-free” interest rate, such as the 3m T-bill rate, and just compound that forward over time.
But that would be much, much lower than 5% or 6%, especially after inflation.
Or use the U.S. Prime rate:
https://fred.stlouisfed.org/series/MPRIME
It’s not something you would get but it’s a good comparison rate because HELOCs are normally tied to it.
Thanks ERN. I’ve included the 3 Month treasury in my spreadsheet and indeed it’s dismal. I thought the results would be better than they are because interest rates had been higher for awhile in the past. It’s interesting to see the actual results.
I’m putting together a “case study” using my own historical IRA data for a local FIRE meetup and I’d be happy to show you (privately) what it looks like.
If you’re interested feel free to contact me. Are you able to get my email address from the WordPress comment system?
Thank you as always for your thoughtful analysis and enjoyed meeting you at FinCon.
I’m still sticking to your 60/40 equity glide path, about the only thing I’ve been changing is moving more into treasuries for the bond allocation. I don’t think I’m getting enough risk premium in corporates today and it’d be nice to have a non correlated asset if we do see a market decline.
Thanks Robert! Yeah, a higher-yielding asset that’s uncorrelated would be nice. Two alts I’m using: multi-family real estate (through private equity funds) and options trading.
They are both still correalted with equities, but less than 100% and still offer good yields.
Hi ERN, Nice post and very timely. For Robert and others of us that are in various stages of using a 60% equity going to 100% Equity glide path (per your SWR Part 20 post), for the bond part of the portfolio (e.g. 40% bonds when equity is at 60%), what do you suggest using for this Bond part to get a useful Alternate investment to Stocks (i.e. negatively correlated and with a strong increase when equities drop in price as in a recession as you are discussing in your post above)?
Some good options may be:
1. IEF (iShares 7-10 Year Treasury Bond ETF, 7.5-year duration)
2. VUSUX (Vanguard Long-term Treasury Fund Admiral Shares, 17-year duration) (Longer history available for VUSTX which are the Investor Shares of this Fund since 1986)
3. EDV (Vanguard Extended duration Treasury Index ETF, 24-year duration)
EDV has the advantage of having the longest duration (and thus the best upside when equities drop), giving you approximately 3 x the “bang for the buck” of a similar sized IEF investment. But then a mistake in the value you purchase EDV for (i.e. paying too great a price) could be costly since if interest rate rises for long-term US Treasury bonds vs. the rate at purchase and stays high, then the long duration will make for significant underperformance for the period while the interest rates for long-term US Treasury bonds stays high (i.e. greater than the interest rate when you purchased the EDV).
So, if we are not interested in real estate investing nor in the options trading strategies as alternate strategies, what bond fund/ETF do you suggest and your rationale?
Obviously, if you believe that the bear market is a demand shock, the Fed lowers rates, etc. then the longer duration in the long-term bonds gives you more bang for the buck. (I don’t have a long enough return series for the 20+ year bonds, though, to run extensive simulations.)
Right now, I think VGLT, TLT, VUSUX, EDV etc. would do the trick.
Thanks, Kirsten, for your thoughts. I agree. Two more questions:
1. How likely do you think a supply shock bear market (recession) is? (The last one that I know of was the oil shock in early 1970’s).
2. And what are good ways to hedge for a supply shock bear market/recession?
[One idea: In this same 1970’s period, and during the 3 recessions thru about 1982, gold did perform well as a hedge. See useful graph in https://seekingalpha.com/article/4101251-gold-shine-next-recession. (Note that author is not in favor of gold.) So the ETFs GLD and IAU may be a good option IF there is another supply side recession.]
Your thoughts?
That’s the $1m question!
I think it’s less likely than a demand shock recession. But it’s possible and it would be damaging to the average investor holding a lot of bonds right now.
To hedge against the supply shock possibility, I’d go with short-term fixed income (money market). That worked much better in the 1970s.
Gold would work, but that has rallied already, so clearly been priced in. Not sure if it’s still attreactive to enter the GLD, IAU, etc.
Thanks, Kirsten. My follow-up ideas are:
1. I agree with what you state, and it is useful for planning purposes for me. See below.
2. I am in a similar situation to Gasem (MD on FI/RE) in age and in concerns about preserving capital in case of equity bear market despite spending dividends and interest, and needing to withdraw some capital to cover yearly expenses (YE). So, I want to hedge my account against both a demand-shock recession and a supply-shock recession while still leaving room for growth in the equity part.
3. So with 30 yearly expenses (YE) worth of investments (after subtracting SS Pension and other pension from total yearly expenses) (a 3.3% withdrawal rate) , and with a 60% equity/40% bond portfolio (I am at the beginning stages of using a 60% equity going to 100% Equity glide path (per your SWR Part 20 post), this yields 18 YE’s worth of equity, and 12 YE’s worth of bonds.
4. Let’s assume there is a recession (either a demand-shock recession (DSR) or a supply-shock recession (SSR).) If I have half of my bonds in LT treasuries (preferably in STRIPS (e.g. EDV (Vanguard Extended duration Treasury Index ETF, 24-year duration)), and the other half in Money Market, then I have 6 YE’s of EDV and 6 YE’s of Money Mkt.
5. In case of a DSR, I will spend EDV while Equities are below previous peak. EDVs will increase in value in a DSR scenario. For example, 2% reduction in 30 yr. Treasury Rate (e.g. 3.5% to 1.5%) will increase the value of EDV by 48% due to the 24-year duration. So, I will have ~ 9 YE’s to spend. My spending (after accounting for SS pension and other pension) is partly supported by dividends and interest, let’s say 2% of investments so I have 30 YE’s * 2% = 0.6 YE’s covered. I need to finance 0.4 YE’s from sale of my investments which will be EDV in a DSR scenario. To see how long the YE’s will last, I divide 9 YE’s by 0.4 YE’s per year (needed) and get 22.5 years’ worth of expense coverage. (I realize I have not taken into account inflation so approximately let’s say I have 15 years’ worth of expense coverage.) I also realize I am spending dividends and so the downturn in equities can last longer than if I reinvested dividends.) In any case 15 years’ worth of expense coverage is a good amount of “insurance” against needing to sell equities in a DSR scenario.
6. In case of a supply-shock recession (SSR), I will spend Money Market as you suggested Kirsten while Equities are below previous peak. Money Market will maintain its nominal value in an SSR scenario. So, I will have ~ 6 YE’s to spend. Again, my spending (after accounting for SS pension and other pension) is partly supported by dividends and interest, let’s say 2% of investments so I have 30 YE’s * 2% = 0.6 YE’s covered. I need to finance 0.4 YE’s from sale of my Money Market in an SSR scenario. To see how long the YE’s will last, I divide 6 YE’s by 0.4 YE’s per year (needed) and get 15 years’ worth of expense coverage. (I realize I have not taken into account inflation so let’s say I have 10 years’ worth of expense coverage.) I also realize I am spending dividends and so the downturn in equities can last longer than if I reinvested dividends.) In any case 10 years’ worth of expense coverage is a reasonable amount of “insurance” against needing to sell equities in a DSR scenario avoiding the worst years of selling equities low, but probably not all the recession since without reinvesting dividends, equities could be below there peak for about 20 years.
7. If I assign probabilities of 60% to a slow growth equity scenario with no recession, 30% to a DSR scenario, and 10% to SSR scenario, I can roughly foresee my probability of having to sell my equity stake during a DSR or SSR downturn (a measure of down-side risk) . And can also estimate my total worth after 25 years (i.e. at passing away) which will then be used for legacy since I will be using a using a 60% equity going to 100% Equity glide path per your SWR Part 20 post.
8. I have based my plans for Asset Allocation on your SWR Part 20 post and on the Joe Davis, PhD (Econ) and teams forecasting that they update yearly in December on Vanguard Website. 2019 forecast (published on 6 December 2018) has this link https://investornews.vanguard/vanguard-economic-and-market-outlook-for-2019-down-but-not-out/
9. So, looking forward to more good information from you Kirsten and from Joe Davis and team at Vanguard.
Wow, very nice plan. You’re essentially suggesting a glidepath which indeed works out well during a downturn. But as you realize, the SSR is more threatening because you only got 6 years worth of stable assets. And the recession that started in 1973 had drawdowns that lasted 10+ years.
But it’s certainly better than a naive 4% Rule with constant 60/40. And that small difference will make all the difference! 🙂
I think the unemployment number is wrong in your analysis. Do you still work? No. Are you counted as unemployed? No. Neither am I, and neither are millions of boomers and that number grows daily. The clue for me about unemployment is there is no inflation in the face of “full employment”. If you’re leaking uncounted workers out of the denominator unemployment looks unduly rosy when in fact it may be much more pedestrian or starting to fail. If it was actually rosy instead of synthetically rosy, you would expect wage inflation and price inflation. Not much inflation to be seen, maybe a little.
Retired people spend less, a lot less. Retired people go to the early bird special. They don’t buy cars every 3 years and houses every 5, and if the do it’s because they are downsizing. For example I expect you’re planning on staying in your new place for a long time, and I don’t expect a pair of new Mercedes S class cars in the new garage. When I retired I downgraded to an Accord. They are cheap to own, cheap to fix, and last forever. I bought mine as an end of model year purchase just as the new model was arriving for cash. Nobody made much money on that deal. All of this is a hit on GDP. So “low” unemployment may actually be far more subtle in terms of numerical squishiness. Things may be more squishy than solid. I read a Journal article recently that there have been more business failures in the first half of 2119 than all of 2018 implying an acceleration in unemployment. Unemployment is a lagging indicator, as is inflation so we could be worse than those numbers imply.
Another problem is the amount of leverage in the system. I read 19% of the S&P price is from financial engineering aka stock buy backs using cheap BBB debt. Today the S&P closed at 3005. A 19% haircut would be 2434 a 571 point drop. Are you still feeling wealthy? Because of “low cost” passive investing we have lost price discovery in the market. We just mindlessly plow money month after month into these funds and don’t have the first clue what we actually own on a risk adjusted basis. You hear it all over these blogs quacking about 100% stock portfolios. If you own ONLY passive funds, without accurate price discovery what you actually own is pure risk, pure volatility. In addition those vehicles are crowded instruments. Once the safety valve on the redemption pile is blown ACTUAL shares will need liquidation, pronto. The robots don’t care they will lever up OR lever down. so your trading an asset without adequate price discovery in a market of varying leverage ON A BIG SCALE. I read recently with shadow indexing passive investing is 70% of the market. That means we are living in a world of huge fat tail risk. 2008 anyone? 2000 anyone? It can never go down anyone? Did the fat lady sing?
The other problem with passive investing is you generally never buy low. Look at that S&P chart and mark off some yearly purchase prices. Nearly every year you paid more than the year before. Every year you “bought high” compared to the year before. That’s the problem with the inability to determine price. You just keep buying stuff in a clueless way.
So we have a faulty vehicle, “passive investing”, which is nothing but levered beta in a land of fat tails. We have an inverted yield curve. We have dramatically increasing business failures (the precursor to unemployment). We have reduced boomer consumption lowering GDP. We have boomers escaping the workforce driving down productivity. We have virtually every major foreign market rolling over in a relatively dramatic fashion. Korea Japan Australia China Europe SA, and lets not forget a looming war in the middle east), just begging for US intervention. IMHO the FED doesn’t have the bullets necessary and their balance sheet is already soiled. Because QE worked once does not mean it will work again.
Corporate debt is AS BAD as the 2008 problem and a 1T junk bond market can’t absorb 2T of BBB when things start to fail. Hey where did the liquidity go? I think the debt setup is house of cards like 2006 except on the corporate side, and if corps go bust how are all those jobless people going to rent all those crowd sourced apartments? Who is going to rent those empty storefronts? We’ll all be living in tents in the P.R. of Kalifornia. Get ready Newsome, the big one is coming! The US from a macro perspective is about half sunk compared to the others like EU and Japan and Korea which are sunk. Japan’s debt:GDP is 250% (we’re running 105%) We will go into recession as soon as the denial cracks. The happy talk will work till it doesn’t. How bad remains to be seen. Dalio thinks this is like 1937. We got out of 37 with WW2 Airplanes don’t fly into the ground for a single reason. There is enough backup to countermand a single reason. Airplanes fly into the ground because 6 reasons all line up and point into the ground simultaneously.
@Gasem… excellent post, saved me a ton of typing. The one thing I want to add to it is that all this discussion (especially post M.Burry post) is focused on pushing back against his comments and specifically broad-based equity ETFs. That is an error. There are massive ETF holdings in many different ETFs some very niche) that are going to get taken out at some point (Levered ETFs etc etc) and this is just on the equity side. What are the possibilities when credit (bond) funds hit stormy weather? How fast and how amplified will be the damage when it jumps lanes into equity markets? This even more so because of the nature of who holds a lot of this risk (hot money and ignorant money). The potential reflexivity reminds me of ’87 ‘portfolio insurance’.
Thanks for your reply! Always good to know that I’m not the most pessimistic and conservative out there. 🙂
The unemployment claims number is not wrong. It is what it is. People might interpret it wrong but the number is what it is.
I don’t buy your “baby boomer causing economic weakness” argument. I see what you’re saying, even the share the same experience (downgraded from a luxury European V8 sedan to a Honda) but that won’t cause a recession. Demographic change is wayyyyyy too slow to be noticeable in Q/Q GDP numbers. Demographic change will change the TREND growth rate by a few 0.1%, but can’t take an economy from a 2.0% trend to a -3.0% growth rate over the course of a few quarters. It’s mathematically impossible.
Stock buybacks: over what time frame is that 19% calculated? We now have significantly lower dividend yield than a few decades ago. If there’s a 1-2% “gain” per year from buybacks I’m not too worried.
But I share many of your other concerns: a lot of leverage. Bad economic, heavy-handed policy (Commi-fornia, etc.) it’s all bad for growth long-term.
I 100% agree the “number” is what it is. Unemployment rate = unemployed / civilian labor force.
Unemployed is
you must be over 16 and have been available to work full-time during the past four weeks. Most importantly, you must have actively looked for work during that same period. The only exception is if you were temporarily laid off and simply waiting to be called back to a specific job.
civilian labor force is:
The civilian labor force also has a very specific definition. It includes the unemployed plus the employed, no one else.
So the creation of the number is complex. The question them becomes what is the correlation between the number and the state of the economy, and is that correlation static or dynamic? In the middle of an up trend the correlation tends to be static, at a cycle turn more dynamic. Economic productivity which is the thing that is being correlated with in terms of employment is related to the expertise of the employed. I was an anesthesiologist for 35 years and you a financial analyst. US productivity has lost our combined expertise and is therefore less productive. This is why there are not :”enough qualified job applicants”, because we were very qualified. That’s the source of the dynamic correlation. We are but 2 people but we are part of an aggregate, and our existence in the aggregate gives the whole a kind of direction, not picked up by the number. If I drop out of the numerator and drop out of the denominator then effectively number stays the same, but my expertise is lost to productivity In addition as a retired I spend less so that is added to a softening in GDP and recession is 2 negative quarters of GDP GROWTH. I’m not calling for a recession but I did reduce some risk because the number is merely an indicator of variable correlation at a cycle peak.
It’s a small point. We are either in a recession or heading to a recession. That part is objective. If you’re not going to do anything then there is nothing to do. (Not you personally but “you as a group making a bet”) You stand there and bravely take your lumps. That position is a 100% bet you won’t get creamed based on the hocus pocus that the past repeats in a linear upward trending way, and you will have the time to recover. In Japan, 40 years later they are still waiting to recover. I’m not pessimistic I’m just not willing to take that bet that the past is prologue to the future, or at least as tightly linked to the future as it has been. My perspective is we are in a time of exceedingly fat tails, and Ill play the Bayesian analysis accordingly. I want my ball to wind up on the high side of the mean when I flip the Galton board. If the herd is crowding into a trade that is drunkenly looking for yield above all else, I’ll fade that trade. My goal now is not to make all the money. I already made all the money. My goal is to not loose all the money.
This is the reason I bring this up, not to challenge your analysis Always enjoy the discussion
Gasem- I like when smart people discuss (debate) topics that are of interest to the rest of us. I’ve learned just as much from comment boards as I have from the blogs themselves.
That said, how long have you held your skeptical views on this current market. It seems like a lot of the potential issues you’ve brought up have been around for quite some time now (financial engineering, passive investing, lagging or shadow jobless reports). My question to you is what indicators do you actively track and have you gotten out of equities because of your analysis. By “not willing to take the bet” does that mean you’ve been sitting out the market run these past few years?
I ask because as someone within 8 years of FIRE, I too don’t totally align with the “Leave it alone, it’ll all work out” thought process. I’m to far out to start a glide path but a prolonged haircut could add another few years to my FIRE date. The Burry stuff sure seems to be sparking a lot of debate in the blogosphere and I like to read all sides of an argument.
Gasem, would taking you and ERN out of the equation as lost productivity be a clear cut assessment? Is your/ERNs productivity not fungible?
I see it as ERN and other boomers/FIREds had transferred their remaining (or unspent, since you save it up over the years) human capital into money capital (stash) which now will be used, recession or not, mostly for investment and consumption well beyond the grave. If employed person (not retired) becomes unemployed there is no investment/consumption to be had as their capital is only human capital and is frozen until they get another job. In addition, if I follow Kitcies arguments, most of the boomers/FIREds if saved at all, saved too much and will leave it (likely IT x n) to their kids to blow within the next 30 years + their own human capital if any giving all of that productivity back to the economy.
There are two separate issues surrounding the boomer retirement:
1: withdrawal from the labor market and thus slimming down the worker pool
2: while living in retirement, they will (ostensibly) sell their equities and live off their nest egg.
Both have been sold as doomsday scenarios for the economy.
I agree that #2 is overblown. It’s been pointed out by various people that boomers will likely grow their nest egg on average. (not all of them individually, but aggregate!)
#1 is clearly a slight drag on growth rates. But it’s in the neighborhood of maybe 0.1-0.2% annualized growth. It’s a movement that’s way too small to cause a recession.
Just for the record: the unemployment RATE is not really something I follow too closely. It’s more of a lagging indicator, albeit a very precise one (i.e., if UER spikes up you KNOW we’re in a recession, even though it was painfully obvious from all the other indicators already – thanks for nothing!).
Unemployment CLAIMS are a different animal. They are the gross numbers and they are reported weekly with very little revisions. When I worked in the industry and set up our own proprietary leading index framework (with all the Bells and Whistles: Bayesian analysis, Kalman Filter, etc.) the unemployment claims series was always high on the list of indicators that correlated with the cycle. And again: no one single indicator will ever work forecasting anything as complicated as the economy. But the Claims data would still be a powerful indicator. Ignore it at your own peril! 🙂
Gasem, very good points esp re:unemployment numbers that do not reflect qualitative and structural differences than in previous periods. This article talks about the Labor Participation rate, how its declining for younger age groups and also among men:
https://seekingalpha.com/article/4292918-american-consumer-fragile-people-realize
True this may be a gradual & longer term trend just like the demographic changes but doesn’t it contribute the the fragility of the economic expansion such that any minor shock could tip it into a recession? With all that is going on (leverage, trade, geo-politics…) I’m frankly amazed that the stock market is not tanking. Makes me wonder if investors are staying in the market because of FOMO (fear of missing out) or TINA (there is no alternative). Even if we knew a recession is around the corner, the question of what to do is 64 million dollar question. If I was an early retiree, maybe I would start tilling the soil in my back yard! Ha! That literally just popped into my head – not a bad idea when you consider the positive side effects (exercise + fresh produce) I’m liking this idea 🙂
@Gasem, a lot of pessimism in your post but not back by rational thinking. For example, “We’ll all be living in tents in the P.R. of Kalifornia.” Why? Those that own a fully paid up house will have no reason to do something like that. Everyone who is doing FIRE should have a paid up primary somewhere on the planet. Another one, “The US from a macro perspective is about half sunk compared to the others like EU and Japan and Korea which are sunk.” Well that is a good thing for people that have US money/assets. There is no absolute value of money. When others are losing more than you, you are automatically winning, unless you have to liquidate, which no smart investor should have to, ERN already addressed your claim about the impact of retiring boomers on the GDP, that was the weakest of your doom and gloom arguments.
PMI doesn’t seem to be much of a leading indicator. It didn’t get to 45 till halfway through the 2008-09 recession.
It does move late in some recessions. In others it’s more timely. That’s why I would never rely on one single indicator.
Also, recall that 2008/9 was a banking crisis, so that explains the late response in manufacturing.
Also note: Since everybody is worried about tariffs now and how they may impact growth, I think PMI might be a good indicator for today.
Big ERN, given that the US is a consumer driven economy I am curious why one of the factors you track is not the consumer confidence. Personally when I see that factor dropping it is the only one I panic cause the US consumer is the engine not just of US economy but also the global economy.
As a secondary indicator, sure. But consumer confidence wouldn’t make it into my top-3. Too noisy, too many false alarms:
https://fred.stlouisfed.org/series/UMCSENT/
I always love your realistic approach that balances out the many FIRE bloggers who spout the 4% rule and say you do not have to worry about the markets. Question however – as a retired person if your poor mans indicator shows a recession what actions in terms of your portfolio would you take (actions you would recommended to investors who are not financial pros like yourself)? Reduce non essential spending, sure. You are already planning on a more realistic withdrawal rate. Are there any other changes? Or would you stay away from timing any proactive adjustments based on indicators?
Great point:
Asset allocation: I wouldn’t change anything if there is further deterioration but the market already dropped 20+% and prices in just as much pessimism as I already see myself.
Retirement budget: I would definetely cut some expenses: travel & entertainment.
Regarding unemployment as a leading indicator, check out the graph here: https://www.brookings.edu/blog/up-front/2019/06/06/how-will-we-know-when-a-recession-is-coming/
The trick is to use a rolling average of unemployment, rather than single data points as they are announced. There is a very tight correlation between the rolling average increases I referenced in previous post and the onset of a recession – which btw, aren’t usually called until after they’re well under way.
for instance, in 2008, if you’d have used rolling average unemployment as a leading indicator, you would have seen the recession coming a month or two before it was actually confirmed as having started; and that date wasn’t called until a few months after it had already started – so you would have been 3-6 months ahead of the Fed’s confirmation.
As for timing the market using this, you might not have gotten out before the first initial market drop. But if your plan was to get out, you would’ve been able to get out before it dropped another 25% or so.
This is really interesting. It’s because the unemployment rate UER (as opposed to unemployment claims) is normally considered lagging. THanks for the link!
Thanks Tshort and ERN. I just tried the Rahm indicator with data from 1948. There is a correlation, but I am not sure you can time it. Perhaps when the market is on the way up i.e. the Rahm indicator starts going back down.
https://docs.google.com/spreadsheets/d/1aOVyTWAFmf4W1LcZxwPHiixcVQqjVeFFMayMkAEdivg/edit#gid=0
It’s tricky. By the time the indicator goes up significantly, the recession is already 2-3 months underway and the market started dropping 5-6 months ago.
Maybe set a really “light trigger” but then you also generate some false alarms.
So, I’m not a huge fan of the UER. It tends to be lagging the cycle.
The Economist, etc. have reported on a “Sahm’s rule,” named after a fed economist who discovered a new way to look at unemployment data vis. the start of a recession. Would you, or would you not, prefer that over initial claims as an indicator, and why? Here is the text of her write-up:
https://www.hamiltonproject.org/papers/direct_stimulus_payments_to_individuals
Argues that recession onset is roughly when the 3 month moving average exceeds the previous 12-month low by 0.3 percent. She argues automatic stabilizers should start at 0.5% above 3-mo MA.
That’s likely too late to move. Also be aware that sometimes employment data are revised, so what looks really good in the backtest doesn’t work well in real time.
So, from my own experience, I’d prefer the Claims data over the UER data: faster moving and cleaner/less-revised data.
Man, you’re awesome. Thanks for being awesome, and sharing it with us on the interwebs.
Awesome! Glad you likes it! 🙂
There have been at least 10 recessions since 1950. Therefore, we tend to have a recession on average about every 7 years (1950-2019) over 70 years/10 recessions = 7.
The longest was the 2007-09 Great Recession which lasted 18 months. One economist believes this is a rare occurrence as most recessions last less than 12 months. Stripping out the Great Recession – which Moody’s Chief Economist Mark Zandi calls a once in a 50- or 100-year event – recessions since the end of World War II lasted six months to 16 months, averaging 10.4 months. The Great Recession was longer at 18 months.Therefore, the 2009 recession is a once in a 50-year or 100-year event.
Being armed with this knowledge, we know that there is an immediate recovery right after a recession as the one we are in now. Therefore, if you want to hope for the best but prepare for the worst, it would be best to keep at least 2 years of income in cash savings as the average recession lasts about 1.5 years. This should give you a buffer should the next one occur and allow you to ride out the storm, even in case of job loss or illness.
Best Regards,
Miriam
That line of reasonoing is very commen. But it’s also flawed. The recivery takes a lo longer than most people realize. See my recent post “Who’s Afraid of a Bear Market?”:
https://earlyretirementnow.com/2019/10/30/who-is-afraid-of-a-bear-market/
2 years of cash savings? Nope, try 10+ years. The 2000 market peak wasn’t reached again in real terms until 2013!