
August 31, 2020 – Recently, there’s been some discussion in the FIRE community about a controversial post written by Sam, a.k.a. “Financial Samurai,” claiming that in light of the current record-low bond yields, specifically, the sub-1% yield on the 10-year Treasury bond, we now all have to scale back our early retirement safe withdrawal rates to… wait for it… only 0.5%! Of course, I’m one of the more cautious and conservative planners in the FIRE community, see my Safe Withdrawal Rate Series, but even I would not push people to less than 3%, even in light of today’s expensive asset valuations.
So, 0.5% seems a bit crazy low to me. What’s going on here? It’s pretty simple; the 0.5% number relies on several mathematical, financial and just plain logical flaws. Let’s unpack them all…
1: A fundamental misunderstanding of the Trinity Study
According to Sam, the rationale behind the 0.5% safe withdrawal rate is that back in 1998, when the original Trinity Study was released, the 10-year Treasury bond yield was about 5% and the recommended SWR was 4%. So, the SWR was exactly 0.8x the bond yield. Which prompts Sam to propose the following Fundamental Law of Thermodynamics Personal Finance:
“To make things simple, the new safe withdrawal rate equals the 10-year bond yield X 80%. Let’s call this the Financial Samurai Safe Withdrawal Rate.” Source: Financial Samurai
Currently, the bond yield is at about 0.7%, so if we exactly linearly and proportionately scale the SWR as proposed by Sam, we’d arrive at the roughly 0.5% SWR today.
This line of thinking demonstrates that Sam probably hasn’t read the Trinity Study at all or hasn’t read the study carefully enough to fully grasp what it actually does. Very few people have, so I don’t want to be too harsh on him. You see, the study relies on historical simulations between 1926 and 1995 (further extended to include post-1995 data in follow-up studies). The 4% is in no way tied to one single fixed, set-in-stone 5% bond yield in 1998. The 4% Rule is based on the highest withdrawal rate that would have survived a 30-year window post-1926. In absolutely no way is the 4% Rule tied to the window starting in 1998 for which the researchers back then didn’t even have the necessary 30 years of return data. (and neither do we today!)
Most importantly, during those historical simulations, the 10-year bond rate wasn’t always 5%. Quite the opposite, the 10-year yield ranged from 1.95% at the low in 1941 to over 15% in the 1970s. And also notice that the original Trinity Study published in 1998 is using data until 1995. Therefore, they only looked at cohorts that started retirement between 1926 and 1965. And during those years, you’d have a range of yields between 1.95% and 4.72%, an average of only 3.02%, and a standard deviation of 0.68%, i.e., much lower than the 5% figure that Sam works with!

So, even if the SWR was intricately tied to the 10-year nominal bond rate – it isn’t, more on that later!!! – then you shouldn’t connect the 4% Trinity Study SWR to the final prevailing interest rate in 1998 but the lowest prevailing interest rate throughout the Trinity Study. In 1941 the bond yield was only 1.95%. The 10-year yield is now about 1.25 percentage points lower than in 1941. If we indeed want to adjust the SWR by 0.8% for every 1.0% in the 10-year nominal Treasury yield – we shouldn’t do that either, more on that later!!! – then you should first link the 4% SWR in the Trinity Study to the 1.95% yield, the lowest ever observed between 1926 and 1998, and then reduce the Trinity Study 4% SWR by 1.25%x0.8=1%. So, you’d end up with a 3% safe withdrawal rate, rather than 0.5%. Quite a big difference!
But even this calculation is seriously flawed, which brings us to the next flaw in Sam’s post.
2: Proposing a withdrawal rate rule without running any calculations or simulations
Let’s plot Sam’s Fundamental Law of Thermodynamics Personal Finance in a scatter plot, with the bond yield on the x-axis and the actual realized simulated SWR on the y-axis (assuming a 60/40 portfolio). I also include the naive 4% Rule, i.e., just a horizontal line at 4%. Please see the chart below. A few observations:
- You see very clearly the rationale and the appeal of the 4% Rule: It’s a nice round number that “hugs” the bottom of the historically realized SWRs. Well, not perfectly; there were about 3% of the cohorts that would just about fail. But it’s close enough.
- The realized SWRs have no particular linear relationship with the prevailing bond yield at the start of retirement, in stark contrast to Sam’s claims. True, when you go from a 5% bond yield to a 15% bond yield, there was indeed something of an upward-sloping relationship (though not linear!). But for low yields (between 2% and 5%) you – shockingly – had a negative(!!!) slope between the two variables! Thus, and in direct contradiction to Sam’s claims, low 10-year yields have not been associated with low withdrawal rates in the past 100 years. The failures of the 4% Rule all occurred when the 10-year yield was between 3.5 and about 6%. Never when the yields were exceptionally low. Quite the opposite: when 10-year yields were at their previous historic lows of around 2%, the eventual realized SWR would have been at around 7%. Had you followed Sam’s Rule and retired with a 1.6% initial withdrawal rate (2%x0.8) you would have vastly underestimated the true SWR. And people who follow this insanely low 0.5% recommendation today will likely do too.
- Sam’s Rule would have failed you a whopping 11% of the time in the 1926-2020 simulation period (asset returns 1926-2020, retirement cohorts 1926-1990). So, the recommended SWR=0.8-times-yield rule would have predicted too high a withdrawal rate in 11% of the cohorts. All of the failures would have occurred when yields were in the 5% to 15% range.

Thus, Sam’s Rule is the worst of all worlds: Way too conservative when yields are low and way too aggressive when yields are high.
The big takeaway is that bond yields are simply not that predictive for retirement success of an equity-centric portfolio. And if you know a little bit of economics and finance it makes sense: Low yields are often associated with accommodative monetary policy and low and stable inflation. And that spurs growth and supports the stock market. Very often, the peak of the stock market occurs after a sharp rise in interest rates when my former employer, the Federal Reserve, goes overboard with (short-term) interest rate hikes and sinks the economy and the stock market! Hence the non-monotone relationship between yields and withdrawal rates!
3: Confounding real and nominal returns
I’ve said this on several occasions before, including the Part 1 of the “How to Lie with Personal Finance” series: we have to distinguish between real vs. nominal numbers, especially when studying horizons of 30 years or more. When people mess up nominal vs. real, my BS alarm flashes red, and Sam’s post is way up there. Tying a nominal interest rate to a safe withdrawal rule that adjusts future withdrawals by inflation is just plain wrong. The right thing to do would be to use real, inflation-adjusted interest rates. Either use nominal bond yields adjusted by inflation expectations or just use the TIPS (Treasury Inflation-Protected Securities) rates directly.
But using bond rates to pin down withdrawal rates makes sense only when you have a portfolio that’s mostly (entirely?) invested in bonds. Which brings us to the next point…
4: Safe Withdrawal Rates based on 100% bond portfolios and current real bond yields are still likely greater than 0.5%. If you’re OK with at least partial capital depletion!
I want to give Sam’s approach of tying safe withdrawal rates to bond yields at least one honest try. Let’s assume you indeed retire with a 100% bond portfolio. I don’t know anyone who does this, certainly not in the FIRE community, but out of academic curiosity, let’s give it a try.
First, taking item #3 seriously, we’d look at the real, not the nominal bond yield. The real yields of TIPS are currently around -0.26% for the 30-year (and -0.99% for the 10-year TIPS) as of August 27 (Source: Federal Reserve Table H.15). But even with yields in the -1% to 0% range, you’d still be able to pull off a so-so withdrawal rate. In the chart below, I use the Excel PMT function to calculate the sustainable real withdrawal rate as a function of the real interest rate (x-axis) for different time horizons (30 years and 60 years) and also for different final value targets: 0% (capital depletion), 25%, 50% and 100% (capital preservation). It’s essentially an amortization calculation.
Let’s take a look at the results:
- First of all, if you insist on full real capital preservation, then the safe withdrawal rate calculation becomes trivial: You withdraw exactly the real interest income. And with today’s negative yields it implies that you will never be able to retire on a U.S. Treasury portfolio alone. It’s because even with zero withdrawals, the bond interest income is insufficient to guarantee that the principal keeps up with inflation. Bummer! That’s even direr than Sam’s 0.5% rate!
- But if you’re OK with full depletion or at least partial depletion of your assets you can go much higher than 0.5%: If we use the roughly -0.25% real rate on the 30-year TIPS, you get 3.2%, 2.3% and 1.4% safe withdrawal rates for a 30-year horizon and 0%/25%/50% final asset target, respectively. If you face a -0.25% real return over a 60-year window, you can still withdraw 1.5% p.a. and only slowly deplete your capital over 60 years. Though, I hope that real rates will go positive eventually.
- Also notice that in the late 1990s, TIPS yields were north of 3%. Over a 30-year horizon, you could have easily pulled off a 4% safe withdrawal rate and still have 50% of the capital left after 30 years. Or even a 5% withdrawal rate with capital depletion. Pretty impressive!

So, for a 100% bond portfolios, Sam’s claim that you have to reduce your SWR relative to 1998 is certainly true. But it doesn’t mean you have to go all the way down to 0.5%!
Side note for the finance geeks: The mathematically cleaner way would have been to look at a bond ladder to exactly match the desired cash flows over the retirement horizon. I have a toolkit for that: A Bond/CD Ladder Toolkit if you want to try.
5: Ignoring equity valuation
As we saw in item #2 above, bond yields have pretty much zero explanatory power in accounting for the variations of safe withdrawal rates over time. But what about that big gorilla in the room: equities! If you have a 60/40 portfolio – 60% equities and 40% bonds – then my natural tendency would be to look at equity valuations first. Which, by the way, I’ve done extensively in my Safe Withdrawal Rate Series. I’ve shown that the risk of running out of money in retirement is closely linked to expensive equity valuations at the start of your retirement. Nobody ever worried about the 4% Rule when they retired in 2003 or 2009 at the bottom of the respective bear markets.
A different story emerges for the retirement cohorts in 1929, 1968, 1973, 2000 or 2007 at the peak of the respective bull markets when equity multiples (PE or Shiller CAPE or any other multiple you prefer) were dangerously elevated; those were the times when folks indeed worried about their retirement safety. Though never enough to reduce the withdrawal rate to below 3%, not even in 1929, not even over a 60-year horizon starting in 1929!
So, let’s create the same scatter plot as above, but use the equity valuations as measured by the inverse of the CAPE ratio, also known as the CAEY (where the EY stands for earnings yield) on the x-axis and compute how actual safe withdrawal rates would have lined up with that earnings yield between 1926 and 1990. And again, I have to stop in 1990 because July 1990 is the last retirement cohort for which I have a complete 30-year return window for my simulations. But I do use all return data until 2020!
Let’s look at the chart below:
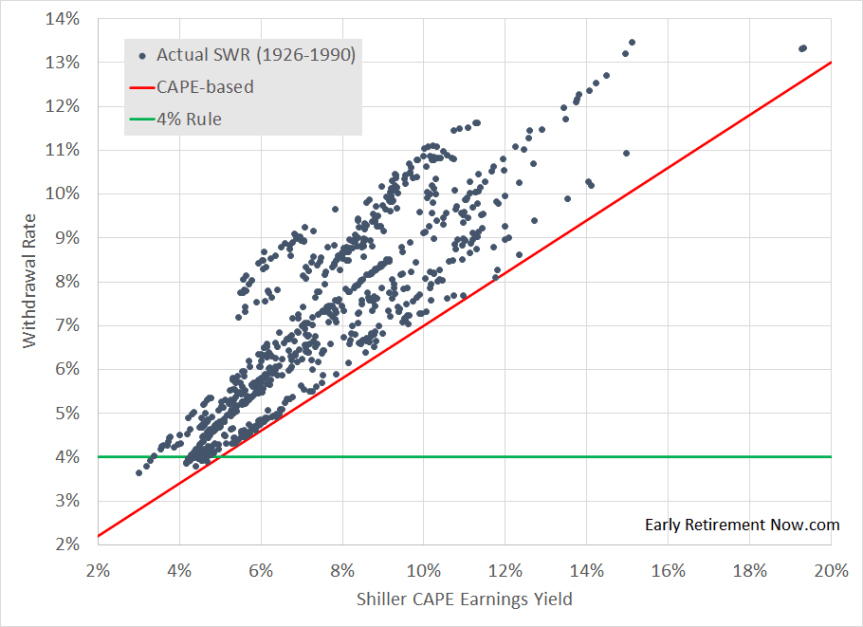
Aha! Now we’re getting somewhere! That’s a much better correlation than with the bond yield. And it makes sense: The CAPE is very correlated with the forward 10-year equity return, and the first ten years of returns during any retirement window are extremely predictive for retirement success and hence the safe withdrawal rate. What’s more, even though equities may have a share of “only” 60% in the portfolio, a slight majority, equities still account for the overwhelming majority of the portfolio volatility. This is the point I made in a post a long time ago.
Notice, in the chart, I also added a straight red line but not in the way you’d normally see it – a uni-variate OLS-fitted regression line that tries to optimize the fit through the scatter plot of dots. You don’t want to that to determine your fail-safe historical withdrawal rate because that would have failed roughly 50% of the time. As a cautious financial planner, you want to fit a lower envelope line that hugs the dots in the scatter plot from below. I fitted that with an intercept of 0.01 (1%) and a slope of 0.6. Since the current CAPE is around 30, that would translate into a fail-safe withdrawal rate of 0.01+0.6/30=0.03=3%. Lower than 4% but much higher than the 0.5% recommended with his model.
Also, notice that the chart above is a nice way to showcase everything that’s wrong with the Trinity Study and the traditional naive 4% Rule! The 4% Rule is not safe at all when equities are very expensive, i.e., today! All the failures occur when the earnings yield is below 4.5% (barely above 3% today!). Likewise, the 4% Rule is too conservative for retirees that find themselves not at the peak of the stock market bubble. You’d be crazy to retire with a 4% Rule if and when the CAPE ever goes back below 20.
Conclusion
Why did I even write this post and provide publicity and a link and SEO assistance to a pretty transparent troll/click-bait post? Well, first of all, I could have certainly written a blog post without linking to the original post on Sam’s blog. But that’s bad style. I started my career in academia and the courteous thing to do is to properly reference other people’s work, even the work you don’t agree with. Not doing so would actually mostly hurt my own reputation. I’ve seen people attack my work without referencing and/or properly linking to it. I’ve even seen other bloggers remove comments linking to my blog. I don’t want to copy such punk and antisocial behavior, so the respectful thing to do is to properly link to the Financial Samurai blog. Even if that means that his troll post will get more traffic out of it. Even if I suspect that Sam will not link to my post if he ever decides to write a follow-up to defend his work.
I also think that it was a fun exercise to look at this preposterous 0.5% claim and to see where the logic went awry. We learn just as much (or even more) from mistakes. So, I think Sam/Financial Samurai has done us all a favor; he made us think! I learned a thing or two in the process. For example, I’ve played around with dynamic, valuation-based withdrawal rates before, most prominently the CAPE-based rule (see Part 18 of the SWR Series). I’ve always thought that one has to factor in bond yields as well, not just the Shiller earnings yields. But adding the bond yields didn’t ever get me much. I understand why; bond yields are just not that predictive for retirement success if you have a 60+% equity weight. Low bond yields can be bad because 40% of your portfolio has low expected returns. But low yields can also be a blessing when that means we have an accommodative monetary policy and your equity portfolio will go through the roof! In other words, it’s possible that for every $1 you lose due to lower bond income you also gain more than $1 in extra equity returns! That certainly appears to be the case historically.
Also notice that as wrong as Sam’s calculations may have been, he was on the right track. Asset valuations matter for withdrawal rates. Ignoring this is one of my main pet-peeves with the Trinity Study and some of the FIRE blogging scene. But you gotta use the valuation of the relevant asset: equities!
So, to wrap up, would I think that the entire FIRE community is now breathing a sigh of relief in light of my rebuttal? Certainly not! The 0.5% withdrawal rate, thankfully, was just so outrageous and so transparently false and asinine that I can’t imagine anyone would have taken his post very seriously. Though, never say never. Apparently, Marketwatch picked it up. But maybe they ran out of things to write about during the slow summer months. And I wouldn’t be surprised if Suze Orman endorses the claim that you need $8m to retire. But people who are serious about finance and math will probably use a baseline, bare-bones Safe Withdrawal Rate in the 3.00-3.50% range if they are young and have a long horizon. And you can use significantly higher rates if you expect generous company pensions and Social Security later during retirement or if the CAPE ratio were to go back to more normal levels! Check out my Safe Withdrawal Rate Series (nominated again for the Plutus Award in 2020), including my free Simulation Tool to find out more!
Thanks for stopping by today! Looking forward to a lively discussion again!
Title picture source: pixabay.com
Hey, Big ERN! I used to read Sam’s blog about 5 years ago but stopped due to the high degree of sensationalism and “bloatwrite”. As a HNWI and a former ibanker, I applaud your work. Yours is pretty much the only blog I keep reading. Thanks for what you are doing to the FIRE blogging community, where most pundits peddle hope or sensations, while most readers need a realism pill.
Thanks for your kind words, Alex! Glad you find my content helpful! 🙂
I’m glad you show that he’s wrong. Gosh the way things are going pretty soon your SWR will be negative like Fed rates will probably go. Humanity will be doomed if that happens. [this part redacted]
Well, yeah, that negative rate already tells you that the 0.8x10yRate is probably wrong.
But I’m hopeful that rates will eventually go back to half-way-normal again.
Great follow up Big ERN! I nearly choked when I first read Sam’s 0.5% SWR. I’m sure it was click bait, but then again, I’ve struggled with a lot of Sam’s more recent blogs, so who knows! Anyway, I’m not here to berate Sam or anyone else. I always come back here for the fact based approach that you always use to prove out your points. I really appreciate your work and skillful efforts to help us all find our own
solid SWR. Keep up the great work. Three and a half years early retired and a long term fanfic tour blog!
Should’ve said “…long term fan of your blog”…Lol! Wow…never try to type a response on a cell keypad after 10pm!!
Haha, I sspected that. Sometimes the auto-correct on a phone creates even crazier phrases. 🙂
Wow, thanks for the feedback! Congrats on your retirement. Almost 2.5 years for us now and it never gets old! 🙂
Hey, ERN –
Thanks for the great analysis, as always! I wanted to revisit with kind of a dumb question from the beginning of 2021.
We’ve seen stocks continue to rally (probably from a combination of stimulus and vaccine optimism) and the CAPE right now is apparently 33.74. If we apply your formula from part 5 (.1 + .6/($CAPE) => SWR) we predict that the new SWR is a slightly higher than 2.7%. That’s lower than you usually advocate for – do you suspect that current savers might need to consider sub-3% withdrawal rates moving forward, or am I just reading too much into an approximation here?
Depends on the CAPE rule you use. If you set the intercept to 0.5, as seems to be standard and shift the intercept all the way up to 1.75% then you get:
0.0175 + 0.5/33.74=3.23%. That’s pretty good because it should roughly preserve the capital over time. If you do an additional adjustment to account for the partial capital depletion and target a 0.25% final value after 50 years you’d get this:
=PMT(0.0323,50,-1,0.25,1)
which equals 3.73%. Not bad.
Thanks for the rational sanity of your post. I too used to follow Financial Samurai but have found his posts in more recent years to be out of touch with reality and more “click-baity.” This latest one of his was insane. If he truly feels like he can’t safely withdrawal more than 0.5% from the millions he’s accumulated, then I think there might be a mental health issue for him to deal with!
Haha, that’s the first time I hear the mental health angle. Interesting theory!

Even though, I still suspect it’s all a troll issue. It seems to work: it brings a lot of traffic to his site! 🙂
Hey ERN – do you know how the 0.6 beta + 1% would change for different stock/bond allocations? 70/30, 80/20, 90/10, 100/0? This stuff is so interesting! Especially as the CAPE continues to climb…
It’s really up to you how much you fear drawdown in your withdrawals. You can test different rules under different S/B allocations in my Google Sheet, see Part 28.
Thank you for a well thought out logical piece of work. Very enjoyable to read!
You bet! Thanks for the feedback! 🙂
I am sure he was just trying to create a reaction, which he did. It’s probably one of the most referenced articles in the community. It’s been a while since I read it, but I think he did I want to leave all his principal to his kids, which the 4% rule does not plan for (even though .5% would result in more being left)
Even with a sizable bequest target, you can do much more than SWR=0.5%. Check out my Part 28 for SWR simulations.