
October 18, 2021 – After three posts in a row about safe withdrawal rates, parts 46, 47, and 48 of the series, let’s make sure we have the right level of diversity here. Welcome to a new installment of the option writing series! I wanted to give a brief update on several different fronts:
- A quick YTD performance update.
- How does the option selling strategy fit into my overall portfolio? Is this a 100% fixed income strategy because that’s where I hold the margin cash? Or a 100% equity strategy because I trade puts on margin on top of that? Or maybe even a 200+% equity strategy because I use somewhere around 2x to 2.5x leverage?
- By popular demand: Big ERN’s “super-secret sauce” for accounting for the intra-day adjustments of the Options Greeks. This is a timely topic because the Interactive Brokers values for the SPX Put Options seem to be wildly off the mark, especially for options close to expiration. So, you have to get your hands dirty and calculate your own options Greeks, especially the Delta estimates.
- There’s one slight change in the strategy I recently made: I trade fewer contracts but with a higher Delta thus reducing my leverage and the possibility of extreme tail-risk events.
Let’s dive right in…
1: Performance Update
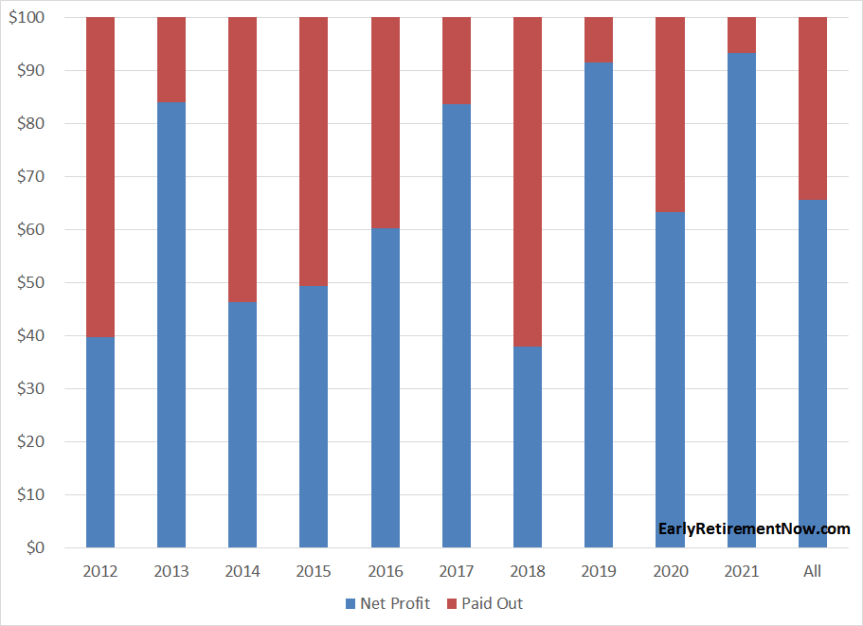
How’s the strategy doing this year? It’s been a pretty awesome year so far. The option-writing portion of the portfolio has done phenomenally well with a premium capture (=net income) of over 93%. In other words, for every $1.00 in option premium I sell, I got to keep $0.93 on average. Pretty sweet because my personal, conservative budget for net income is only 40%, i.e., I budget 60% of the gross option premium as potential losses. Since 2012, the premium capture was about 65%. The record calendar year premium capture was 91% in 2019. I don’t want to jinx anything, but I hope my strikes will hold up until the end of the year and I break another record!
In 2021, year-to-date, the only major loss occurred on May 12, when the S&P closed at 4063.04, lower than most of the strikes I had that day (between 4060 and 4080). But the losses were pretty small, about the equivalent of half a month of put income. I should also mention that I suffered one very minor loss on an intra-day trade, i.e., where at around the market open, I sell puts expiring that same day for a little bit of extra income. That was on September 30 when I sold two extra puts with a 4310 strike when the index stood at 4374 early during the day, only to meltdown toward the market close to cause a net loss of $324.38 after commissions. Not the end of the world!

How about the rest of the portfolio? Under the circumstances, the fixed-income portfolio held up remarkably well! As you may remember from Part 3 of the series, I’ve now shifted more of my margin cash into higher-yielding but also higher-risk instruments, such as (leveraged!) Muni Closed-End Funds and Preferred Shares. And even within the Preferred bucket, I used to have mostly the highest-quality names (Goldman Sachs, Wells Fargo, State Street, etc.) but now I’ve also included some lower-quality/higher-yield names (ATCO, CUBI, SCE, VIASP).

That portfolio of risky fixed-income has worked out really nicely! Not only did I earn substantial interest/dividend income, but I even have a little bit of capital gains YTD. To give you some more concrete numbers, the YTD return so far is 13.39%. 8.40 percentage points came from the put selling, 4.99 percentage points from the rest of the portfolio (i.e., fixed income). Drilling further into the fixed-income returns, 3.76 percentage points are due to dividends and interest, and 1.23 percentage points are due to (paper) capital gains.

Considering the wild ride in interest rates this year – the 10-year Treasury starting at 0.917% on 12/31/2020 and rising to 1.576% by October 15 – you’d think that the fixed-income portfolio would be seriously underwater. The iShares 7-10 Year Treasury Bond ETF (IEF) is down almost 4% YTD and that’s including interest income! So far, the preferred shares and Muni funds have dodged that duration doom. Whew!
13.39% YTD sounds good in absolute terms, but I can already hear the naysayers:
“But, but, but my VTSAX made 18%!”
So, why do I go through the hassle of 3x weekly options trades when I could have leaned back and invested the whole thing “Jack-Bogle-style”? Pretty simple: the IB account does not replace the equity portion of the portfolio. It’s supposed to mimic a small share of the equity portfolio and a large part of the safe-asset portion and thus has a much lower return target. This brings me to the next section…
2: How does the Put Selling Strategy fit into our overall portfolio?
A few weeks ago when I attended the 2021 FinCon meeting in Austin I was chatting about my option-selling strategy with some of the other attendees. Someone wondered if I really practice what I preach in my Safe Withdrawal Rate Series, i.e., keep the equity portion of the portfolio to 75%, maybe a max of 80% to hedge against Sequence Risk. If you were to interpret my IB account as 100% equities (or maybe even leveraged equity) then my overall portfolio would indeed be completely at odds with what I’m preaching on my little blog here. How do I account for the IB account then? Well, let me take stock of our assets first. Our financial portfolio (not counting our primary residence) has the following weights:
- 30.6% options trading at Interactive Brokers,
- 54.1% equities in our 401(k)s, IRAs, and Brokerage accounts,
- 3.4% fixed income in our “cash bucket“,
- 11.9% real estate (private equity multi-family housing investments, excluding our primary residence).
Does this mean that I have essentially 85% equities, 3% bonds, and 12% real estate? Isn’t that a bit risky when I normally preach that we need more diversified portfolios in retirement? Probably not. I would never view the IB account as a 100% equity portfolio equivalent. I’d never recommended a portfolio with 96.6% risky assets and only 3.4% safe assets. I certainly recommend people taking more risk on the path to retirement (see my post on pre-retirement glidepaths) but once retired you should not gamble with your nest egg like that! Since I already have so much of the portfolio locked into risky assets I am looking for a much safer allocation in my IB account.
Then how would I do the “accounting” right? I propose the following methodology. I run a factor model on my portfolio returns since 2014, i.e., I like to see what kind of factor exposures (“betas”) I pick up when I regress my IB account returns on three factors: monthly stock, bond, and cash returns. Doing so, I find that my IB portfolio behaved like a portfolio with Stock/Bond/Cash weights of 31%/38%/31% and an annualized “alpha” (= excess return) of 9.1%. All betas and even the alpha are highly statistically significant with t-stats ranging between 3.4 and 7.5.
If I apply those weights to the 30.6% in the IB portfolio I now get the following overall portfolio weights, see below. Lo and behold, my overall weights are now indeed around 75.5% risky assets (equities plus real estate) and 24.5% safe assets (bonds and short-term instruments). We can also take out the real estate portion and look at the financial assets only, where the split is about 72% stocks, 17% bonds, and 11% short-term safe assets. All right in line with my safe withdrawal rate work, where I’d normally recommend a 75% Stocks/25% Bonds portfolio for most retirees.

3: Calculating Intraday Options Greeks
We had a discussion a while ago about how Interactive Brokers calculates (miscalculates?) their option metrics. People asked me how I do my greek calculations and
Let me outline how I calculate my personal option metrics, specifically, the implied volatility and the option Delta, so I don’t have to rely on the potentially faulty IB figures.
Before we even get into my intraday option pricing model, let me go through how I deal with the accounting of trading days. I have a slightly different approach even for the calendar day accounting in the options pricing formula. I don’t consider a weekend a full 3-day time window. Very clearly, much more can happen between a Tuesday and a Friday close than between a Friday to Monday close. In the former case, we have three full days of economic and financial news released in between while in the latter we have a (mostly) calm weekend and only the Monday news releases. My solution: I assume that a Friday Close to Monday Close is the equivalent of 1.5x of an intra-week trading day. That leaves us with 5.5 “units” every calendar week. Scale that up to 5.5 units times 365.25 average calendar days per year divided by 7 days per week and we arrive at 287. Then subtract the 9 market holidays from that and we end up with 278 effective trading units per calendar year. Not the 250 to 262 trading days floating around you see elsewhere but a little bit more because of the 1.5x scaling over the weekend.
We can now calculate the time input (T) in the option pricing formulas (normally expressed in years). For example, a weekday closing to the next closing is 1/278 years. A Monday closing to Wednesday closing is 2/278 years. A Friday closing to Monday closing is 1.5/278 years. A Thursday closing to Monday Closing is 2.5/278 years. A Friday closing to Tuesday closing when Monday is a holiday and market holiday is still only 1.5/278. You will notice that this kind of accounting for calendar days creates potentially very different inputs for the options pricing formula where we normally have to specify the time to expiration measured in years. For example, a single trading day intra-week is 31.3% longer using my formula than the naive 1/365. In contrast, going from Friday to Monday my T value is 34.4% shorter than using the 3/365 formula.

Next, I go through the intra-day accounting. My assumption here is pretty simple: The time between the open (9:30 a.m. Eastern Time) and the close (1:00 p.m. Eastern Time) accounts for exactly 0.5 units with linear interpolation in between, implying that the close-to-open accounts to the other half of a trading day “unit”. (Side note: If I wanted to be really precise, I’d likely need to raise that value for the open-to-close to a bit above 0.5, because there’s more vol between the open and close than between the previous day’s close and the current day open. This is strange because most economic news comes out before the bell and a lot of earnings announcements come out after the bell. But in any case, 0.5 seems to do the trick all right for now. I will let you know if I ever tweak that number).
So, if I sell a Wednesday option on Monday at 1 hour before close, I account for this as 0.5*1.00/6.50 units for the intraday portion on Monday plus another 2 units for the M->W close. That’s 2.0769 units or 2.0769/278=0.0074709 years to be used in the standard options pricing formulas, e.g., from the options pricing Excel plugin in the awesome Whaley book (paid link).
What to make of those IB Delta figures now? I haven’t done any careful research yet as to why exactly the IB estimates are off by so much. Sometimes I compute a 3 Delta when IB quotes me a 2 Delta. What I found intriguing is that their Implied Volatility (IV) estimate is roughly the same as mine, while the Delta is very different. If they merely used a different T input, say, due to different accounting for the weekend and the intraday trading, we’d actually observe the opposite pattern: the IB estimate for IV would be very different but the Delta would be not that far off. So, there has to be another reason to account for the whacky IB Delta estimates. If anyone has any insights, please let me know!
4: Less leverage, more Delta per option
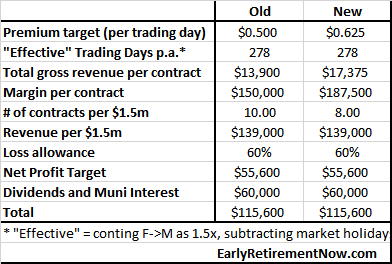
Over the last few weeks and months, I’ve applied one more tweak to my options trading. I’m trading fewer puts but at a slightly higher risk level (Delta) than before. The overall option income and Delta should stay about the same but I’m just using fewer contracts and thus less leverage. The idea behind this is that I like to scale down the risk a little bit. Because the S&P has staged such an impressive run – up more than 100% since the pandemic low! – I like to reduce the risk per contract a bit. For example, previously I had budgeted around $150k in margin per contract. lowering the number of contracts by 20% and raising the margin per contract by 25% ($150k*1.25=$187,500) will leave the expected revenue the same, but with significantly lower tail risk. For example, if you assume a strike at 4,400 then your notional exposure of a short put is $440k (using the CBOE SPX index options with a 100x multiplier). With only $150k in margin cash that’s 2.93x leverage. I routinely ran that kind of leverage, even a bit more while still working. But now that the IB account is 30+% of our portfolio and I’m (for the most part) out of the workforce, I like to have less leverage.
What does that all mean for the strategy? Instead of targeting a $0.50 premium per day, i.e., $1.00 for the M->W and W->F trade and $0.75 for a trade over the weekend, I simply up that all by 25% in exchange for a 20% reduction of the number of contracts.
Of course, you don’t get to lower your risk for free. The fact that I’m still generating the same gross revenue with less leverage merely means that I am increasing my put strikes and thus I would get a higher probability of moderate losses in exchange for less severe tail risk. Seems like a good trade considering that I have to pay the bills from this account.
So much for today! Please leave your comments and suggestions below!
Please check out the Options Trading Landing Page for other parts of this series.
Title Picture credit: pixabay.com
While researching Interactive Brokers, came across something called an “exposure fee”. Further reading suggests naked option positions greatly increase the odds of triggering it. Has anyone had issues with this?
Yes. If you have too many open contracts and a “hypothetical” 30% loss in the S&P overnight would wipe out your account then IB charges you a fee. Shouldn’t impact you if you use low enough leverage.
With the “new” 1DTE SPX options, are you still targeting ~0.05 delta, or focused more on the TMV %? For example looking today 7/5 at options expiring tomorrow 7/6, ~5% TMV has only ~-0.015 delta. Just curious how to adjust this strategy when switching from MWF options to daily option expiries.
It just works out closer to -0.015 to -0.02 Delta. Correct.
Hi BigERN, I’ve been running this strategy for a while now but as I start to think through how it might factor into my income during retirement, I began to wonder: how do the option premiums change with inflation (since all of our SWR calcs assume that we will need to adjust our withdrawals for inflation each year)? Inflation doesn’t seem to be explicitly captured in the Black Scholes formula, but it seems reasonable to think that an efficient market would account for this – ie, people would stop selling puts if the purchasing power of the premium didn’t offset the risk they were taking, right? It does seem like as interest rates rise, put premiums will decrease, which is not encouraging though maybe the effect is negligible? For the fixed income portion of the portfolio, using floating rate preferreds definitely helps – do we just hope that portion will make up for lower premiums? (By the way, any idea what happens to floating rates when LIBOR goes away next year?)
Ern will certainly have a well thought out answer to that, but I will take a stab… Option premiums do account for interest rate changes. The greek symbol for this is rho. In the 0-3 DTE variety, rho is very small, but for things like LEAPs, rho can be more meaningful. So as interest rates rise, put premiums actually INCREASE. The party selling insurance for some point in the future needs to be compensated for time value of money, and that compensation increases as interest rates rise.
Rho is negative for put prices. You can see that from the BS equation or the lower bound: P=K^exp(-rt)-S. So increasing r lowers the present value of the strike price and so the put premium.
Correct. But a small effect for this particular strategy.
Very good reply. Rho is small for my short-dated contracts. I do factor in the risk-free rate in my calculations for IV, Delta, Gamma. I update it every time there’s an FOMC meeting and interest rate change. But I also notice that the impact is small.
The risk-free interest rate enters the Black Scholes formula. The interest rate responds to inflation.
For 1DTE contracts the interest rate doesn’t make a big difference, though.
Aside from that: All my option income is in addition to the rest of the portfolio because options are traded on margin. You’d hope that the rest of the portfolio keeps up with inflation. So your option strategy should be:
Inflation + portfolio-real-return + options income.
Because of that I don;t think that the options shorting strategy should not respond to inflation.
Hi BigERN,
In your table in Section 4 (old vs new), does $1.5m represent the account value or only the amount available to use as margin (meaning the account size would be closer to 1.5m*1.25=1.87m since you hold most of it in assets that allow you to use 75% of the asset value as margin)? And which one of those numbers (margin cash or total account value) do you use when calculating your leverage?
I had been calculating leverage = notional / total account value, which for me is ~2.6x most of the time but in order to get this much leverage I am holding much more than I’d like in cash (>15% of account value). Otherwise I end up bumping up against margin requirements during that 5 min pre-close when I am technically holding twice as many puts (those about to expire + those I just sold). Now granted, my broker only allows me to use 70% of my asset value as margin, but I’m struggling to sort out how you managed to run this strategy with 3-3.5x leverage and only hold 5-7% in cash and still have so much in excess of the margin requirements. But now I’m wondering I’ve been underestimating my leverage amount — if I calculate leverage as notional / margin cash then I would actually be at closer to 3.5x leverage. Any insights?
By the way, I tried signing up for the new forum but got sent round in circles with WordPress and was never able to create an account. Not sure if others have reported similar problems?
AC
$1.5m was the account value at that time. And yes, that’s exactly how I calculate my leverage ratio.
About the forum. Here’s the comment of someone who successfully signed up:
“I had similar issue with the new Forum. I created a new WP account, and added / Subscribed to ERN website inside the Settings of the WP account just created. It took 1 or 2 days for the new WP account to post on the new forum. You can also do the usual debug steps: Delete Cache, Restart computer, Log in.
Good luck!”
Thanks, BigERN! I’ll try the method you shared re the forum (fingers crossed!).