


Update: We posted the results from parts 1 through 8 as a Social Science Research Network (SSRN) working paper in pdf format:
Safe Withdrawal Rates: A Guide for Early Retirees (SSRN WP#2920322)
Welcome back to the Safe Withdrawal Rate Series. Last week we wrote about how Social Security can impact the SWR estimates. Even under the most optimistic assumption (no changes to the Social Security benefits formula), we didn’t think that the 4% withdrawal rate is safe.
But how about tinkering with the inflation adjustments, also called Cost-of-Living adjustments (COLA)? I often hear that one way to save the 4% rule in periods when the stock market doesn’t cooperate is to not do inflation adjustments for a few years. Or simply utilize the fact that we all potentially spend less (in real terms) as we age! How much can we push the initial withdrawal rate in that case?


COLA – How not to do it
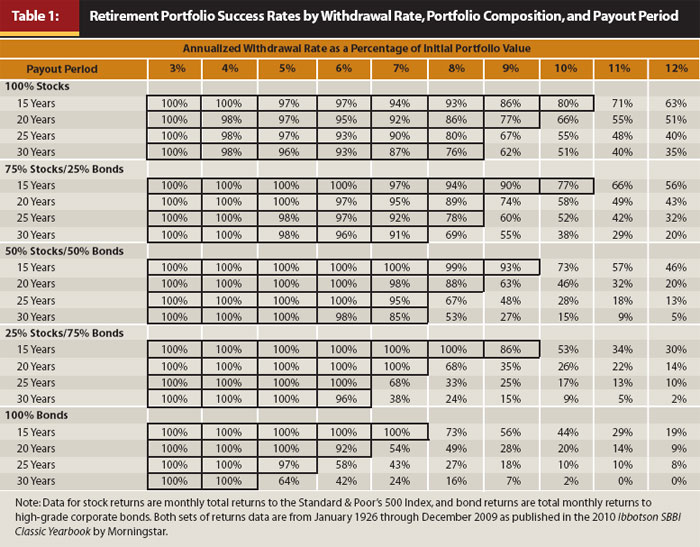
The first table in the often cited Trinity Study, apparently the gold standard of retirement research, looks at the success rates of withdrawal strategies that don’t do the cost-of-living adjustments (i.e., keep nominal withdrawals constant):
http://resource.fpanet.org/resource/FDBB107D-1D09-67A1-AC1A61924F8CAAF5/Cooley-Table-1.jpg
Source: Trinity Study (https://www.onefpa.org/journal/Pages/Portfolio%20Success%20Rates%20Where%20to%20Draw%20the%20Line.aspx)
That seems like an interesting exercise to do before jumping into the inflation-adjusted study, right? Wrong! To me, this is a pretty cringeworthy and nonsensical exercise for the following reason. See the chart below where we plot the purchasing power of an initial withdrawal of $40,000 p.a. over 10, 20, 30, and 60 years when foregoing CPI-adjustments:


Not doing inflation adjustments during the 1970s would have implied a massive erosion of purchasing power: Your initial $40,000 withdrawal in 1970 dollars would have been worth only around $8,000 in the year 2000. Not quite a Zimbabwe-style runaway inflation, but still pretty bad. Good luck living your golden years on that amount! On the other hand, in the 1930s you would have massively increased your CPI-adjusted consumption in a deeply deflationary decade. So, that retiree would have fared much better (in real consumption terms, not in final value). Lumping them all together and calculating success rates is not very meaningful then. It’s comparing apples and oranges! Sorry to say this, but in my eyes, anybody who looks at safe withdrawal rates in purely nominal terms suffers some serious loss of credibility. It proves that even the combined brainpower of 3 PhDs can create some junk science.
COLA – How to do it right
If we want to make the case that people consume less as they age, we should still do the calculations in real space but then shrink the expenses at a certain (real) rate per year, as we propose here. Essentially, chip away a small percentage of the purchasing power every year to account for the fact that we could potentially consume less over time. How much should we shrink consumption (and thus withdrawals) over time? Let’s look at what happens when we do the COLA adjustments as CPI minus x% for several different values of x, see table below.


After 60 years even a tiny value of x will erode our purchasing power by a lot. Personally, we might still be comfortable with 0.5% (around 26% erosion of purchasing power) but certainly not 1.0%. For retirees with a very high initial withdrawal amount, say, $100,000 p.a. it might be possible to go all the way up to x=1%, because that would cut down the real withdrawals to a still-generous $54,720. But does anybody want to start at $40,000 at age 30 and shrink the withdrawals to slightly less than $22,000 at age 90? That will be eaten up by medical bills alone. And forget about going to 1.5% or more. So we will study only the 0.5% and 1.0% versions, in addition to the baseline:
- Baseline: Increase withdrawals in line with CPI
- COLA=CPI-1.0%: Shrink the real withdrawals by 1.0% p.a.
- COLA=CPI-0.5%: Shrink the real withdrawals by 0.5% p.a.
We also throw in another two scenarios of tinkering with the withdrawal amounts over time:
- 5Y-no-COLA: shrink the real withdrawals by 2% for five years and hold them constant after that. Starting in year 6 this would mean that the withdrawals are about 9.6% lower than initially (0.98^5=0.904). That’s the solution often quoted as the panacea to bad market returns early on: simply forego the inflation adjustments for a while. Assuming 2% inflation forecasts over the foreseeable future, this withdrawal pattern would exactly accomplish that. Also, notice we never scale the withdrawal up again. Then a 4% initial withdrawal would mean you consume only about 3.6% of the initial net worth in the long-term.
- 5Y transition 75%-100%: Somewhat the opposite of assumption above; gradually smooth into retirement, for example, by preserving some small income source initially and phasing it out over 5 years, or by simply being extremely frugal initially. Withdraw only 0.75 times the long-term target in year 1, 80% in year 2, …, 95% in year 5 and then the long-term target in year 6 and onward. Also notice that if this procedure yields a, say, 3.5% SWR in the simulations, the initial withdrawal rate would only be 2.625% of the initial net worth and we’d scale that ratio up to 3.5% over the next five years.
See chart below for the scaling of withdrawals in real dollars, compared to $100 in the baseline:


Simulation results
As we did last week with the different Social Security assumptions, let’s look at the median increase in the withdrawal rate that the withdrawal pattern affords us, see table below. We calculate this again for all months, for months with the CAPE between 20 and 30 and for months with the CAPE in that range and the baseline SWR<4%. Quite intriguingly, for the first two assumptions you roughly increase the initial withdrawal rate by exactly the 1.0% or 0.5% rate adjustment to the COLA (+0.932% and +0.462%, respectively) when we take the median of all months. But that advantage quickly melts down to only about three-quarters of that amount when taking the median over only the current CAPE regime (20 to 30) and about half when the CAPE is elevated and the baseline 4% rule would have failed (0.558% and 0.275%, respectively). So, the unpleasant fact is that the COLA-x% works best when we need it the least. That makes perfect sense: because we have such a front-loaded consumption pattern we get hit by the dreaded Sequence of Return Risk!


We get qualitatively similar results with the other two withdrawal patterns. The 5Y-no-COLA adds about a half percentage point (0.519%) to the withdrawals (before taking it away again over the next 5 years!!!) and the 5Y smooth transition into retirement boasts a respectable quarter point increase in the median increase of the SWR (0.244%). But the bump in allowable SWRs melts away again when we take into account today’s high CAPE value and even more when we look at the retirement dates with low enough initial returns that pushed the baseline SWR below 4%. Not a pretty picture.
Next comes a similar table to last week’s; let’s look at the failure probabilities over different initial withdrawal rates, see below. The top part of the table is for today’s CAPE regime. None of the alternative withdrawal patterns offer a failure probability good enough to justify the 4% rule. OK, maybe the CPI-1.0%, where we would push the failure rate to slightly below 10%, but as we said before that would be a bit too aggressive of a cut in consumption for our taste. All other withdrawal patterns still have failure probabilities around 20%, which is completely unacceptable for us.


What the table seems to indicate is that you might gain a 0.25% increase in the SWR for the less aggressive withdrawal rules and 0.50% for the CPI-1.0% rule. In other words, the 3.25% SWR has a 3.1% failure rate in the baseline scenario and with COLA-1.0% we can push all the way to 3.75% SWR to still keep the failure probability in the low single digits. For the other withdrawal patterns, we’re talking 3.50% again, so that’s roughly a quarter point improvement
Why 100% equities?
Why did we use a 100% equity share in the simulations above? It goes back to the earlier findings in the previous parts of the SWR series (especially part 2 and part 3): The success probabilities mostly go up with the equity weight, at least over a 60-year horizon. The only time that’s not true is when right at the start of retirement stocks are seriously overvalued (CAPE>30). But for completeness, we again display the success probabilities over different equity weights, see chart below for a 4% withdrawal rate. The top chart is for all CAPE ratios and the bottom for the CAPE between 20 and 30 (current CAPE is around 28). We confirm again that the success probabilities are almost monotonically increasing in the equity weight:


And the same chart for a 3.5% withdrawal rate. There is again a plateau of 100% (or close to 100%) success rate for high enough equity shares, and that’s true even for slightly overvalued equities (CAPE between 20 and 30). It looks like the sweet spot for less than 100% that exists over 30 years doesn’t carry over to 60 years. It’s the same curse of low bond returns we’ve talked about in the past.


Why we won’t bet on COLA
We did this study about tinkering with the COLA anticipating that probably a lot of folks will ask for it. Personally, we don’t plan to mess around with our COLA and the lifecycle spending amounts very much. The little bit of gain in the initial withdrawal rate is not worth the potential for spending cuts later in life when we are least able to earn a supplemental income.
But isn’t it true that people spend less as they age? Yes, that’s what economists have shown but I would ask back: Do people spend less because they want to or because the have to? Our blogging friend Fritz at Retirement Manifesto had a great post the other day about how woefully unprepared Americans are when it comes to retirement savings. There is some evidence that people spend less in retirement because they have to: Social Security benefits are pretty modest and even adding other supplemental income from retirement savings and annuities, pensions, etc. leaves most retirees still far below the earnings potential of the median household in the 50-65-year age range.
If I were to adjust the lifecycle spending pattern at all, I’d probably raise my old-age consumption. We might travel less, but likely prefer to travel in more comfort and at a higher cost. There will be less backpacking and more cruise vacations after I reach age 60! Moreover, we will certainly have higher health expenditures than today. And on healthcare, it’s a double whammy: higher expenses when we get old and likely less help from the government than even today’s retirees are used to. So, in our personal spreadsheet of spending plans, I currently have a scenario where I bump up withdrawals to more than CPI rates after age 70 exactly for that reason. Another reason not to rely on the 4% rule.