


Update: We posted the results from parts 1 through 8 as a Social Science Research Network (SSRN) working paper in pdf format:
Safe Withdrawal Rates: A Guide for Early Retirees (SSRN WP#2920322)
If you’ve been following our series on withdrawal rates (part 1 here) you have noticed that we’re quite skeptical about the 4% rule. That would be especially true for early retirees with a much longer horizon than the standard 30 years. Though, by reading through some of the research from the heavy hitters in the retirement research world, even the foundation of the 4% rule over 30 years seems to be crumbling a little bit:
- Wade Pfau has been warning that due to high equity valuation and low bond yields the Trinity Study success rates are likely overrated. His argument is similar to ours in Part 3 of this series: we live in a low return world now and comparisons with past average returns could overstate the success probability of the 4% rule. He uses a slightly different methodology (Monte Carlo simulations) but reaches similar results.
- Even Michael Kitces, arguably one of the great defenders of the 4% rule, has (inadvertently?) demonstrated that the 4% rule over 30 years isn’t all that sound. In the discussion after the famous “ratcheting post,” some readers (including yours truly) pointed out that we can’t replicate the success of the 4% rule with 1965/66 starting dates. Nothing to worry about, Kitces replied, all you needed to do is to use a very short-term bond (1-year T-bills) for the bond allocation, and you sail smoothly during the 1970s. Who would put 40% of the portfolio into 1-year Treasury bills (essentially CD interest rate) rather than trying to harvest the term premium of longer-term bonds? Very easy: someone with 20/20 perfect hindsight who knew that longer duration 10Y bonds will get hammered in the 70s and sink the 4% rule even over a 30-year horizon.
And I just became a little bit more skeptical about the 4% rule even over a 30-year horizon! But there is (at least) one prominent 4% SWR firewall still standing. In countless blog posts, discussions, forums etc. I have heard this quote (or variations of it):
“The 4% rule worked just fine during the Tech Bubble and Global Financial Crisis”
Let’s shine some light on that claim.
Real Returns 12/31/1999-12/31/2016
The first suspicions about the validity of that claim came when I looked at the average returns in equities and bonds since December 31, 1999, and they didn’t look so appealing. Equities (S&P500, dividends reinvested) returned only slightly more than 4% p.a. in nominal (!) terms, and 2.36% p.a. in real, CPI-adjusted terms. How can that justify a 4% withdrawal rate? Isn’t the real portfolio return supposed to be roughly equal to the real rate of return to make this work? Below we plot the cumulative returns (before even withdrawing anything!) of different Equity/Bond portfolio mixes, adjusted for inflation.


Note, these are already the returns taking out 0.05% p.a. in ETF expense ratios, hence, the 100% equity portfolio return dropped from 2.36% to 2.31%. None of these portfolios would have stayed even close to a 4% real return target over time. Every month and every year we stay below that black line we dig deeper into the principal. When someone wants to tell me that the 4% did well since 2000, that doesn’t even pass the smell test.
ERN Simulations
So, without simulating anything I already know that the 4% rule would not have fared very well and you would have wiped out some portion of your principal. How much? Well, let’s run the ERN simulations and see for ourselves. Since we started this series I updated the realized returns all the way to December 2016 (Parts 1 through part 5 used realized returns only up to 9/30/2016). Let’s see how the 4% rule would have performed under different portfolio allocation assumptions. We also took the liberty to extend the equity and bond returns beyond the first 17 years. As described in our initial SWR post, we assume that future real equity returns are equal to the average real return since 1871 (about 6.6% p.a.). We now assume that the bond return is going to be equal to the 12/31/2016 10Y nominal bond yield (around 2.5%) minus 2% inflation = 0.5% p.a. real for the next 10 years, then also returning to its long-term average of 2.6% real.
Side note: That’s actually a pretty aggressive estimate for future returns given that the CAPE is so high! Recall our post from last year, where we plotted the current CAPE earnings yield (=1/CAPE) vs 10-year forward equity returns: If the CAPE is above 25 (yield <4%) the 10Y forward equity return never exceeded the 6.6% mean real return, see chart below!


Below is a time series chart of the real portfolio value over time for different equity portfolio shares between 50% and 100%. A portfolio would have taken a serious hit after 17 years: In real terms, the portfolio is down by anywhere between 30% and 75%.


But can the portfolio recover? Well, of course, it can if stocks go up by between 50% and 300% in the next year. But even the somewhat optimistic assumption of 6.6% real equity returns over the next 13 years will only further deplete the portfolio, see the downward-sloping portfolio values starting in 2017.
Next, we can also calculate the SWRs that would have exactly matched a specific final value target after 30 years. Again, that’s using the 17 years of actual return data plus the 13 years of return forecast. See chart below:


In January 2000, you could have withdrawn 4% or more if you weren’t too aggressive on the equity allocation and you’re OK with running out of money after exactly 30 years. 4% probably wasn’t such a bad assumption for regular retirees who were 65 years old in 2000. But early retirees? You probably want to ensure that you have about 75-100% of the initial principal available half-way through your retirement. Depending on the equity weight, 2.6-3.1% for capital preservation and 2.9-3.5% for 75% capital preservation was all you could start withdrawing in 2000. And that’s under the somewhat rosy assumption of 6.6% real equity returns for the next 13 years (despite elevated CAPE ratios) and zero volatility along the way. Not a pretty picture! If anything, the 2000-2016 episode was a worst-case scenario for early retirees. Quite the opposite of the “4% rule did OK” myth.
Welcome to the Potemkin Retirement Village: Successfully using the 4% Rule since January 2000!
So, how can one still claim that the 4% rule is A-OK after 2000? We’d have to be deceived by a financial Potemkin Village. I gathered some examples below:
Potemkin Village #1: Michael Kitces’ post on the topic
Just to be clear, I am not saying that Kitces wants to deceive anybody in his post on the 4% rule post-2000. He’s obviously an extremely smart guy and puts out very fascinating material. I also found that he’s very kind and gracious in replying to questions and requests.
But his post on the matter is still a Potemkin Village. All the pertinent information is in that post. It’s all 100% accurate, completely confirmed by yours truly. Everybody who wants to get an objective picture of the 4% rule in the 2000-2015 period will walk away with the exact same information that I saw:
- The 4% rule worked probably all right for the average 65-year-old who retired in 2000. That person may make it through to 2030, especially considering that the person is now 82 years old and may curb consumption a little bit, in line with losing almost 40% of the real portfolio value. Not so much, though, if there are medical bills piling up and withdrawals actually grow faster than CPI!
- But the average early retiree would have trouble making the 4% rule work. By 12/31/2016, only 17 years into the retirement you would have wiped out a big chunk of the portfolio as we show in our calculations above and even then you have to cross your fingers and hope for above average equity returns, something unprecedented when the CAPE is at 28. Good luck with that!
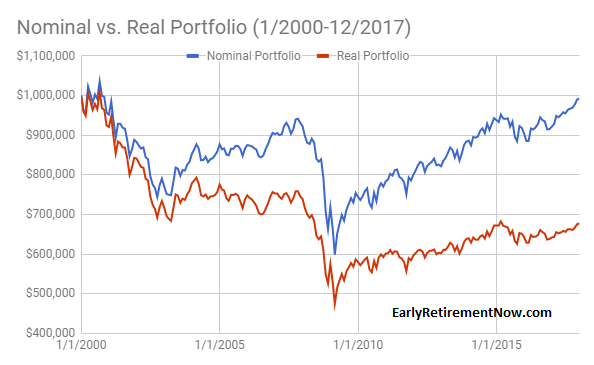
But how about folks who don’t want to see the faults in the 4% rule? Say, someone who has a predetermined conclusion that the 4% rule worked great in 2000 even for early retirees. If that person reads the Kitces article he/she will come to the exact opposite conclusion. See the following chart, here reprinted with permission:


Kitces used a 60/40 Stock/Bond mix and now it looks like the year 2000 cohort is back to maybe $930,000. Doesn’t look so bad, right? That proves the 4% succeeded during that time! Not so fast: read the fine print! This is the nominal value. $930,000 in nominal terms means that the real value is down to somewhere in the low $600,000s, consistent with our calculations.
Also, right after the Kitces post (July 2015) the portfolio value is trending down, see our time series chart above. Recall, that our calculations take into account the pretty impressive 2016 equity return (12% with dividends!) and we’re still continuously melting away our principal! That’s because the 4% withdrawal rate has now grown to a 5.7% to 16% withdrawal rate (depending on the equity share). Remember, there’s only between 25 and 70% of the portfolio left, so the withdrawals are now higher relative to the principal (4%/0.7=5.7%, 4%/0.25=16%). You will eat into the principal even more during the remaining 13 years (and we are not even taking into account equity volatility and Sequence of Return Risk). It may all still work out for the traditional retiree with 13 years to go, but not for the early retiree with 40+ years to go.
Update 2/27/2018
I ran the simulations all the way to the end of 2017. Now the nominal value is almost back to $1,000,000! But the real value is still depressed at less than $700,000 and below the peak in early 2015. Despite the impressive equity performance in 2016 and 2017!

Potemkin Village #2: The Stock/Bond Allocation
Recall the “ratcheting post” from Kitces, written in June 2015? Compare that to the post about the 4% during the post-2000 period, written only a few weeks after that, and you will notice one subtle difference:
- In the ratcheting post, the 4% rule worked during the 1970s because the 40% bond allocation was invested in short-term bonds (1-year T-bills).
- In the post on the dot-com bubble and global financial crisis, Kitces uses a 10-year Treasury bond.
If you had followed the advice from the ratcheting post and invested in 40% short-term bonds starting in 2000 you would have lost the beautiful diversification benefit of bonds and you would have missed out on the big bond rally. The nominal portfolio value would have gone down to just under $500,000 in nominal dollars and below $350,000 in real, CPI-adjusted dollars by December 31, 2016. Good luck making that money last until even 2025. If you haven’t cut your consumption yet, the annualized rate of withdrawal would be almost 12% now. To bring back the withdrawal rate to a more manageable 4% we’d have to cut withdrawals by about two thirds!
I wonder if all those who tout the 4% rule as so safe realize that in the most optimistic interpretation it will involve timing the bond vs. cash allocation. Better get your term premium model up and running, everybody! And the worst possible interpretation is that the success of the 4% rule is based on some pretty blatant data snooping and hindsight bias, even for the traditional retiree with a 30-year horizon.
Potemkin Village #3: The Trinity Study
Strictly speaking, the Trinity Study indeed covers the DotCom bust and the Global Financial Crisis. And it shows that the 4% rule is safe. But only towards the end of their 30-year windows. To my knowledge, the most recent installment of the study is from April 2011 with data covering 1926-2009. Therefore, we don’t have any data about the year 2000 retirement cohort yet. Strictly speaking, it will take until December 31, 2029, to get word from the Trinity Study about whether the 4% rule worked with the January 2000 starting date. What if that cohort already runs out of money in 2025? We show that is a real possibility unless stocks return more than their historical average going forward. Will the Trinity Study still be quoted as the defender of the 4% rule for the early 2000s until they actually confirm it didn’t work?
Summary
The often quoted statement above needs a few important qualifiers for us to agree with it:
The 4% rule worked just fine during the Tech Bubble and Global Financial Crisis IF:
- You have a 30-year retirement horizon.
- You are comfortable depleting your money at the end of that horizon and/or significantly cutting your real withdrawal amounts.
- You had a relatively low equity portion (60% or less).
- You are not a passive investor but rather have the foresight to time long-term vs. short-term bonds. Specifically, you needed the ability (or dumb luck?) to implement the exact allocation that didn’t work in 1965/66 and avoid the allocation that did actually work quite beautifully in 1965/66.
- Did we miss any other qualifiers? Please let us know in the comments section!