


Welcome back to our series on Safe Withdrawal Rates. This is already the 17th installment! See Part 1 here and make sure you also check out the Social Science Research Network Working Paper we posted on the topic, now with 2,000+ downloads!
In any case, if you have followed the series so far you must have noticed that we are no fans of the 4% Rule and much of what we posted here dealt with the “4%” portion of the 4% Rule. For example, in Part 3 of this series we show that when equities are as expensive as today (Shiller CAPE > 20), failure rates of the 4% Rule have been unacceptably high in historical simulations.
But I think I missed this really important point:
The only thing more offensive than the “4%” part is the word “Rule”
That’s because the word “Rule” makes it sound as though the 4% is some sort of a scientific or mathematical constant. But it’s not. It ain’t scripture either, even though it’s often portrayed that way! There is no one-size-fits-all solution for withdrawals in retirement. With today’s lofty equity valuations and measly bond yields, a 3.25% to 3.50% initial withdrawal rate would be much more prudent. But there is another element that creates just as much variation in SWRs: Different assumptions about Social Security and/or pension benefits: The benefit level, the number of years before benefits kick in, how much of a haircut you want to assign to account for the risk of potential future benefit cuts, etc. and they all create so much variation in personal SWRs that the whole notion of a safe withdrawal rate “Rule” is even more absurd. The 4% Rule should be called the 4% Rule of Thumb because 4% is merely a starting point:
SWR = 4% Rule of Thumb
+/- adjustments for equity/bond valuations
+/- adjustments for idiosyncratic factors, e.g. age, Social Security, pensions, etc.
How much of a difference do these idiosyncratic/personal factors make? A huge difference! A prime example is the case study I worked on over at the ChooseFI podcast: a couple in their early 50s expects pretty generous Social Security benefits after a long career and probably wouldn’t have to worry too much about future benefit cuts. If they both wait until age 70 to claim benefits and are able to reduce their withdrawals from their portfolio dollar for dollar once Social Security kicks in, their Safe Withdrawal Rate estimate goes up from a measly 3.5% to somewhere around 4.5% or even 4.75%. Instead of saving 28.6x annual expenses, they’d need only 22.2x or even 21.1x. That’s a difference of several $100k!
How to quickly and easily gauge the impact of future cash flows from Social Security or pensions on the SWR is the topic of today’s post!
How do we translate future benefits into today’s SWRs?
OK, if you’re not a math wonk you might want to skip to the next section. But for the mathematically inclined, those who didn’t unsubscribe from our email list after the Technical Appendix in Part 8, recall that the safe withdrawal rate can be expressed as:


The terms Ct are used to calculate the opportunity costs of taking withdrawals at different times, please refer to technical appendix for more details. So, it turns out that the impact from future cash flows on the SWR enters linearly into the SWR formula. If a future benefit of X translates into an increase in the SWR by Y, then 2 times X will increase the SWR by 2 times Y. That’s very convenient! All we need to calculate is how, say, a $10,000 future benefit (with inflation adjustments) impacts the SWR of a $1,000,000 portfolio and we can easily scale up/down the numbers for $20,000 or $30,000 benefits. Or $23,456 in benefits for a $1,987,654 portfolio.
Also, quite amazingly, the impact on the SWR is independent of the targeted final asset value (FV). Of course, FV enters the formula for the SWR but the two terms for FV and supplemental cash flows are completely separate and additive. How cool is that???


Introducing: Big ERN’s cash flow translation tool
Let’s use the above formula to calculate the potential marginal impact on the SWR of an additional annual cash flow worth 1% of the current portfolio.
- Cash Flows start at between zero and 40 years after the retirement date, in 5-year steps.
- Cash Flows are adjusted for inflation (though, we will also calculate a table for non-COLA cash flows below).
- Retirement horizons are 40, 50, or 60 years.
- Equity Allocations are 60%, 80%, or 100% in an S&P500 index fund, the remainder in 10Y U.S. Treasury bonds, e.g., the iShares IEF ETF.
- Since I want to get a feel for the range of possible outcomes I calculate the minimum, median and maximum SWR impact over the simulation windows from 1871 to 2015. Please refer to Part 1 of this series for more details on the historical simulations.
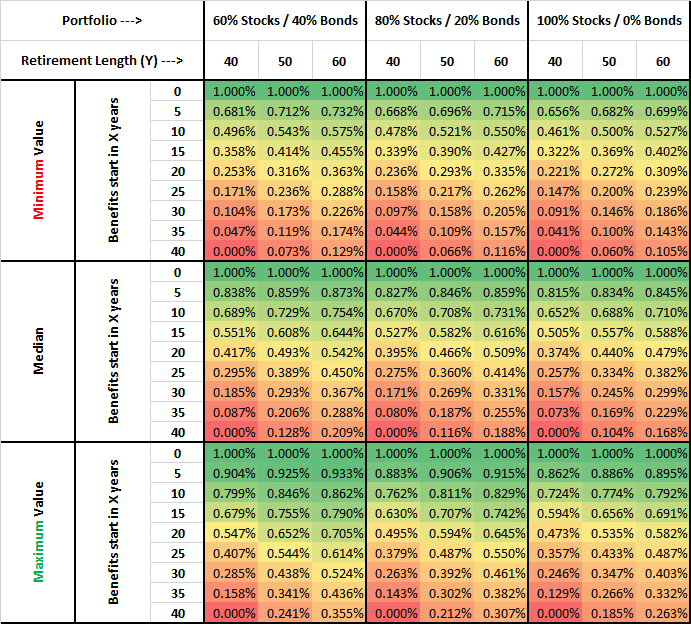
The results are displayed in the table below. A few observations:
- If benefits start in year zero you can raise your consumption level by exactly 1%. Makes sense because the supplemental cash flow is adjusted for CPI just like your withdrawals. Technically speaking you don’t really raise your SWR from the portfolio but you raise your sustainable consumption level one for one with the additional cash flows.
- The longer you delay your benefits the smaller the impact on the SWR. In the extreme case where the retirement horizon is 40 years and benefits start in 40 years (month 481 to be precise), you get zero impact on the SWR!
- There is a small but still noticeable impact from the asset allocation. The higher the equity share the lower the impact on the supplemental cash flows. Makes sense because what we do in the SWR formula above is to discount future cash flows by cumulative portfolio returns. Since returns are higher on average with a higher equity weight we discount future benefit flows with a higher rate.

How exactly do we use this tool? Let’s look at a few case studies:
Case Study 1:
- Retire at age 30. Portfolio $1m, 80% Stocks.
- Expect $15k p.a. Social Security (=1.5% of today’s Net Worth) at age 70, i.e., 40 years from now. This may seem low but keep in mind that people starting to receive benefits in the year 2057 will already be subject to substantial benefit cuts in Social Security.
- Retirement horizon 60 years.
- The impact on the SWR: Minimum: 0.174% (=0.116%x1.5). Median: 0.282% (=0.188%x1.5). Maximum: 0.461% (=0.307%x1.5).
Case Study 2:
- Retire at age 40. Portfolio $1m, 80% Stocks.
- Expect $25k p.a. Social Security (=2.5% of today’s Net Worth) at age 70, i.e., 30 years from now.
- Retirement horizon 50 years.
- The impact on the SWR: Minimum: 0.395% (=0.158%x2.5). Median: 0.673% (=0.269%x2.5). Maximum: 0.980% (=0.382%x2.5).
Case Study 3:
- Retire at age 50. Portfolio $1.4m, 60% Stocks.
- Expect $56k p.a. Social Security (=4.0% of today’s Net Worth) at age 70, i.e., 20 years from now.
- Retirement horizon 40 years. Not too different from the case study I did for ChooseFI, by the way.
- The impact on the SWR: Minimum: 1.012% (=0.253%x4.0). Median: 1.668% (=0.417%x4.0). Maximum: 2.188% (=0.547%x4.0).
Case Study 4 (close to the ERN family situation)
- Retire at age 44 (Big ERN) / age 35 (Mrs. ERN). Portfolio $3m, 80% stocks.
- Expect $24k in benefits at age 70 (in today’s dollars) = 0.80% of the initial portfolio . This already reflects a hefty haircut to the Social Security benefits.
- Retirement horizon 60 years (due to age difference and longevity in both families)
- Benefits start in 26 years, so we do a linear interpolation: 0.2 times the 30-year and 0.8 times the 25-year row: Minimum: 0.200% =0.8x(0.8×0.262%+0.20×0.205%). Median: 0.318%, Maximum 0.426%
Results so far: The range of the potential impact of Social Security is huge. Only around a quarter percentage point for the very young retiree. Combine that with the 3.25% SWR over a 60-year horizon given today’s high CAPE ratio and lo and behold you land at a 3.50% SWR, exactly the rate we prefer. Even for the ERN household with maximum benefits rolling in only 26 years after retirement, Social Security’s impact on the SWR is only around 0.2%-0.3% (being conservative we consider only the range between the lower end and the median of the historical simulations). That’s because the benefit level is still relatively small compared to the $3m portfolio target!
On the other hand, a couple where both spouses are in their early 50s and both expect substantial Social Security (especially compared to the moderate portfolio size) can expect a massive boost to their SWR (minimum of 1%, median over 1.6%!), see Case Study 3! That would put the SWR into the mid-4% range!
What if benefits are not adjusted for inflation?
Glad you asked! We can also do the same exercise with future cash flows that are not adjusted for inflation. This would be the case for many corporate pension plans and most annuities.


What I did in this table is to assume that the initial cash flow is again 1% of the initial portfolio value. But then, every month, we decay benefits by an estimated 2% p.a. inflation rate. Notice that even an immediate benefit of 1% of the portfolio value (e.g. an immediate annuity) translates into significantly less than 1% extra SWR. That’s because the benefit will slowly decay by 2% p.a. in real terms.


A simple example on how to use this table: A retiree has $1,200,000 portfolio today, expects $20,000 in 20 years from a company pension (in future dollars, not adjusted for inflation). The retirement horizon is 60 years, the portfolio allocation is 80/20.
- Step 1: At a 2% annual inflation rate the initial future benefit is $13,459 in today’s dollars, which equals roughly 1.122% of today’s portfolio value.
- Step 2: We look up the three values from the table: 0.247%, 0.376%, 0.456% and multiply with 1.122. So the impact on the SWR is between 0.277% and 0.511%. with the median at 0.422% over the 1871-2015 simulation period.
Conclusion
I’m not the Grinch who is against the 4% Rule all the time. Quite the contrary! If someone had retired around the market bottom in March of 2009, any withdrawal rate under 5% would have been crazy conservative considering how undervalued equities were back then. Moreover, even with today’s elevated CAPE ratio, I have recommended 4%, even close to 5% safe withdrawal rates for some case studies I performed! But that’s due to idiosyncratic factors. For the typical extremely early retiree in their late 20s or early 30s, Social Security benefits will have a negligible impact on the personal withdrawal rates. You are compounding three factors that all diminish the usefulness of Social Security:
- You have relatively few years of prime earnings, thus benefits will be lower.
- Benefits are far away in the future and have to be discounted more severely than for retirees in their 40s or 50s.
- There is more uncertainty about future benefit cuts the younger you are.
What I learned from the calculations here and from some of the case studies I have done (one at ChooseFI, one here on my blog, and another one coming next week) is that determining a safe withdrawal rate is more than pulling an arbitrary number from the web just because the Trinity Study or some FIRE bloggers say so. Instead, determining your SWR is a highly customized exercise! We don’t all wear the same shoe size, we don’t all wear the same clothes and we all have very different drawdown strategies, see the #drawdownstrategy initiative started by Fritz Gilbert and Physician on FIRE for a sample and our own ERN family retirement plan here. Then why should we all use the same withdrawal rate? We can certainly start with a 4% Rule of Thumb, but we have to be cognizant of macro-factors (equity valuations and bond yields) and, equally important, all the different idiosyncratic and personal parameters of the individual retiree. The path to wealth may be simple, but the withdrawal phase is much more complicated than many in the FIRE community want to admit!
And just for the record, even this customized SWR is just the starting point. In practice, of course, we’d have to revisit the withdrawal amounts, for example with a Guyton-Klinger or CAPE-based dynamic withdrawal method to temporarily scale up or down the withdrawals, if the market goes through a bull or bear market, respectively. See Part 9, Part 10 and Part 11 of this series for additional information.