


One of my favorite Mr. Money Mustache articles is the “Shockingly Simple Math” post. It details how frugality is able to slash the time it takes to reach Financial Independence (FI). That’s because for every additional dollar we save we reduce the time to FI in two ways: 1) we grow the portfolio faster when we save more and 2) we reduce the savings target in retirement by consuming less.
That got me thinking: Is the math really that simple? How sensitive is the savings horizon to different rates of returns? What happens if we use historical returns instead of one specific expected return assumption? How important is the asset allocation (stock vs. bond weights) on the path to early retirement? How much does the equity valuation regime (e.g. the initial CAPE ratio when starting to save) matter?
So, in typical Big ERN fashion, I take an ostensibly simple problem and make it more complicated!
Let’s get the computer warmed up and start calculating…
Simple Math: 5% real returns
Just to warm up, let’s quickly replicate the results from the MMM blog post. Like MMM, I use a 5% real (inflation-adjusted) annual return but I use monthly contributions, while MMM uses annual contributions. Just like MMM, I use 25 times annual consumption as the FI target. And, of course, I am fully aware that a 4% withdrawal rate might not work for everybody and all the time. As I have written before, we should view the 4% number merely as a rule of thumb, rather than a scientific constant!
Qualitatively, I get pretty much the same results, even slightly shorter savings horizons than MMM (by a fraction of a year) because regular monthly savings get you to FI a little faster! For savings rates around 5-15%, it will take many decades to reach FI but at around 50-65% savings rates, we can cut down the accumulation phase to somewhere between 10 and 16 years. That’s exactly the sweet spot: it’s still a manageable savings rate for many FIRE planners and a surprisingly short time horizon to FI!


Slightly more complicated math: What if we use different returns?
5% real returns isn’t necessarily a bad assumption. Over the very long-haul, equities returned 6.7% even after inflation, see our post on the history of equity returns. But of course, over any given decade, returns can be much higher or lower than that. In the bar chart below I use 2%, 5% and 8% annual real returns. I also use savings rates from 20%-95% (the 5-15% bars would have been so high and messed up the scale). How responsive is the path to FI? Well, it depends on the savings rate:
- Regular retirees with a low savings rate will face a large impact when we change the rate of return. Going from 5% to 2% could add a decade or more to the FI path!
- The higher your savings rate and thus the shorter the horizon to FI, the less susceptible the length of the FI path becomes. For example, at a 60% savings rate going from a 5% return to a 2% average return, the path to FI goes from 12.2 to 14.4 years. For some of the higher savings rates, the reduction of the return rate from 5% to 2% adds only about a year to the FI path!
That all makes perfect sense: early retirees with a very short horizon rely less on compound returns. When reaching FI, most of their nest egg should be the contributions (cost basis), while traditional retirees rely much more on capital gains compounding over many decades!

Just for your record, I also include the whole table with savings rates ranging from 5% to 95% and portfolio returns between 0% and 8%.


Again, it’s astonishing how little of a difference the return assumption makes on the path to FI. Example: with a savings rate of 60%, going from 5% to 6% return reduces the path to FI by only 0.6 years. There are two important lessons from this table:
- Nobody wants to throw away money so, yes, please go ahead and shop around and find funds with the lowest possible expense ratios. But don’t stress out over a 0.01% or 0.02% difference. The impact on the time to reach early retirement would be measured in days!
- It’s tempting to get lazy with the savings rate and hope to compensate for that with better investment results. Don’t delude yourself! Imagine person A plans for a 5% return and a 60% savings rate. The path to FI would take 12.2 years. If person B’s savings rate is 55%, even with an 8% annual return, the path to FI would take 12.3 years. Three full percentage points are not enough to overcome just a 5% difference in the savings rate!
Shockingly Complicated and Random Math: Simulating the path to FI with actual returns
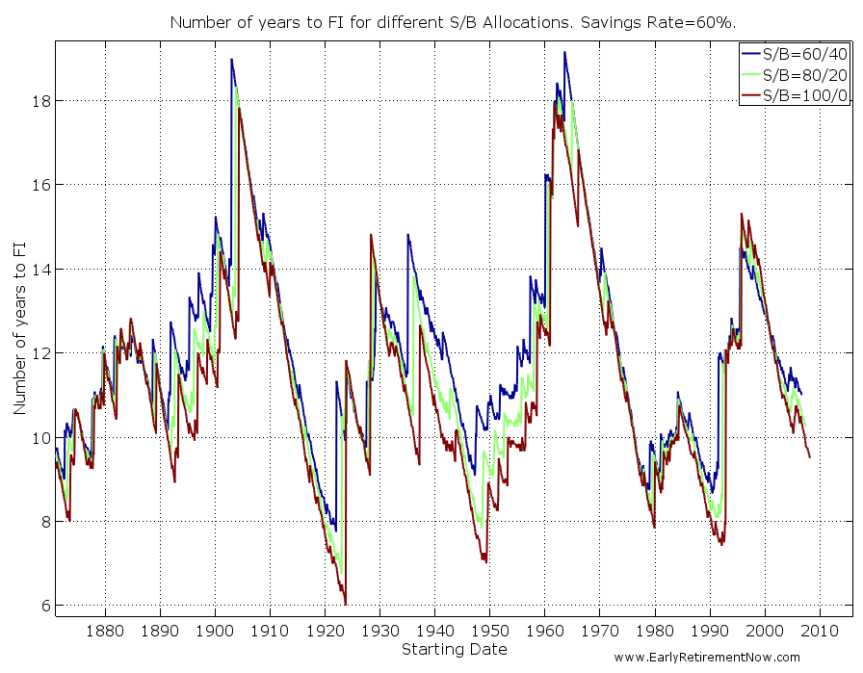
There is no investment that guarantees a fixed 5% annual real return. In the real world, we’ll have to try our luck with volatile equity and bond returns. So, how long would it have taken to reach 25x annual consumption for folks starting their FIRE savings at different points in time? Let’s simulate how each of the different cohorts would have fared with different Stock/Bond allocations (60/40, 80/20, 100/0) and different savings rates (5-95% in 5% steps). In the simulations, I use the same returns as in the Safe Withdrawal Rate Series: S&P500 equity returns and 10-year benchmark Treasury bonds, net of a 0.05% annual expense ratio. Each cohort starts with $0 initial savings. And again, just for the record: the contributions and consumption (and thus the savings target) all adjust with U.S. CPI Inflation!
In the chart below, I plot the number of years to FI for the three different asset allocations and a 60% savings rate. There is quite a bit of variability: Anywhere between 6 and 19 years. Uhm, that’s a lot! It shows the futility of trying to pin down one specific number of years to FI!
Anyone who posts estimates of “Years until FI” should put the disclaimer “Individual Results May Vary. Wildly!“
Also, notice how close together the three lines are. For a given savings rate, the length of the accumulation path is mostly determined by things out of our control, not so much by picking the “right” asset allocation. Also, notice that the 60/40 “low risk” asset allocation has the longest run to FI for some cohorts (19 years!). On average, a 100% equity allocation gets you to the target faster!

In the chart below are the years to FI for a fixed 100% Stock allocation and different savings rates (30%-70% in 10% steps). Notice how the lines stop significantly before 2017. That’s because all cohorts with a 30% savings rate that started saving after 1992 are still not at FI! On the other hand, both the 70% and even the 60% savings rate would have gotten you to FI if you had started out around or even after the Global Financial Crisis!


In any case, the one lever that is in our control is the savings rate. And it has a huge impact on how long it takes to reach FI. So let’s summarize again: The savings rate matters more than the asset allocation! This is again consistent with the result from the table with the deterministic returns: Increasing the savings rate is the only reliable rate to cut the time to FI!
Natura non facit saltus? Maybe it does!
One peculiar feature of the simulation results is that the lines look really jagged. It’s a saw-tooth pattern! What causes the sudden jumps? For example, the number of years to FI jumps from just under 8 years to over 12 years when you go from the October 1992 to the November 1992 cohort. The October 1992 cohort reaches FI in the year 2000 at the market peak while the November 1992 cohort fell short by just a few dollars only to fall back 15x annual consumption in 2002. That cohort reached 25x only in 2004. Of course, one could argue that the November 1992 cohort came so close and likely would have retired in 2000 as well. But in the simulations, you have to draw the line somewhere. If I had picked a 24.9 cutoff then maybe the discrete jump would have occurred with the December 1992 cohort. Pick your poison!


Also a little side note: The November 1992 cohort would have been wise not to retire in 2000 even after coming so close to 25x! As I showed in Part 6 of the SWR series, the year 2000 retirement cohort would not have fared very well with a 4% withdrawal rule, contrary to popular belief.


Complicated Math: Saving for retirement in different equity valuation regimes
When you start saving for retirement, does it matter how expensive equities are at the start? You bet! Just like the sustainable safe withdrawal rate depends on equity valuations (see Part 3 of the SWR series), the time horizon to FI will be impacted as well. In the scatter plot below I plot the earnings yield (=1/CAPE) on the x-axis and the number of years to FI on the y-axis, assuming a 60% savings rate and a 100% equity portfolio. It’s mostly downward sloping. Specifically, at an earnings yield of about 3.3% (today’s CAPE is 30 right now), we would have observed a slightly longer horizon to FI, around 12-15 years, which is a little bit higher than the median of 10.8 years. For folks starting out on their quest to FIRE today, that means they might have to budget a little bit longer. Some people are more fortunate and some are less fortunate with the time and conditions when they start saving. Don’t get discouraged if your path to FI might take a little bit longer than Mr. Money Mustache’s!


Shockingly Complicated Math: Puting it all together
Here are some more summary tables. They are the median number of years to FI for 60/40 and 100/0 portfolios, both for all starting months and those when the Shiller CAPE was elevated. I also throw in the results with the deterministic returns, both my calculations (monthly contributions) and Mr. Money Mustache’s numbers (annual contributions). 100% equities usually get you to the finish line the quickest. The median numbers from the historical simulations are indeed quite similar to the estimates with 5% deterministic returns! Expensive equities have a little bit of an impact on the length but it’s not a huge difference. Sequence of return risk is not quite as damaging for the saver as it is for the retiree!


Let’s look at the 100% equity portfolio and display not just the median but also the range from minimum to maximum time to reach FI. Both for the entire sample as well as for an elevated initial CAPE ratio. Quite intriguingly the maximum time to FI does not occur when the initial CAPE is above 20 (one exception, 17.9 years for when the savings rate is 60%). This is where sequence of return risk works in your favor. The high initial CAPE correlates with a bear market early on, you save when equities are cheap which shortens the worst case scenario FI length. But it is still true that the cohorts that reach FI the fastest faced initial CAPE ratios lower than 20. Makes sense: they tend to be the cohort that start saving for FI right around the bottom of a bear market when the CAPE is low!


Conclusions
- Early retirement is simple; a high enough savings rate could get you FI in a little over 10 years.
- But let’s not oversimplify: The actual number of years it takes to reach FI is highly uncertain. It isn’t quite as simple as looking up a number in a table. Don’t be surprised if you reach FI much earlier or much later than the “estimates” you see on the web.
- A 100% equity allocation is likely going to get you to FI in the shortest time span. But that said, for early retirees, an 80/20 or even 60/40 allocation will get you there almost as quickly. This is the beauty of early retirement and the 50%+ savings rates: A larger portion of your nest egg will be principal and you rely less on capital gains and compounding than the typical retiree with a 40 or 45-year horizon. For early retirees, asset allocation “mistakes” are less damaging!
We hope you enjoyed today’s post! Please leave your comments and suggestions below!
PS: as someone pointed out via email, Go Curry Cracker published a post in 2015 with a similar approach that I must have missed somehow. They also calculate the time to FI with historical real return data, though at an annual frequency only, over a shorter simulation window and without regard for equity valuations. One interesting additional calculation at GCC is how much longer it takes to reach 30x and 50x annual expenses after you’ve reached 25x. Only a few more years! How cool is that?!