I hope everybody checked out the ChooseFI Roundup episode in early January, where I talked with Jonathan and Brad about the recent stock market volatility. They invited me for a short appearance on their Friday show after reading my piece from two weeks ago. That post was on how the recent stock market volatility will probably not obliterate the FIRE community. One issue that came up is the potential for people on their FIRE path to actually benefit (!) from the drop in the stock market. How can one possibly benefit from a drop in the stock market? It’s certainly not a guarantee. It depends on the personal circumstances and on the nature of the stock market drop! Generally speaking:
- How permanent or how transitory is the drop in the market? If your portfolio dropped because one of the equity or bond holdings went bankrupt (or you were a victim of the OptionSellers meltdown) then that’s not something to cheer about. It’s about as permanent as it gets. Not good for the investor! But frequently, the market drops without much of a change in fundamentals. Be it a “flash crash” that reverses within a few hours or even minutes or the (likely) overreaction of the stock market drop in December, one could argue that since nothing (or not much) changed in the fundamentals (GDP growth, earnings growth, etc.) the drop may be only temporary and will eventually revert to the mean. Or even during a recession (the definition of weaker fundamentals!) stocks often overreact on the downside and then stage a strong comeback, i.e., return expectations going forward could be higher than long-term average returns. In other words, that paper loss you see now could be at least cushioned by higher returns on your additional savings going forward. And if this admittedly uncertain advantage of higher expected returns is large enough and over time more than offsets the paper loss then we could be looking at a net gain.
- How far along are you on your path to FIRE? The further along you are the more damage a bear market will cause even if you can expect a bounce in future expected returns from a transitory shock to the market. On the other hand, if you’re just starting out saving for retirement and all you lost is a few hundred or thousand bucks in your 401k/IRA and you still got 10-15 years ahead of you then you might benefit from the drop!
So, in other words, if the loss in your existing portfolio is offset by enough of a rise in future expected returns, then a drop in the stock market can be a net positive. Seems pretty obvious from a qualitative point of view. But quantitatively? How early is early along the FIRE journey? How much of a rise in expected returns do we need to make this work? Even if there isn’t a net benefit, how much of the paper loss is at least cushioned by higher future returns? These are all inherently quantitative questions. This blog post is an attempt to shine some light on the math behind the tradeoffs…
Permanent vs. Transitory
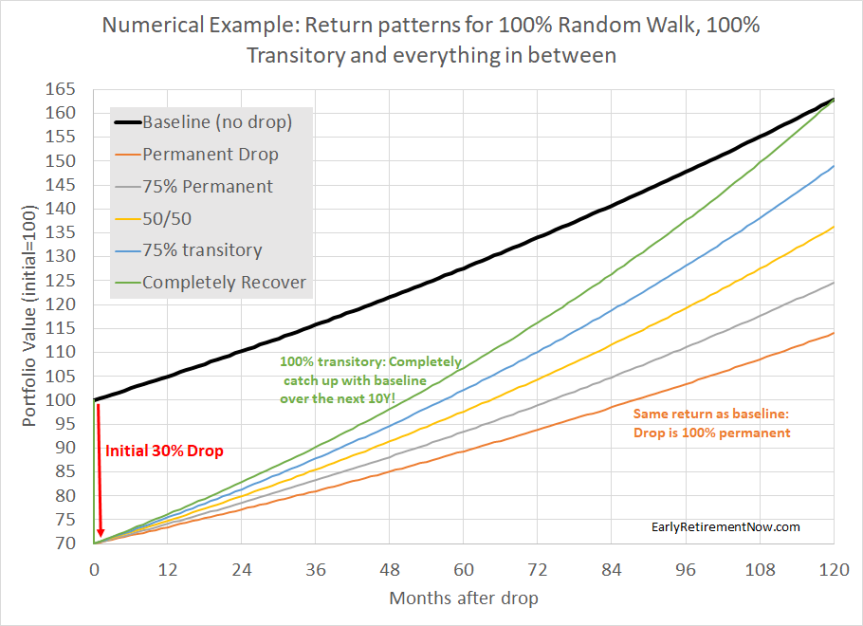
It all depends on how the stock market drop impacts our portfolio return assumptions going forward! Let’s look at the small numerical example. Assume you had expected your portfolio (currently at 100) to grow by 5% p.a. (after inflation) for the next 10 years. But then, BOOM, you get hit by a 30% drop in your portfolio. What happens after that?
- The drop could be 100% permanent. So, even from that decimated level of 70, you still grow your portfolio at only 5% p.a.
- The drop could be 100% transitory, so over some time span, 10 years in this case, the portfolio will recover. Not just the loss but you also reach the same level as the portfolio without the 30% drop after 5% p.a. This would imply an annualized return of 8.81% ( = 1.05 / 0.7^0.1 – 1)!
- Everything in between. I assume 5.94%, 6.89% and 7.85% (compound) returns to reach the 75/25, 50/50, and 25/75 permanent/transitory spots in between.

Let’s look at the different options in more detail:
Extreme 1: The shock is 100% permanent
There are a bunch of different scenarios that would certainly make the loss permanent:
- The 30% loss is due to 30% of the stocks in your portfolio going bust. Well, sorry to tell you, but unless there is some fundamental reason that the bankruptcy of some stocks in your portfolio will make the remaining stocks more profitable this is likely permanent. Same with losing money in Ponzi Scheme or with OptionSellers.com. Keep that champagne bottle in the fridge!
- Congress passes a corporate tax hike that will permanently lower the profitability of publicly traded corporations. The stock market will drop and the lower future profitability will put a lid on growth going forward. Of course, the drop may not be exactly 100% permanent. Maybe investors price in a reversal of this policy. But it could also go the other way around if investors fear even worse tax policy will come in the future. In that case, we could have a drop initially and slower than initially expected equity returns. Ouch!
Extreme 2: The shock is 100% transitory
How is it possible for the portfolio to perfectly recover and reach the exact same final value after 10 years? There are clearly a few possibilities:
- Imagine you own a bond portfolio and hold your bonds to maturity. A change in the interest rate today will certainly change the value of the bonds and specifically, a rise in the market interest rate will send your bond portfolio down. But absent of a bond default you are still earning your interest and get your principal back just as planned initially. This is the definition of a 100% transitory shock!
- A flash crash. Certainly, the convergence back to “normal” will be faster than 10 years. In fact, fast enough that the average FIRE saver will probably not have a chance to react to it and use Dollar Cost Averaging. But one could even argue that the 1987 crash likely was only a blip in a long bull market that ended only in 2000.
Everything in between
As always, reality will be somewhere in between. I seriously doubt that the average bear market will be 100% permanent but, likewise, I don’t think that one can bank on the full convergence back to the old trend growth path. Let’s take a look at the two most recent bear markets. In the chart below, I plot the real inflation-adjusted S&P500 index (dividends reinvested) since 2000. I also add four “trend return” lines starting at the peaks and troughs of the 2000-2002 and 2007-2009 bear markets. As a trend return, I use 6% which is a little bit lower than the very, very long-term average of 6.7% but considering how tumultuous the 2000s were, let’s round that number down to 6%.

In any case, notice something?
- The 2000-02 bear market saw a recovery that didn’t even get close to the previous peak plus trend growth. Sure, there was a slightly faster than 6% recovery from the through, but during the Great Recession in 2007-09 we dropped even below that. Currently, we’re only slightly above the 2002 bear market trough plus 6% growth! This bear market definitely looks like it was mostly permanent.
- The 2007-09 bear market is the exact opposite. We did actually reach the old peak plus 6% p.a. (the black line crosses the dark green line in 2018) and only recently, in Q4 of 2018, dropped a little bit below it again. The jury is still out on how this will work out long-term but unless we get another significant drop (30 or even 50% from here), the 2007-09 bear market seems like a candidate for “mostly transitory!“
Valuation/Mean-Reversion
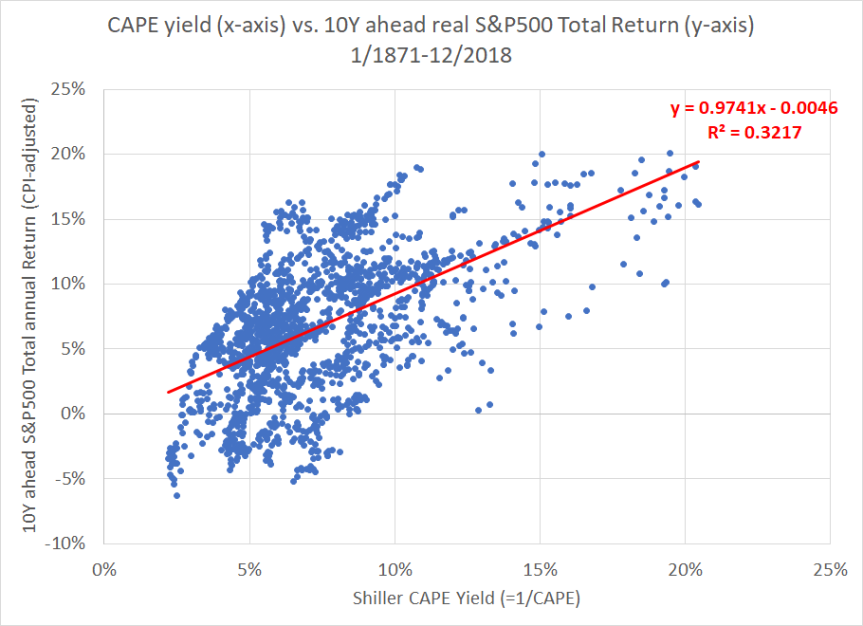
What’s could explain the difference between those two different bear markets? Valuation of course. In 2000, price-earnings ratios were at record levels (Shiller CAPE at 40+) and nobody should be surprised that returns will be less generous going forward. In contrast, at the October 2007 peak before the Great Recession, valuations weren’t cheap but at least they weren’t as outrageous as during the dot-com bubble. More generally, there is a strong correlation between earnings yields and future returns, see the chart below. It plots the Shiller CAPE yield (=1/CAPE) on the x-axis versus the 10-year forward return in the S&P500 (dividends reinvested, adjusted for CPI). On average, a 1 percentage point higher earnings yield has “returned” an extra 1% p.a. S&P500 return over the next 10 years. So, if the S&P drops by 25% and the CAPE ratio falls from 33.33 (=3% CAPE yield) to 25 (=4% CAPE yield) then one could expect a roughly 1% higher return for the next 10 years. That doesn’t completely get you back to where you started but you recover some of that loss; about half of it over 10 years.
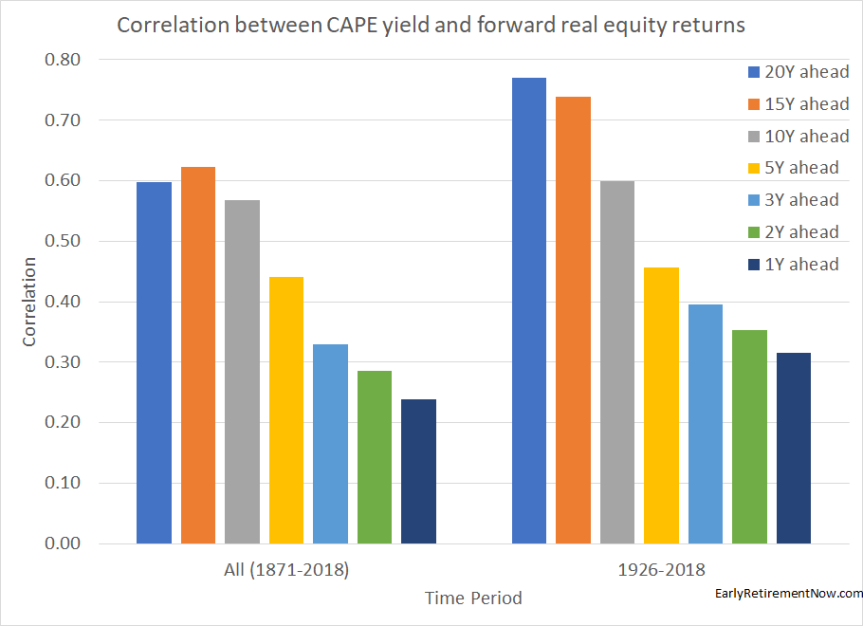
Also, just out of curiosity, over what horizon does the CAPE yield correlate best with future returns? Not surprisingly, the correlations between current CAPE yield and future returns become higher the longer the horizon. Quite amazingly, the correlations level off only when we reach 20-year return windows, see below. Anyone who wants evidence that the stock market is not a mathematical random walk please take a look at those correlations! And check out more evidence in my post from last year!
A Numerical Example
So what does this all mean for investors? Let’s look at a very generic example. It’s intentionally generic and not necessarily trying to replicate what exactly happened in the fourth quarter of 2018. Let’s look at the damage a 30% drop in your portfolio would do for a bunch of different scenarios: a) people at different stages of their FIRE path and b) different degrees of permanence vs. transitoriness.
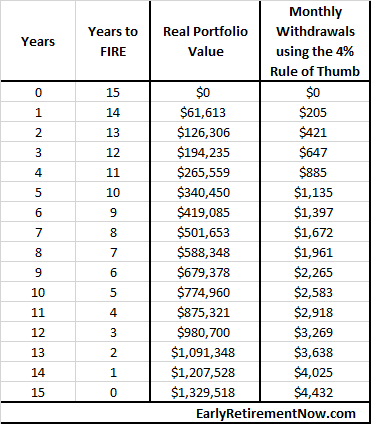
Our generic investor starts with zero assets in year 0 and invests $5,000 per month (adjusted for inflation). He/She plans for a 5% p.a. portfolio return (after inflation) and saves for 180 months (15 years), so without any market crash in between the path of the (real CPI-adjusted) portfolio is as in the table below. After 15 years the portfolio is large enough to sustain a $4,432 monthly withdrawal under the 4% Rule of Thumb. And I know about the limitations of the 4% Rule, so don’t make me go there 🙂 !!! In any case, that’s is a nice enough retirement budget. So, let’s assume that our investor will retire after 15 years of accumulating assets.

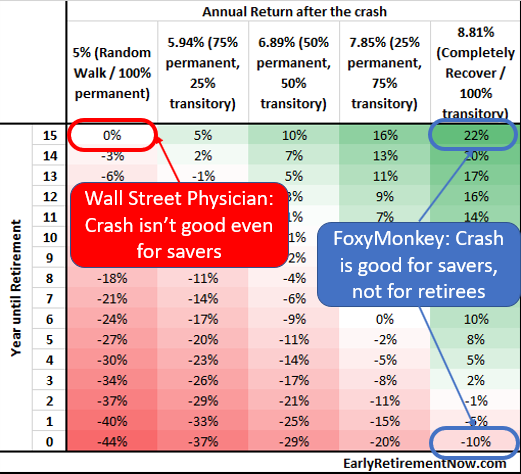
How do we model the sequence risk? Let’s assume that at each of the 16 stages of preparing for FIRE we check the impact of a 30% drop in the portfolio value plus a subsequent trend return path of either 5%, 5.94%, 6.89%, 7.85%, and 8.81%, corresponding to the 5 different assumptions about permanence vs. transitoriness. How does the portfolio value 10 years down the road compare with the one without the crash and with constant 5% returns? So, for the 16×5=80 different combinations, what’s the percentage benefit (positive or negative) of the crash?
Example: You’ve saved for 9 years on your path to FIRE (=6 years before FIRE). Your portfolio of $679,378 takes a hit of 30%, but you keep saving your monthly $5,000 for 6 more years and then retire and withdraw the $4,432 as initially planned. How much money will you have exactly 10 years after the crash (after 6 more years of accumulation and 4 years of withdrawals)? Assuming the shock was 50% permanent, 50% transitory (6.89% returns for 10 years), the final portfolio value is $1,260,781. That’s about 9% lower than without the crash and 5% returns ($1,380,660). So, the rows correspond to the different stages of FIRE (15 years to retirement all the way reaching FIRE) and the columns for how permanent vs. transitory the crash was: all the way between 100% permanent to 100% transitory in 25 percentage point steps. At 6 years to retirement and 50%/50% permanent/transitory, we find that exact -9% number we calculated in the example above.

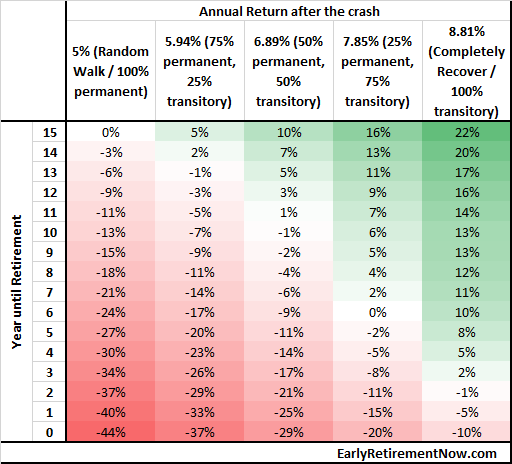
The key results from this table:
- If you’re still 10+ years away from Early Retirement you can benefit from a drop in the portfolio if you assume even a moderate level of mean-reversion. This is what I was talking about in the ChooseFI podcast two weeks ago. The market doesn’t even have to perfectly catch up to the baseline and you still come out ahead. It’s the one occasion where Sequence Risk works in your favor!
- And obviously, if you’re now retired or even close to retirement (1-2 years before retirement) then you’re essentially guaranteed to lose. Even if we assume the shock will perfectly mean-revert over 10 years!
- For everyone in between, say, 3-10 years away from retirement, there is great uncertainty as to whether the 30% drop is something to cheer about or be afraid of. It all depends on how permanent of transitory the drop is!
- It’s also interesting and informative to look at where the cross-over points are. Say, if you got 10 more years to go, how permanent/transitory would the shock have to be to still come out ahead? Roughly 50/50. Or if you believe the shock is mostly (75%) transitory how many years prior to retirement do you “break-even?” Roughly 6 years prior to retirement.
Conclusions
Others have written about this topic. But I think they have done so only very superficially. Here are two examples:
- FoxyMonkey recently posted Why a stock market crash is actually good for you and, no surprise, savers benefit from a crash that perfectly mean-reverts and retirees don’t.
- Wall Street Physician had a post in 2017 on why even young investors shouldn’t hope for a crash. Perfectly true if you assume that the stock market follows a strict Random Walk!
Wall Street Physician quite correctly points out that most crashes are certainly not 100% mean-reverting. But just because a crash is not perfectly mean-reverting doesn’t imply that it has to be 100% permanent all the time. It’s a false dilemma fallacy! The stock market is not a perfect random walk (see my post from last year) and consequently, one should certainly raise return expectations after a big stock market drop.
We’re all at different stages on our FIRE path and the average crash is somewhere between 100% permanent and 100% transitory. The pros and cons are a lot more complicated than the three “obvious” corners covered in the “analysis” you see out there in the personal finance blogosphere (see the chart below)! The pros and cons depend on how permanent/transitory the crash is and where you are on your FIRE path.