


I thought I had written everything I wanted to write about emergency funds. Especially why I don’t like them! For example:
- Our emergency fund is exactly $0.00
- Top 10 reasons for having an emergency fund – debunked (Part 1)
- Top 10 reasons for having an emergency fund – debunked (Part 2)
But this topic just keeps coming back. Most recently in the ChooseFI podcast episode 66 and the discussion that ensued afterward. One unresolved issue: the pros and cons of investing the emergency fund in the stock market. As I’ve mentioned before, I am not against having an emergency fund. Quite the contrary, if you’re on your path to Financial Independence (FI) you strive to accumulate 25 years (!) (or better 30+ years) of expenses – much more than the 3-6 or even 8 months of living expenses normally recommended to keep in the emergency fund. In other words, I view our entire portfolio as one giant emergency fund invested in productive assets (mostly equity index funds) and I don’t see the need for keeping a separate bucket of money in low-risk assets. One could view this as having an emergency fund that’s invested in stocks! 100%! How crazy and/or how irresponsible is that? That’s the topic for today’s post. Let’s look at the numbers and quantify the tradeoffs…
Pros and cons of investing the Emergency Fund
My critics would normally object “you must invest the emergency fund in something risk-free (or at least significantly less risky than stocks) because the emergency could occur when the stock market is down!” My response is: So what!? I never claimed that investing the emergency fund (EF) in stocks will always outperform. On average it will and I am willing to take risk of some moderate downside. But I still like to know a) how large is that downside and b) how likely is the downside and c) how does that compare to the upside? Then weigh the pros and cons.
Simulation exercise
Let’s look at how investing the emergency fund in different portfolios would have performed. Here are the assumptions for my little numerical example:
- Invest one dollar every month for 36 months to build up an emergency fund.
- The contribution occurs at the beginning of each month.
- Of course, all contributions are adjusted by CPI inflation, to make meaningful comparisons across time.
- At the end of the 36th month, we must fund an expense of $36, which is also in real inflation-adjusted dollars.
- I consider 4 different portfolios:
- 100% stocks (S&P500 total return index)
- 100% bonds (10-year Treasury bonds)
- 60/40, i.e., 60% stocks, 40% bonds
- 100% cash: money-market-like returns calculated as 3-month T-bill returns
- I use monthly returns from January 1871 to December 2017, just like in the Safe Withdrawal Rate Series.
I kept this example intentionally generic. For example, someone could view this as saving $100 a month for 36 months to hedge against a $3,600 home repair. Simply multiply all simulation results by 100. Or a $7,200 repair? Simply multiply everything by 200. Or multiply everything by 500 if you’re saving $500 a month to hedge against a job loss, i.e., the emergency expense would be $18,000, worth 6 months of expenses at $3,000 each. I also wanted to keep the investment horizon short enough to ensure that there will be plenty of examples where the equities will significantly underperform the money market account. But also long enough to account for the fact that an emergency fund is substantial enough that you can’t just be put together in a few months.
In any case, let’s look at the portfolio value for different cohorts after withdrawing the $36 emergency expense, see plot below. Thus, a value of, say, $3.50 in that plot (and all calculations below) would mean that the emergency fund would have grown to $39.50, so we’d have $3.50 left over after withdrawing the money for the emergency. Likewise, a value of -$5.00 would mean there was a shortfall of $5.00 because the portfolio only grew to $31.00, insufficient to fund the $36 emergency expense. Some observations:
- The equity investment creates a lot of uncertainty about whether you can actually fund the desired expense. Your shortfall could be as bad as $23. But you could also end up with over $30 more than you needed!
- Investing the EF in cash (earning money market interest) creates much less volatility. But make no mistake! In real, inflation-adjusted terms, even the ostensibly “safe” EF invested in the money market has occasionally been eroded by inflation to generate a shortfall of $5 and more!


We can also plot the whole chart as the difference between the risky portfolios and the “safe” EF invested in cash, see below. This difference is what I’m mostly interested in because I like to get a sense of how frequently and how severely I underperform the safe EF if ignore the advice from the (so-called) financial experts and I invest in equities instead. Now the spike on the downside during the Great Depression becomes even more pronounced. But the spikes for the bear markets in the 2000s didn’t change much, mainly because money market interest rates were so close to zero in real terms:

And finally, I can also provide a table with some stats of the above time series. And again I report numbers for both the absolute values of the four different portfolios (left) as well as the final portfolio values over and above the Cash EF (right). Some more observations:
- Stocks outperform the cash-only EF by about $3.54 of monthly investment. That’s $354 for a $3,600 emergency fund!
- But due to the much higher volatility, there is a significant probability (31%) of underperforming the money market fund!
- What is a serial correlation? Glad you ask, I will get to that in a just a few paragraphs. Hold that thought and stay tuned!!!
- I also include in the table the percentile distribution of the different returns. How concerned would I have to be about investing the EF in stocks? Sure, there were cases where the stock investment underperformed. As a cautious investor, I realize that the $3,600 EF target might fall short by between $795 and $1,555 in 5% and 1% of the cohorts. But that’s not a life-altering loss. Neither in absolute terms nor compared to the median advantage of $351.


Summary so far: I don’t think people can make a clear and convincing case that you should never invest an EF in stocks. It all boils down to risk aversion: I am not that risk-averse, thus, I should be comfortable keeping my EF in risky assets. Others have different risk preferences and might want to keep their fund in cash. Though, I can already hear one objection:
“Objection, objection, Big Ern! In your Safe Withdrawal Series (see Part 1 here), you always make the case that we should look at the scary tail events. Why not here? Aren’t you logically inconsistent?”
I am so glad you asked! The two reasons why I use a different kind of risk management in my Safe Withdrawal Rate Series are:
1) Magnitude: Running out of money in retirement is a catastrophic and life-altering event. Running short a few hundred dollars in the EF example is a nuisance. In the former exercise, I like to be much more cautious and study the extreme tail events. In the latter exercise, I am much more willing to trade off a small probability of a small loss with a small probability of a moderate gain.
2) Sample Size: The safe withdrawal exercise is a one-shot game. I will retire in June 2018, which makes me a member of one and only one retirement cohort in my simulation exercise. I can’t split myself into ten little Big Erns that retire at ten different times and are then able to shift money from, say, cohorts 3 to 10 who had better luck with their retirement timing to cohorts 1 to 2 who might risk running out of money. I can’t perform any diversification between ten little Big Ern cohorts! It’s a very different story for the emergency fund. Over my lifetime, I have faced multiple spending shocks. Some occurred when the market was up, some occurred when the market was down. The timing of those shocks and the market level at those times are mostly uncorrelated. So, I get a lot less concerned about tail events and look a lot more at means and medians because, in the end, I will average over multiple different events.
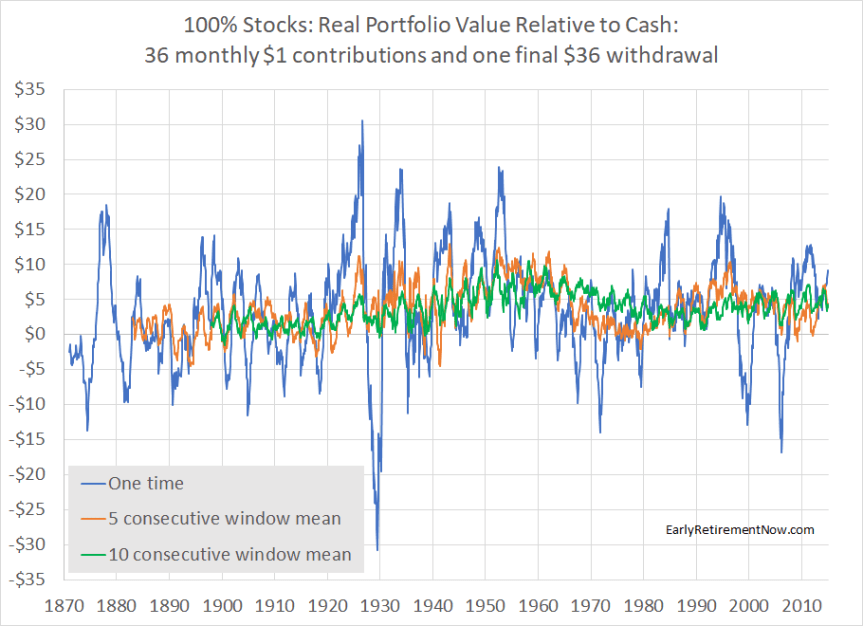
This last point got me thinking: What’s the distribution of not one single 36-month EF window but multiple consecutive windows in this simple numerical example? Think of this as saving for not just one single emergency but the five to ten emergencies we may face over our lifetime.
Think of this as diversification, but not within the portfolio but across different 36-month windows. And here’s where the serial correlation comes in, remember the item in the return stats table above? That is the correlation between two excess returns over cash of two (non-overlapping) consecutive 36-month windows. For stocks, we had a correlation of -0.10, so not only are the returns not correlated, but they are even very slightly negatively correlated.
Let’s look at the chart below: Smoothing out the very crazy volatile blue line (EF invested in 100% stocks excess return over cash) over 5 and 10 consecutive (non-overlapping) windows, you do a pretty good job of averaging out the large spikes. It looks like the excess return of the 100% equity EF is now much more consistently positive!
And here’s the table of not just the stock but also bond and 60/40 portfolios (relative to the cash EF), see below:
- Averaging over 5 and especially 10 consecutive windows it becomes more and more likely that we outperform the cash/money market EF! Over ten consecutive windows there was only a 2.4% chance of falling behind when investing in equities! And even then, the shortfall is tiny! That’s not surprising! You average over 10 individual EF calculations, they are not just uncorrelated but even very slightly negatively correlated, so some of the bad luck when withdrawing from the EF at the stock market bottom is bound to average out over time.
- It’s really intriguing that a portfolio with lower short-term risk, i.e., bonds or 60/40 performs significantly worse than the 100% equity portfolio. Bonds had a 43.7% chance of performing worse than the cash EF in the one-shot version. In the 5 and 10 consecutive windows that probability actually goes up (!!!) which shows again that an ostensibly low-risk investment over short horizons creates a higher risk of falling short of expectations over longer horizons! See a post in a similar vein from a long time ago: “When bonds are riskier than stocks“


And I won’t buy extended warranties either!
Until I put this post together I always thought that the preference for a cash-only emergency fund can be rationalized with risk-aversion. But that’s a very myopic way of looking at the problem. It reminds me a bit of the issue of whether or not to buy an overpriced extended warranty on cars, appliances, electronics items, etc. Looking at the one problem in isolation, a very risk-averse person could rationalize buying the warranty. But it would be so much cheaper to self-insure, i.e., save the money one would spend on each warranty and pay for the replacement or repair of the 1-2 items that break down eventually. So, in that sense, the warning “what if you need the emergency fund when stocks are down?” reminds me a lot of the sales pitch for the extended warranty: “what if your TV breaks down 3 days after the manufacturer’s warranty expires?” My reply: I don’t care! I take this small gamble because I will average this over at least 5-10 such risks over my lifetime and I like to pocket the positive expected value of the ostensibly riskier option!
Thanks for stopping by today! Please leave your feedback below!
Picture Credit: Pixabay.com