


Welcome to the newest installment of the Safe Withdrawal Series! Part 25 already, who would have thought that we make it this far?! But there’s just so much to write on this topic! Last time, in Part 24, I ran out of space and had to defer a few more flexibility myths to today’s post. And I promised to look into a few reader suggestions. So let’s do that today pick up where we left off last time…
Updates on the rules suggested by readers
People came up with two interesting suggestions I hadn’t considered before. So I wanted to feature the simulations for those as well:
- What about starting with a cash bucket, i.e., having 2-3 years worth of spending stashed away in a money market account or short-term CDs to access if the market doesn’t cooperate? Sounds a little bit like Fritz’ Bucket Strategy.
- How about we cautiously start at 3.25% and then have the flexibility to walk up our withdrawals if the portfolio grows enough over time? How long would it take to actually grow withdrawals in the cohorts where the 3.25% turned out way too low?
Notice that both rules have one thing in common: the withdrawal rate is below 4%! Let’s not even try to make the 4% Rule work because we can’t. Any new alternative flexibility scheme that may look better than the existing ones in year X has to sacrifice something in another year Y. But obviously, we can get somewhere if we consider the flexibility of simply working another year or two and adding a cash cushion or a lower SWR. Both would imply a net worth target higher than 25x consumption!
Cash Bucket
What I assume here is that the cash bucket doesn’t reduce the stock/bond investment but it’s in addition to the $1m portfolio. Notice that we did a very similar calculation in the post two weeks ago: How much do we have to scale up the entire portfolio to make sure it doesn’t run out after 23 years (1929 cohort) or 28 years (1966 cohort). We needed about $226k of additional savings in 1929 to make the portfolio last the entire 50 years, and $146k in 1966. But for today’s exercise, let’s assume the money is not invested in the same 80/20 portfolio but instead held as cash in a money market account (returning just the 3-month T-Bill interest rate). Also, assume that we only withdraw from that cash cushion if the investment portfolio goes more than 20% underwater. Once the cash cushion is exhausted we tap the investment portfolio and we never replenish the cash account it again. So, think of the cash cushion strictly as an insurance policy against Sequence Risk for the first few years after retirement.
How much extra money do we need to make ends meet? Not that much! Only about $100k to $115k in the two worst-case scenarios! Much less than what I calculated two weeks ago. Makes sense because if the portfolio goes down so will the additional savings if they are invested in an 80/20 stock/bond portfolio. But letting the cash sit on the side we are not exposed to that initial drop, which was particularly brutal in 1929. So, for the record, let me state that this cash bucket strategy seems to work pretty well, despite my previous doubts! It’s relatively inexpensive insurance against Sequence Risk! Think of it as a mini-glidepath during the first few years of retirement! And it “only” takes the flexibility of getting to 27.5x instead of 25x annual spending!


3.25% initial withdrawal rate (=floor) plus upward adjustments
We know that the 3.25% SWR would have been OK for the 1929 cohort. Let’s assume we start with this as the initial withdrawal rate. But also assume that we will walk up the withdrawals in the absence of bad sequence risk. How long will it take to ratchet up the withdrawals if the returns aren’t as bad as in 1929? We answer that question in the chart below. It’s a bit of a mixed bag!
- 1929 would have never moved up the withdrawals. Makes sense!
- 1966 would have been stuck with the 3.25% SWR for a long time and only toward the end would have seen an increase by few percents.
- 1972, which is a true type 2 error: a 4% SWR would have worked but we would have withdrawn a lot less for about 25 years! Then noticing the mistake we’d have almost doubled the withdrawals in the second half of the retirement!
- The 2000 cohort would still be withdrawing the same initial amount! Even though the market recovered, the portfolio ex-withdrawals did not. Ouch!
- The 2007 cohort has only recently started to move up their withdrawals. But we’re still below a 4% SWR even after the long rally! A bit of a disappointment!


(Technical note: I set the GK guardrail that guides the upward adjustment really tight to speed up the ratcheting up of consumption! If the effective WR falls below 0.99×3.25% then move up consumption by 1%! If you keep the standard GK parameters, 0.8×3.25% guardrail and 10% adjustment the process of increasing consumption is even slower!!!)
Let’s now look at the remaining flexibility myths…
Myth #4: If you’re really, really flexible you can even use a 7% withdrawal rate!
Jim Collins in his stock series Part 13 makes the following assertion:
“In fact, the authors of the [Trinity] study suggest you can withdraw up to 7% as long as you remain alert and flexible. That is, if the market takes a huge dive, cut back on your percent and spending until it recovers.”
I didn’t read that in the Trinity Study. Certainly not explicitly, and not even implied. And certainly not over horizons that go beyond 30 years as many of us are facing. In fact, a 7% initial withdrawal rate, even with adjustments to the withdrawals if the market wouldn’t cooperate e.g. through constant % withdrawals, Guyton-Klinger, etc., makes it almost a certainty that the portfolio and thus the withdrawals will never recover to their initial levels! That’s because if we look at the long-term real, inflation-adjusted capital market returns, we get around 6.70% for equities, see my post from last year. For bonds, we get about 2% real returns over the last 100+ years, though, looking at today’s yield, right about 3% nominal, that gets you only about 1% after inflation. Mix equities and bonds together into an 80/20 or 75/25 portfolio and you’ll get an expected real return below 6%. That means you’re eroding the purchasing power of the portfolio and before even running one single simulation, I suspect that this 7% rule will not so easily recover. In other words, a 7% withdrawal rate doesn’t even pass the “smell test!”
But just to be sure, let’s check the cold hard numbers and see how some of the cohorts would have fared under the 7% Rule. I model the “remain alert and flexible” and “cut back on your percent and spending” part of Jim’s assertion as the good old Guyton-Klinger Rule with +/-20% guardrails and 10% spending adjustments once you bust through the guardrails (both up and downside!). It’s not a pretty picture! That $70k annual withdrawal out of a $1m portfolio (=$5,833 per month) would have dropped to about $2,000 to $2,500 per month after a little more than a decade for the 1929, 1966, 1972 and 2000 cohorts. True, the 1972 cohort recovers again to almost the initial withdrawal amount, but that’s 25-30 years into retirement and only very temporary; thanks to the dot-com bust and Global Financial Crisis the withdrawal amount drops again and finishes at 47% underwater. Still better than the 1966 cohorts and 1929 (-66% and -74%), though!
The 2000 cohort is also 54% in the hole after only 18 years. And since 7% real returns are not really all that realistic after a 9-year bull run we can expect further deterioration in the withdrawals going forward. Unless we assume that there are no more recessions over the next 30 years! The 2007 cohort is also 21% underwater, even though the S&P500 index has gained new highs more than 100% above the 2007 highs!

OK, so maybe the 7% Rule looks so bad because I just picked really bad pathological examples. Oh well, I did that because I want to see how “flexibility” works out in some of the financial tail events. But in case you’re interested, I also simulated the 7% Rule for 10 cohorts, each 2 years apart between January 1958 and January 1976. So, we span multiple years over multiple business cycles and not just the worst case scenarios.
The picture looks a little bit better for the 1958, 1974 and 1976 cohorts. They even go beyond their initial withdrawal amount, at least temporarily. Especially the 1976 cohort seems to be OK with the 7% Rule.

But for those who think that this is a validation of the 7% Rule: It’s not! Look at the CAPE Ratios prevailing when those cohorts retired: The Shiller CAPE was around 14 in 1958 and 1974 just above 10 in 1976. Equities were much cheaper, i.e., close to the bottom of their bear market lows. Today’s retirees are facing a CAPE above 30, which is significantly worse than even the other seven cohorts that didn’t exactly fare so well with the 7% Rule. Specifically, the seven other cohorts all have the same pattern: They run into the guardrail and never recover. Most of them have painful drawdowns in withdrawals down to about $1,500 (-74%, ouch!!!) even during the first 25 years. And all end up with vastly lower withdrawals once you get to 30+ years into retirement.

So instead of “…cut back on your percent and spending until it [the portfolio] recovers” Jim might have as well written:
- “…cut back on your percent and spending until you win the lottery“
- “…cut back on your percent and spending until hell freezes over“
- “…cut back on your percent and spending until you die“
- “…cut back on your percent and spending. Period!“
Side note: After finishing this section it occurred to me that one way to “save” the 7% Rule is to not just assume you adjust the withdrawals but we even lower the percentage target from 7% to, say, 4%. That would at least ensure that the portfolio will again recover in the very long-term. But it’s again one of those squeeze-the balloon scenarios. See the drop to $1,500 to $2,500 in withdrawals after 180 months? That would become $850 to $1,400. We are now looking at an 80+% drop in the withdrawals and potentially decades before we dig out of that hole. Dogfood for dinner!
Myth #5: “I don’t have to worry about no type 2 error!”
Type what error? If you read Part 23 of this series, you’ll remember that I pointed out that “flexibility” solves one problem but creates another: Since nobody knew in advance whether the 4% would fail, lots of cohorts in my simulations would have cut spending and/or gone back to work for no good reason. The 4% Rule would have eventually worked out and the portfolio would have lasted the entire duration of the retirement. But nobody knew at the time!
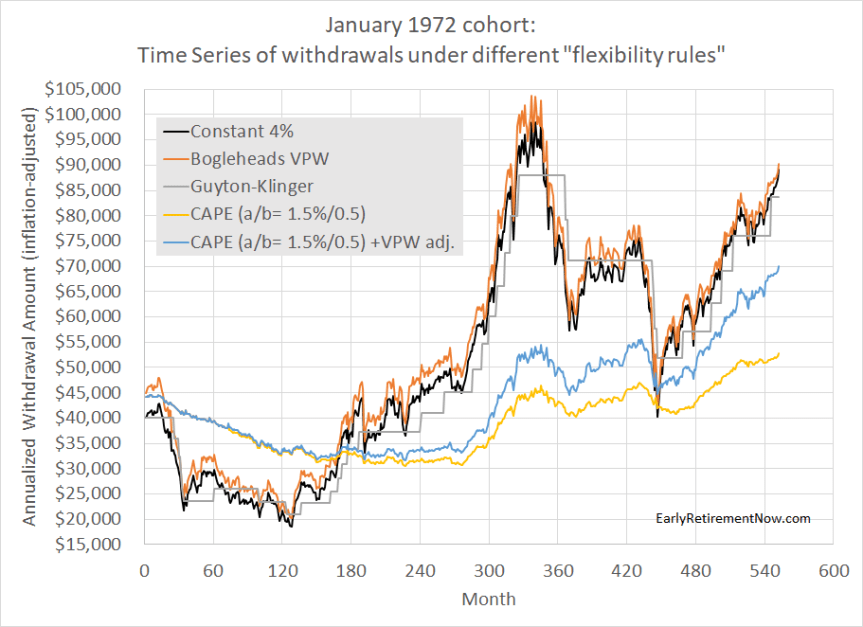
Case in point: The 1972 cohort! It suffered some of the same bad market environment as the 1966 cohort but by starting six years later you avoided some of the initial weak equity and bond returns. But due to the recessions in the 1970s/80s it still had a bad first decade before the great bull market of the 1980s and 1990s kicked in. Only, nobody knew that the big recovery was around the corner until later, so the 1972 cohort would have…
- …unnecessarily gone back to part-time work for about a decade.
- …unnecessarily slashed withdrawals under the Constant % Rule, VPW and Guyton-Klinger Rules, by up to 50%. Recovery only after 15 years!
- …unnecessarily walked down the withdrawals under the CAPE-based rules. Not quite as badly as with VPW, but the walk-down would have also lasted longer. 25+ years! Ouch!

How about the year 2000 cohort? The 2000 cohort is an interesting crowd because it’s not even obvious yet whether they will be a 4% Rule casualty or not. For a 30-year time horizon, we’ll have to wait until 2030 to find out! It is sometimes referred to as a 4% Rule success story, though I seriously doubt that, see Part 6 of this series! Well, just for the moment, let’s take the 4% fans by their word and assume that the 2000 cohort was a success. Well, let’s hope they didn’t follow the flexibility mantra because that would have meant going back to work for a total of around 9 years (50% rule) or 11 years (30% rule).

The other dynamic/flexible rules look equally unattractive. After 18 years, neither the Constant %, Bogleheads VPW nor the Guyton-Klinger Rules would have recovered to their initial withdrawal amounts. That’s despite the fact that the portfolio without the withdrawals would have easily recovered. But as I pointed out last time (Myth #2), the portfolio takes longer to recover if you take money out along the way. I’m almost too embarrassed to make this obvious and trivial point but you’ll be surprised how often people neglect this little detail…

The CAPE-based rules would have done pretty well, though. No noticeable decline in consumption. But then again, due to the nosebleed high CAPE Ratio in 2000, you would have withdrawn only slightly above 2.5% of the portfolio! So, here’s an example where flexibility would have worked. But only if you had accumulated a net worth of 40x consumption instead of 25x!
Myth #6: Social Security to the rescue!
Social Security, to be sure, can be a great addition to the early retirement planning. As I showed in my Case Study Series, many volunteers ended up with safe withdrawal rates North of 4%. Thanks to Social Security and pensions! For “older early retirees” Social Security can make a big difference. If you expect benefits worth $20k per year and have a $1,000,000 initial portfolio then the fail-safe withdrawal rates for 1929 and 1966 would have increased by this much, depending on when benefits start:
- Benefits start after 20 years: +0.45%
- 25 Years: +0.29%
- 30 Years: +0.20%
- 35 Years: +0.14%
- 40 Years: +0.08% (all figures calculated with the Google Sheet developed in Part 7)
It helps tremendously if you’re 50 years old and expect the maximum benefits at age 70, only 20 years into retirement. But for retirees in their early 30s, future Social Security benefits will likely not move the needle much. If the failsafe is somewhere around 3.25% (1929) or 3.50% (1966) without Social Security then Social Security doesn’t even get close to making that a 4%!
Myth #7: Thou shalt not over-accumulate wealth
I’m throwing this one in just to poke a little bit of fun at the flexibility fans. That’s because here I’m actually the one invoking flexibility while they seem to be surprisingly stubborn and inflexible. The criticism that I hear most often is that I’m overly conservative and will just end up with way too much money. My response: I could get rid of that problem pretty quickly, for flexibility is a lot easier when you have too much money:
- Give money to our church and a number of charities.
- Donate money to a university. We don’t have the cash to fund a building or a stadium named after us. But did you know that with a low seven-figure sum you can create an endowed professorship or chair at most universities? How cool would it be if we funded the “ERN Family Chair of Economics” at my alma mater? And if the university manages the money wisely that endowed chair might last longer than some football stadium, too! 🙂
- Help out our daughter with student loans, house down-payment, etc.
- Travel in more comfort: First class instead of coach class! A suite on the Queen Mary 2 instead of an interior stateroom on a Royal Caribbean cruise!
So, the possibilities are endless. And for all those who are still inflexible and uncreative about how to get rid of their extra cash, please reach out to us and I’ll let you know our checking account number! We can get rid of your excess cash problem!
Thanks for stopping by today! Please leave your comments and suggestions below! Also, make sure you check out the other parts of the series, see here for a guide to the different parts so far!
Picture Credit: pixabay.com