


June 17, 2020 – Welcome back to another post centered around Put Option Writing. Today we got a real treat because my blogging buddy, fellow option trader and frequent commenter “Spintwig” offered to do a guest post to perform an independent review of my trading strategy. If you don’t know Spintwig, he also retired in 2018 (at age 30!!!) from a career in ITnd now writes about FIRE and options strategies at his blog. He does a lot of interesting and important work, including careful and comprehensive back-tests of different option trading strategies, i.e., different underlying assets, different Deltas, different horizons (days to expiration), etc. I highly recommend you check out his work if you’re interested in option writing!
Oh, and following the guest post, I’ll also give a quick update on how my portfolio did during the crazy, scary volatility last week! Stay tuned!
Over to you Mr. Spintwig…
Thank you BigERN for the opportunity to peer review your options strategy and publically share the results with you and your readers. I’ve relied on your research in my own journey to and through FIRE and I’m happy to be able to add to the discussion and body of research.
A few years ago I stumbled upon BigERN’s blog as I was researching safe-withdrawal-rate topics. Among the material was a novel idea: selling put options on the S&P 500 index could mitigate sequence-of-return risk.
The concept was straightforward but I wanted to know if there was an optimal approach or if it could be applied to other indices and have similar results. Would it be advantageous to replace a traditional buy-and-hold portfolio with an options trading strategy? Unfortunately, there were no definitive or trustworthy answers to this question on the internet so I set out to do my own research and publish what I find.
Research Basics
The act of evaluating how a trading strategy performed over time is called backtesting. What I wanted to do was backtest various option strategies on the S&P 500 to see how they perform. I won’t bore you with the details of my research methodology; the takeaway is that the backtest results are publicly documented, fully transparent and, most importantly, compared against a relevant buy-and-hold benchmark.
There are two key attributes to keep in mind when evaluating performance: compound annual growth rate (CAGR, or sometimes called geometric return) and volatility. The timing and severity of volatility is the driving factor behind sequence of returns risk.
According to BigERNs data, an investor is better able to handle equity volatility, and consequently reduce sequence of returns risk, by writing options on an equity index as opposed to investing in the index directly. Let’s see how BigERNs option strategy performs when maximizing the effects of the central limit theorem by performing a formal backtest. The option strategy will then be compared against popular buy-and-hold benchmarks.
Backtest Structure
In BigERN’s 3rd update on option writing, he makes note of a few details regarding his strategy. In particular:
- Positions are opened every Monday that expire Wednesday, every Wednesday that expire Friday and every Friday that expire Monday
- Positions are held till expiration
- The time value target is roughly equivalent to a 5-delta position
- 2-2.5x leverage is used
- The underlying is SPX (the S&P 500 index). I’ll be substituting this with SPY (the S&P 500 ETF) for the purposes of making the strategy more accessible to those with smaller accounts.
This is enough information to perform a backtest. To spice things up, let’s see what happens when different amounts of leverage are used. Also, there’s a popular strategy that says to close short option trades at 50% max profit to boost performance. We’ll look at that as well.
As for the benchmark (data courtesy of Portfolio Visualizer), let’s compare against the following buy-and-hold portfolios with dividends reinvested:
- 100% SPY
- 80/20 SPY / IEF
- 60/40 SPY / IEF
[ERN: The SPY is one of the most widely used S&P 500 index ETFs and the IEF is a popular ETF to get exposure to (intermediate) 7-10-year U.S. Treasury Bonds. ]
The backtest will measure from Feb 21 2018 through June 5, 2020.
[ERN: The way I understand the underlying calculations that spintwig sent to me, the SPY and SPY/IEF returns refer to the Feb 2018 to May 2020 monthly returns from Portfoliovisualizer.com, so the returns don’t line up 100% with the put strategy returns!]
Feb 21 2018 is a special date in that it’s right after Monday-expiring weekly options on SPY were introduced (see SEC release 34-82733).
[ERN: Too bad this doesn’t capture the Feb 5, 2018 drop, but so be it! We do have enough vol spikes in there, including the fourth quarter of 2018 and February/March 2020!]
All in, we have the following backtest configuration:
- Symbol: SPY
- Strategy: Short Put
- Start Date: 2018-02-21
- End Date: 2020-06-05
- Position Entry:
- every Monday
- every Wednesday
- every Friday
- Trade Timing: 3:46pm ET
- Strike Selection
- 5 delta +/- 0.5 delta, closest to 5
- Position Exit:
- 50% max profit or expiration, whichever comes first
- hold-till-expiration
The nitty-gritty details and assumptions of the backtesting methodology such as margin collateral, margin calls, moneyness of positions, commission, slippage and more can be found here.
Let’s see how the strategy performs!
Backtest Results
Starting Capital
Since backtests are backward-looking, hindsight bias can be used to identify the starting capital necessary to achieve various leverage targets.
The rule of thumb is 20% of margin utilization = 1x leverage. Thus, using all available margin is comparable to 5x leverage.


Due to the dynamic nature of options, maximum margin utilization is not a linear function. In other words, the capital needed for 2x leverage is not exactly half the capital needed for no leverage (1x).
Compound Annual Growth Rate


Here we see the returns of BigERN’s strategy, namely the 5D 2x hold till expiration, outperforms 2 of the 3 benchmarks with regard to geometric return.
Since we know his leverage target is between 2-2.5x and thus the CAGR will be between 7.03% and 9.79%, we can reasonably conclude that his strategy outperforms or is on par with all relevant benchmarks.
[ERN: This is a slightly unfair comparison because it ignores the fact that my strategy is purely on margin whereas the benchmark portfolios eat up your entire margin cash. Specifically, with my put writing strategy, you have essentially all of your margin cash available to earn some additional interest income. But depending on how crazy you go with pumping up your yield, it will also increase the risk. 🙂 So, a fair comparison would have been to subtract a cash yield from the SPY/IEF benchmarks or add some interest-bearing asset to the put strategy returns!]
Meanwhile, exiting trades at 50% max profit lowered returns. This is from a combination of 1) lower premium capture, which we’ll see next, as well as 2) increased commission drag (the cost to close a position).
[ERN: Exiting the position early after earning 50% of the profit only makes sense if you immediately write another option so as to avoid any zero-delta days. In other words, if my Wednesday options already earned almost all their premium on Tuesday, I might as well close them and sell a new batch of options with either the Wednesday or Friday expiration. That will increase your revenue but also your risk!]
Premium Capture


Premium capture is the same across leverage targets, which is expected. By managing trades at 50% max profit we see average premium capture is closer to 50%.
Another way of looking at this table is: when holding till expiration, losses consume 44.57% of profits. When taking profits, leave a little less than half of the proceeds in the trading account for the eventual loss.
Speaking of losses, how often does this BigERN’d strategy lose?
Win Rate


Not very often – less than 4% of the time. However, those losses are substantial. Just 3.33% of the trades wipe out nearly half of the gains!
[ERN: Yeah, you got that right! The spirit of the strategy is “picking up nickels in front of a steamroller,” so the occasional loss can be substantial! It’s not “Picking up Benjamins in front of a baby stroller” for sure!]
There were 330 trades in the 5D hold-till-expiration backtest; 11 of them were losers. The average win was $13.29 and the average loss was $163.45. The largest win was $93.50 and the largest loss was $428.50.
[ERN: For comparison, I had 9 loss events during that time. During the high-vol periods, I normally reduced my Delta a little bit (as detailed in last week’s post) so, I might have avoided some of the losses along the way, though also at the expense of lower gross option revenue!]
Volatility


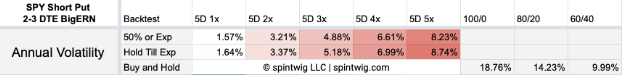
It’s easy to see that introducing and increasing leverage increases volatility.
BigERN’s strategy has 82% less volatility than a 100% SPY portfolio despite the strategy being based 100% on the SPY equity index. It even has 66% less volatility than a conservative 60/40 portfolio!
Sharpe Ratio
When we divide the compound annual returns by the annual volatility we get a number called the Sharpe Ratio. It describes a strategy’s risk-adjusted return, or how much return is generated per unit of risk.

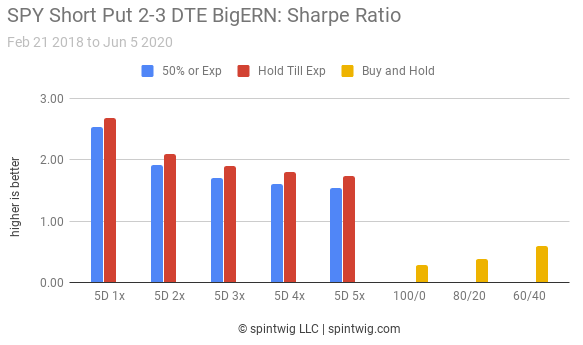


The BigERN strategy has a substantially higher Sharpe ratio than any of the buy-and-hold portfolios. Let’s dig a little deeper into the risk details to see what the max drawdown looks like.
Max Drawdown


The max drawdown of BigERN’s options strategy is a fraction of the benchmark portfolios. This is exactly what we want as it mitigates sequence of returns risk.
Overall Performance


BigERN’s strategy is highlighted in neon green. Commensurate with the high Sharpe ratio, the equity curve moves up and to the right while experiencing a fraction of the volatility associated with any of the buy-and-hold portfolios.
Discussion
BigERN’s strategy performance is pretty impressive and it appears to check all the boxes to solve the sequence of returns challenge – far lower volatility and ample returns. When we consider the fact that BigERN’s leverage target is a little above 2x, the bright green line is actually higher than all three buy-and-hold equity curves.
Despite the backtest duration being only 2 years and 3 months, there is a good mix of swift and deep declines along with strong and prolonged recoveries over the evaluation period. This timeframe should provide a decent survey of strategy performance over different market environments.
I’d like to turn it back over to BigERN to get his input and reaction.
OK, back to Karsten again:
In this day and age, everyone can just post on the web and showcase their awesome, foolproof strategies and how smart they are. But you lack credibility unless other people try for themselves and repeat and replicate your success.
That’s why I thought it was such a great idea to get Spintwig involved to perform an independent review. This was extremely helpful! Thanks for doing this!
Of course, I should state the obvious: my actual strategy, the way I implement it is still slightly different, for (at least) three reasons:
1: I don’t strictly adhere to the 5-Delta rule, as I outlined in last week’s post. Here’s my actual Delta over time. You can see that I started out with a slightly higher Delta but I’ve since scaled it back a little bit from a 6 to 7 Delta to a ~5 Delta. Also notice that occasionally I’m operating at a much lower Delta. Those periods coincide with the vol spikes (see the orange line, inverted scale on the right).


2: I occasionally trade some additional discretionary contracts, sometimes only intra-day, sometimes on the off-days (Tuesdays and Thursdays). I wrote about the philosophy last week!
3: I keep some additional interest and dividend-paying assets in my portfolio, so the margin cash isn’t sitting around and getting bored. So I like to look at both the put-option-only portion of the portfolio (comparable to Spintwig’s numbers) but also the total portfolio return with the interest/dividend-income-producing asset included. Over the same 2/21/18-6/5/20 time span, I had return and risk values just below the 3x strategy in Spintwig’s simulation even though I was running this at only about 2.4x leverage. I guess I added a little bit of extra return but also risk through my discretionary trades.

As I’ve mentioned here before, the biggest risk in my portfolio, recently came from holding some more exotic dividend-paying assets (muni bonds, leveraged muni bonds through closed-end funds and individual preferred shares), while the scary-sounding derivatives trading has a pretty low risk right now.
But despite all the differences, we still get qualitatively and quantitatively consistent results if we compare the ERN Puts Only strategy and the Spintwig 3x version.
A quick favor to ask before we get to the issue of last week’s market drop: Please head over to the site “Hack Your Wealth“. I chatted with my buddy Andrew on his podcast about FIRE, Sequence Risk, Safe Withdrawal Rates, the flaws of the 4% Rule and much more. I had a lot of fun and I’m sure you’ll all enjoy that episode, too!
A quick update on last week’s volatility spike
When I published my post last week on Wednesday I proudly declared how well the strategy has performed so far in 2020. Ironically, it took only a single day for Mr. Market to catch up and get me a little bit nervous. Shouldn’t have tempted the market Gods! 🙂
But fortunately, my portfolio survived the event. Just to be sure, it was a scary time, especially because the big drop occurred on Thursday, only one day into the 2-day option trade. But luckily, the market recovered again on Friday and only half my put options landed “in the money.” So the loss was manageable. Here’s the YTD P&L from the put writing strategy:

My strikes for June 12 we between 3010 and 3055. Since the index dropped all the way to 3,002 on Thursday we saw this significant intermittent loss on Thursday. But with the recovery on Friday I ended up with “only” half of my options in the money with strikes at 3050 and 3055. My other options with strikes at 3010, 3025 and 3030 were safe.
So, there you go! The strategy is still holding up pretty well despite the big drop last week!