


October 14, 2020 – Welcome to a new installment of the Safe Withdrawal Rate Series! 40 Parts already! If this is the first time you encounter this series, I recommend you check out the landing page here to find your way around.
Today’s post is about a question I’ve encountered quite a few times recently. If Sequence of Return Risk means that you face the danger of retirement ruin from liquidating (equity) shares during a down market early during retirement, why not avoid touching your principal altogether and simply live off the dividends only in retirement? Sounds reasonable, right?
But by solving the “running out of money” problem we create a bunch of new questions, such as:
- Will the principal keep up with inflation over a typical retirement horizon?
- Will your dividend payments keep up with inflation over time?
- How much volatility in the dividend payments would you have to expect?
So, in other words, the “dividend only” strategy – simple as it may seem – is somewhat more complicated than your good old Trinity-style 4% Rule simulations. In the Trinity Study, failure means you run out of money before the end of the retirement horizon – simple as that. With the dividend-only approach, failure can come in many different shapes. For example, you may not run out of money but the volatility of dividends could be too high and/or you face deep and multi-year (or even multi-decade!) long drawdowns in dividend income and/or you have to live like a miser early on because the dividend yield is so low. All those are failures of sorts, too. Then, how good or how bad is this dividend-only approach? Let’s take a look…
Before we get started
First, please check out my appearance on the Morningstar “The Long View” Podcast: Cracking the Code on Retirement Spending Rates!
![]()

Next, I want to stress that I wrote today’s post just out of plain, pure academic curiosity. It’s not meant as a “hit piece” targeting the “dividend crowd” who I sometimes clash with because I’m mostly a passive broad index investor. All my simulations here are for a simple, 100% S&P 500 portfolio, not a dividend-focused portfolio, nor a dividend-growth portfolio or whatever the flavor du jour out there may be right now. If you remember my posts from 2019 about the ill-fated “Yield Shield” approach (Part 29, Part 30, Part 31), I stated very clearly that the failure of the Yield Shield is mostly due to 1) higher risk and less diversification in the fixed income portion and 2) the severe underperformance of international stocks during/after the Global Financial Crisis. Replacing U.S. stocks with U.S. dividend stocks didn’t really hurt the Yield Shield during that time. Though, dividend stocks took a beating in 2020, more on that below.
In any case, let’s go ahead and answer some of the questions above. For dividends, I use the S&P 500 12-month rolling dividend series provided by Prof. Robert Shiller as part of the CAPE worksheet. See the source file here. I look at monthly historical data from 1871 to 2020 and historical retirement cohorts with a 30-year horizon.
Side note: The index in its current configuration has been in use only since 1957. Between 1926 and 1957, I’m using the S&P Composite with fewer names, and before that a historical reconstruction of the index all the way back to the year 1871.
Normally, that would mean that 1990 is the last retirement cohort I can simulate. But guess what? I like to extend the sample all the way to 2010 to include the market peaks prior to the dot-com crash and the Great Recession/Global Financial Crisis. So the last 240 retirement cohorts will have a slightly shorter and shrinking window of anywhere between 10 and 29 years. Still, long enough to display some of the stats I’m interested in, i.e., final portfolio value, the volatility of dividend income, etc. So, please keep that in mind: all cohorts between 1990 and 2010 have this little asterisk behind them!
Here’s the first issue I’d like to address…
Will your portfolio keep up with inflation?
Well, that’s an easy one. We simply have to plot the 30-year price return (i.e., without dividends) of one dollar invested and adjusted for CPI inflation. That’s what I do in the chart below. Most cohorts would have easily preserved their capital and even grown it quite substantially. The minimum and maximum final value are both due to the Bear Market during the Great Depression. 1902 was the low-point because your final value was the Bear Market bottom in 1932 and you’d lost about two-thirds of your purchasing power. But if you had started in 1932 you’d have grown your portfolio to 6x the initial value, even after inflation and even when withdrawing all dividends.


Most notably, though, for all retirement cohorts post-1920, the 30-year real price return was positive, so for every $1 in real starting value you’d have had more than $1 in inflation-adjusted dollars after 30 years. Hence, you would have preserved your capital in the worst case and likely would grown your nest egg to many times the starting value. In a way, that’s great news for the dividend strategy. But it also means that you might vastly over-accumulate assets during retirement. Which in turn means that you likely short-change yourself with your withdrawals. Withdrawing some of the principal early on would have been the better path.
What were the initial dividend yields?
In the chart below I plot the dividend yield in the S&P 500. I use the 12-month rolling, backward-looking dividend income as used by Prof. Robert Shiller divided by the S&P 500 index value. Notice that both dividend income and the S&P 500 month-end value are nominal values but since we’re taking the ratio, there’s no need to perform any CPI-adjustments. In any case, notice how volatile the initial dividend yields would have been. Prior to about 1950, we had huge swings in dividend yields, with an average yield of around 5%. But bouncing around between 3% and over 15%!

In the second half of the sample, dividend yields became a lot less volatile. But at a price; yields were also lower on average: around 3% in the 1960s and early 80s, a short step up to 5-6% again but then a final step down to around 2% for much of the last two decades.
This brings us to the next question…
Should we be worried about the low dividend yield these days?
When dividends are lower, should we worry about lower expected equity returns, then? Not necessarily! If I plot the Total Return of the S&P 500 since 1871 in the chart below, the black line very closely “hugs” a nice exponential trend (about 6.7% p.a.) depicted as the dotted black line, which is a straight line when using a log-scale on the y-axis. So the fact that we have slightly lower dividend yields starting in around 1950 and much lower dividend yields after 1990 (when the green line grows much slower) did not impact the total return much. The lower dividend yield was simply offset by a faster price return.
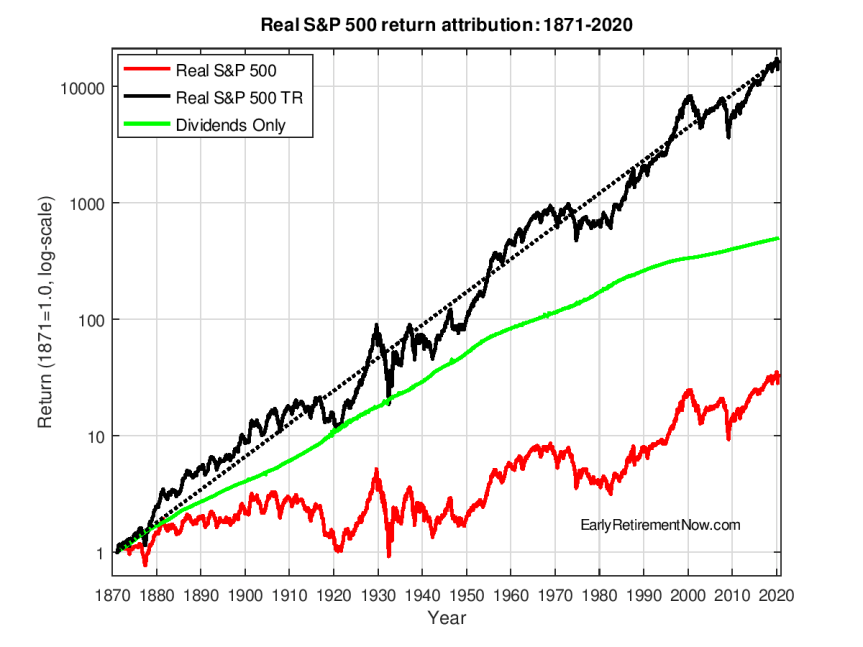
Another way of driving home this point, let’s look at the attribution of annualized total real returns into price returns and dividends over four equal time intervals, each about 37 years long. Early on, almost your entire total return came from dividends and very little from price returns. Over the final 37-year window the attribution was exactly the other way around, and very intriguingly, the significantly lower dividend yield was more than compensated through a higher price return resulting in the highest total return. So, low dividend yields are not a troublesome sign per se. If corporations simply hold on to their earnings and reinvest them to grow future profits, that’s perfectly OK.


But this was just a side issue. On to the next point…
How volatile was the dividend income?
There isn’t one single way to answer this question, but let’s start with a time series chart of the real dividends, normalized to 1.0 in 1871. Notice how there has been an upward trend over the last 150 years but it was a bumpy ride. I plot this on a log-scale to make the relative changes comparable across time. It looks like the price for the higher dividend yield early on was much higher volatility in dividend income!

I also like to plot a “drawdown chart” of the real dividends, i.e., how far has the dividend income fallen since its recent, expanding window all-time-high. See the chart below. Before 1950, you had some nasty, prolonged (multi-decade) drawdowns. So, if you were unlucky enough to start retirement in 1910 or 1929, you’d have to severely cut your retirement spending. By about 50% and you wouldn’t reach the initial level for another ~20 years. Ouch!

The drawdowns in the second half were slightly more benign. Only about 20% down from the all-time high during the 70s and 80s. But it still took 20+ years to reach the old all-time high. The dot-com bust and global financial crisis had relatively benign and short drops in real dividend income. But also keep in mind that the dividend yield going into the dot-com bust was exceptionally low – just about 1%.
Next, let’s look at the actual volatility of dividend income. So, for every retirement start date, I look at the 30-year time series of their real dividend income and calculate:
- The volatility (standard deviation) of the level of real dividend income, expressed as % of the initial portfolio value to make this comparable across time.
- The volatility (again, standard deviation) of the 12-month changes in real dividend income.
Let’s start with the volatility of the income level. That’s what I plot in the chart below. You had some nasty volatility throughout the entire sample, but especially in the first half. Notice that the vol is measured as % of the initial portfolio value. So, with a $2m initial portfolio, each 1% of volatility means $20,000 standard deviation in annual withdrawals. Quite substantial! So, the price of not running out of money is quite steep. Instead of a stable and predictable retirement budget you would have faced some pretty scary uncertainty about your exact budget over time.

A similar picture emerges when looking at the volatlity of changes, in this case the change over 12-month windows. Especially during the first half of the sample, you had double-digit percent annual changes. Some even as volatile as the S&P 500 index itself. But quite intriguingly, the volatility was very low again for the retirement cohorts between 1950 and 1979 (which again means that the annual dividend changes were really subdued between 1950 and all the way to 2009!).

I also like to look at the worst 1-year drop in real dividend income. So, in other words, by how much would I have to tighten my belt over a 12-month period. That’s in the chart below. Again, some of the most painful declines occurred early on. In contrast, retirement cohorts during the 1950 to the late 70s era had extremely stable dividend income. And again, that means over 30-year windows. So only when the 30-year windows reached the Global Financial Crisis era did you experience 20+% declines again. And also noteworthy: after the Global Financial Crisis, we haven’t even seen any drop in the real dividend income. At least not yet, but that will likely change. Dividend income will likely display a slight drop by the end of 2021.

Case studies
Always very instructive: I like to look at some of the historical cohorts that were badly impacted by Sequence Risk:
- August 1929: The stock market peak (at a monthly frequency) before the Great Depression.
- December 1965: One of the worst historical retirement cohorts due to the lackluster market returns between the mid-60s and early 70s and then the 1970s and early 80s malaise.
- December 1972: The peak before the 1970s mess.
- August 2000: The peak before the dot-com bust.
- September 2007: The peak before the Global Financial Crisis.
Let’s see how your dividend income would have evolved over a 30-year retirement (or a shorter horizon ending in 2020 for the 2000 and 2007 cohorts), see the chart below. Well, slim pickings here. All five cohorts would have started retirement with unacceptably low dividend yields between around 1% and 3.3%. What’s worse, the real dividend income, relative to the initial portfolio value would have dropped even more. To only about 1% of the initial portfolio in the early-2000s and about 1.3% in 2008. So, you started with a $1m portfolio but you only consume around $10,000 per year? Sure, you’ll not run out of money in 30 years but a retirement budget that lean is a steep price to pay. You might as well go with a Trinity-style 3.5% safe withdrawal rate which would have been ultra-safe in each case.

How about if you were lucky enough to retire exactly 24 months before the five prominent market peaks? The results look a bit more promising, especially for the 1927 cohort. You would have started with an initial dividend income level North of 4% of the principal. And you would have dropped to below 4% of the original portfolio level only for a few years, only to recover to 5+% and even close to 7% later in retirement.
But for the other cohorts, it would have still been a very lean retirement strategy. Despite retiring well before the peak you had trouble reaching the “magical” 4% mark. If you didn’t have any supplemental income this dividend-only approach is not really workable.

Valuation Matters
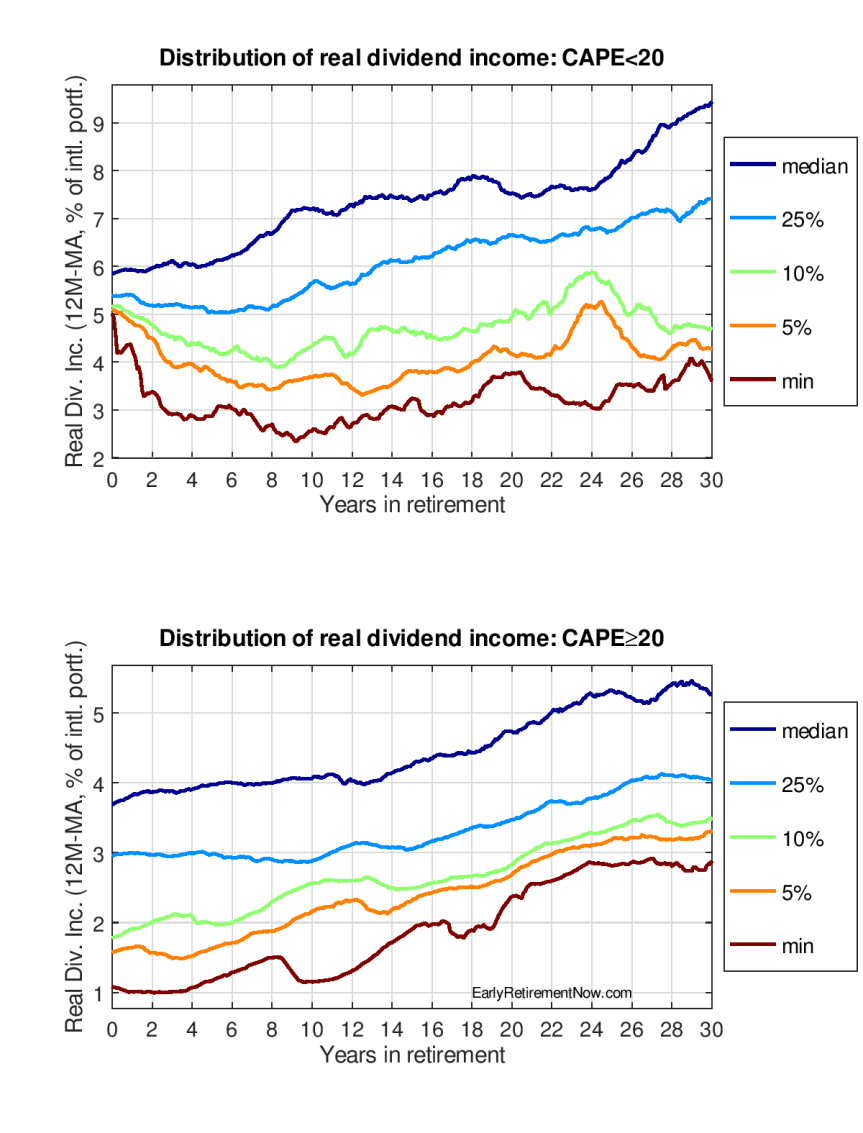
Another issue you’ll have trouble escaping with the Dividend-only method: equity valuations. Who would have thought?! In the two charts below are the percentiles of annual withdrawals (everything from the minimum to the median) over the historical 30-year windows, but I group the data into two bins: Once a low to moderate CAPE (<20) ratio at the beginning of retirment and once with the elevated CAPE ratios (greater than or equal 20). And results are pretty much as expected:
- If you retired when the CAPE was below 20, you could have started with an initial retirement budget of at least 5% or your initial portfolio. There was some possibility that you fall below that, even below 4% of the initial capital, but at a relatively low probability. So, the dividend strategy would have been completely managable and attractive in this environment. But keep in mind that the 4% Rule also never failed in history when the CAPE was below 20.
- If you retired when the CAPE was above 20, the dividend-only approach would have given you a pretty lean retirement. Even the median starts at slightly below 4%. And you have significant probabilities of some really, really lean retirement budgets along the way. It seems that this dividend strategy gets in trouble in the same environments as the naïve 4% Rule. So, we haven’t really found a hedge against Sequence Risk!

How about finding higher-yielding stocks?
Well, the S&P 500 is not yielding enough dividends right now and by the way, neither is the VTSAX/Total Stock Market Index, which is so popular in the FIRE community. Then how about focusing on higher-yielding stocks? Well, I thought I had already answered that question in parts 29, 30, and 31 of the series; higher dividend yield is not really a viable solution. You might even exacerbate sequence risk. Just to drive home that point, I created the chart below, where I plot the cumulative excess return of four dividend-focused ETFs over the S&P 500 total return index. The funds are:
- DVY: iShares Select Dividend ETF. Currently a 4+% yield. It also has the longest history of the four funds, going back to 2003!
- SDY: SPDR S&P Dividend ETF. Currently a yield just under 3%. Historical data go back to before the Global Financial Crisis.
- VYM: Vanguard High Dividend Yield Index Fund ETF. Currently a yield around 3.5%
- NOBL: ProShares S&P 500 Dividend Aristocrats ETF. Not much of a yield boost here. Only slightly above 2%.
Since they all have different start dates, they all start at 0% relative performance at their inception date and then run forward to September 2020. None of the funds outperformed the S&P 500. During the Global Financial Crisis and until about 2015, the three funds DVY, SDY and VYM had returns roughly in line with S&P 500. Some better, some worse than the broad index. Hence my verdict in the Yield Shield posts last year: higher dividend yield didn’t help you with Sequence Risk, but at least it didn’t hurt you either. But not so during the last five years and especially during the 2020 bear market. All the dividend-focused ETFs got completely clobbered, not just in absolute terms but also relative to the S&P 500.


Of course, the folks in the dividend crowd will always object that “smart investors” could have identified the “great” dividend stocks that do well and will never cut their dividends. To which I always reply with these three points:
- That makes you a stock picker and study after study shows that you can’t beat the market that way. Unless you believe that all the other stock pickers out there – large actively-managed funds, hedge funds, sovereign wealth funds, etc. – who all try to beat the market, somehow have never heard of the concept of a “dividend”. Nice try!
- But that said, you can certainly believe that you can beat the market by picking the “right” stocks. But then so can I: a portfolio with Google and Amazon (zero dividends) would have mopped the floor with your smart dividend portfolio over the last 10+ years. Hindsight is beautiful, isn’t it?
- Two of the dividend ETFs already do what folks in the “smart dividend” crowd claim will be the panacea: both SDY and NOBL identify stable and solid corporations that have a long history of paying, maintaining, and growing dividends. And they also lagged behind the broad index.
But again, I promised above that I don’t want this to turn into a hit piece, so I will stop here. I will save the real hit piece for a separate post. 🙂
Final verdict
I can certainly think of examples where LOYD/”live-off-your-dividend” works well. If you still have some income early in retirement – part-time work, the spouse still working, income from a blog, etc. – but you plan to slowly phase out that activity over the next 10-20 years then you can reasonably expect that your dividend income will eventually catch up with your needs. And you’d be able to leave a very nice-sized final asset value to your heirs. Much higher than the $0 target in the Trinity Study!
But for the rest of us, probably for most folks in the early retirement crowd who don’t have a six-figure income from a blog, the LOYD approach will likely not work in today’s dividend environment. The current S&P 500 yield, just under 2%, is too low and I don’t need to grow my nest egg anymore going forward. I’d much rather consume and withdraw a little bit more today and leave a smaller bequest to our daughter. I’d be completely content leaving “only” about 25% or even 10% of our current net worth to our daughter. That’s still a nice chunk of cash that will help her get a nice jump start in life but not enough money to turn her into a spoiled trust fund princess.
To conclude, most retirees will do better hedging against Sequence Risk through a diversified portfolio with somewhere around 60-80% equities and the rest in safe(r) assets; cash, government bonds, etc. But that said, keep in mind that a glidepath approach (see Part 19 and Part 20) has a similar flavor to the LOYD. Think of the bond portion as funding the difference between the dividend yield and your retirement budget early on. And by the time you’ve depleted the bond portion, the dividend income is likely high enough to (almost) fund your entire budget. So, the dividend approach works out in that way. And hat’s the perfect, nice conciliatory note to end this post today!