
Update: We posted the results from parts 1 through 8 as a Social Science Research Network (SSRN) working paper in pdf format:
Safe Withdrawal Rates: A Guide for Early Retirees (SSRN WP#2920322)
If you’ve been following our series on withdrawal rates (part 1 here) you have noticed that we’re quite skeptical about the 4% rule. That would be especially true for early retirees with a much longer horizon than the standard 30 years. Though, by reading through some of the research from the heavy hitters in the retirement research world, even the foundation of the 4% rule over 30 years seems to be crumbling a little bit:
- Wade Pfau has been warning that due to high equity valuation and low bond yields the Trinity Study success rates are likely overrated. His argument is similar to ours in Part 3 of this series: we live in a low return world now and comparisons with past average returns could overstate the success probability of the 4% rule. He uses a slightly different methodology (Monte Carlo simulations) but reaches similar results.
- Even Michael Kitces, arguably one of the great defenders of the 4% rule, has (inadvertently?) demonstrated that the 4% rule over 30 years isn’t all that sound. In the discussion after the famous “ratcheting post,” some readers (including yours truly) pointed out that we can’t replicate the success of the 4% rule with 1965/66 starting dates. Nothing to worry about, Kitces replied, all you needed to do is to use a very short-term bond (1-year T-bills) for the bond allocation, and you sail smoothly during the 1970s. Who would put 40% of the portfolio into 1-year Treasury bills (essentially CD interest rate) rather than trying to harvest the term premium of longer-term bonds? Very easy: someone with 20/20 perfect hindsight who knew that longer duration 10Y bonds will get hammered in the 70s and sink the 4% rule even over a 30-year horizon.
And I just became a little bit more skeptical about the 4% rule even over a 30-year horizon! But there is (at least) one prominent 4% SWR firewall still standing. In countless blog posts, discussions, forums etc. I have heard this quote (or variations of it):
“The 4% rule worked just fine during the Tech Bubble and Global Financial Crisis”
Let’s shine some light on that claim.
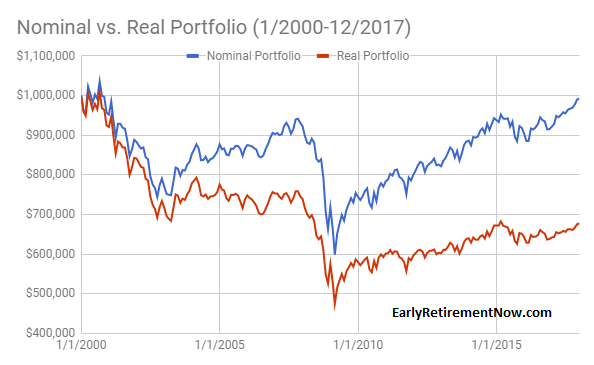
Real Returns 12/31/1999-12/31/2016
The first suspicions about the validity of that claim came when I looked at the average returns in equities and bonds since December 31, 1999, and they didn’t look so appealing. Equities (S&P500, dividends reinvested) returned only slightly more than 4% p.a. in nominal (!) terms, and 2.36% p.a. in real, CPI-adjusted terms. How can that justify a 4% withdrawal rate? Isn’t the real portfolio return supposed to be roughly equal to the real rate of return to make this work? Below we plot the cumulative returns (before even withdrawing anything!) of different Equity/Bond portfolio mixes, adjusted for inflation.

Note, these are already the returns taking out 0.05% p.a. in ETF expense ratios, hence, the 100% equity portfolio return dropped from 2.36% to 2.31%. None of these portfolios would have stayed even close to a 4% real return target over time. Every month and every year we stay below that black line we dig deeper into the principal. When someone wants to tell me that the 4% did well since 2000, that doesn’t even pass the smell test.
ERN Simulations
So, without simulating anything I already know that the 4% rule would not have fared very well and you would have wiped out some portion of your principal. How much? Well, let’s run the ERN simulations and see for ourselves. Since we started this series I updated the realized returns all the way to December 2016 (Parts 1 through part 5 used realized returns only up to 9/30/2016). Let’s see how the 4% rule would have performed under different portfolio allocation assumptions. We also took the liberty to extend the equity and bond returns beyond the first 17 years. As described in our initial SWR post, we assume that future real equity returns are equal to the average real return since 1871 (about 6.6% p.a.). We now assume that the bond return is going to be equal to the 12/31/2016 10Y nominal bond yield (around 2.5%) minus 2% inflation = 0.5% p.a. real for the next 10 years, then also returning to its long-term average of 2.6% real.
Side note: That’s actually a pretty aggressive estimate for future returns given that the CAPE is so high! Recall our post from last year, where we plotted the current CAPE earnings yield (=1/CAPE) vs 10-year forward equity returns: If the CAPE is above 25 (yield <4%) the 10Y forward equity return never exceeded the 6.6% mean real return, see chart below!

Below is a time series chart of the real portfolio value over time for different equity portfolio shares between 50% and 100%. A portfolio would have taken a serious hit after 17 years: In real terms, the portfolio is down by anywhere between 30% and 75%.

But can the portfolio recover? Well, of course, it can if stocks go up by between 50% and 300% in the next year. But even the somewhat optimistic assumption of 6.6% real equity returns over the next 13 years will only further deplete the portfolio, see the downward-sloping portfolio values starting in 2017.
Next, we can also calculate the SWRs that would have exactly matched a specific final value target after 30 years. Again, that’s using the 17 years of actual return data plus the 13 years of return forecast. See chart below:

In January 2000, you could have withdrawn 4% or more if you weren’t too aggressive on the equity allocation and you’re OK with running out of money after exactly 30 years. 4% probably wasn’t such a bad assumption for regular retirees who were 65 years old in 2000. But early retirees? You probably want to ensure that you have about 75-100% of the initial principal available half-way through your retirement. Depending on the equity weight, 2.6-3.1% for capital preservation and 2.9-3.5% for 75% capital preservation was all you could start withdrawing in 2000. And that’s under the somewhat rosy assumption of 6.6% real equity returns for the next 13 years (despite elevated CAPE ratios) and zero volatility along the way. Not a pretty picture! If anything, the 2000-2016 episode was a worst-case scenario for early retirees. Quite the opposite of the “4% rule did OK” myth.
Welcome to the Potemkin Retirement Village: Successfully using the 4% Rule since January 2000!
So, how can one still claim that the 4% rule is A-OK after 2000? We’d have to be deceived by a financial Potemkin Village. I gathered some examples below:
Potemkin Village #1: Michael Kitces’ post on the topic
Just to be clear, I am not saying that Kitces wants to deceive anybody in his post on the 4% rule post-2000. He’s obviously an extremely smart guy and puts out very fascinating material. I also found that he’s very kind and gracious in replying to questions and requests.
But his post on the matter is still a Potemkin Village. All the pertinent information is in that post. It’s all 100% accurate, completely confirmed by yours truly. Everybody who wants to get an objective picture of the 4% rule in the 2000-2015 period will walk away with the exact same information that I saw:
- The 4% rule worked probably all right for the average 65-year-old who retired in 2000. That person may make it through to 2030, especially considering that the person is now 82 years old and may curb consumption a little bit, in line with losing almost 40% of the real portfolio value. Not so much, though, if there are medical bills piling up and withdrawals actually grow faster than CPI!
- But the average early retiree would have trouble making the 4% rule work. By 12/31/2016, only 17 years into the retirement you would have wiped out a big chunk of the portfolio as we show in our calculations above and even then you have to cross your fingers and hope for above average equity returns, something unprecedented when the CAPE is at 28. Good luck with that!
But how about folks who don’t want to see the faults in the 4% rule? Say, someone who has a predetermined conclusion that the 4% rule worked great in 2000 even for early retirees. If that person reads the Kitces article he/she will come to the exact opposite conclusion. See the following chart, here reprinted with permission:

Kitces used a 60/40 Stock/Bond mix and now it looks like the year 2000 cohort is back to maybe $930,000. Doesn’t look so bad, right? That proves the 4% succeeded during that time! Not so fast: read the fine print! This is the nominal value. $930,000 in nominal terms means that the real value is down to somewhere in the low $600,000s, consistent with our calculations.
Also, right after the Kitces post (July 2015) the portfolio value is trending down, see our time series chart above. Recall, that our calculations take into account the pretty impressive 2016 equity return (12% with dividends!) and we’re still continuously melting away our principal! That’s because the 4% withdrawal rate has now grown to a 5.7% to 16% withdrawal rate (depending on the equity share). Remember, there’s only between 25 and 70% of the portfolio left, so the withdrawals are now higher relative to the principal (4%/0.7=5.7%, 4%/0.25=16%). You will eat into the principal even more during the remaining 13 years (and we are not even taking into account equity volatility and Sequence of Return Risk). It may all still work out for the traditional retiree with 13 years to go, but not for the early retiree with 40+ years to go.
Update 2/27/2018
I ran the simulations all the way to the end of 2017. Now the nominal value is almost back to $1,000,000! But the real value is still depressed at less than $700,000 and below the peak in early 2015. Despite the impressive equity performance in 2016 and 2017!
Potemkin Village #2: The Stock/Bond Allocation
Recall the “ratcheting post” from Kitces, written in June 2015? Compare that to the post about the 4% during the post-2000 period, written only a few weeks after that, and you will notice one subtle difference:
- In the ratcheting post, the 4% rule worked during the 1970s because the 40% bond allocation was invested in short-term bonds (1-year T-bills).
- In the post on the dot-com bubble and global financial crisis, Kitces uses a 10-year Treasury bond.
If you had followed the advice from the ratcheting post and invested in 40% short-term bonds starting in 2000 you would have lost the beautiful diversification benefit of bonds and you would have missed out on the big bond rally. The nominal portfolio value would have gone down to just under $500,000 in nominal dollars and below $350,000 in real, CPI-adjusted dollars by December 31, 2016. Good luck making that money last until even 2025. If you haven’t cut your consumption yet, the annualized rate of withdrawal would be almost 12% now. To bring back the withdrawal rate to a more manageable 4% we’d have to cut withdrawals by about two thirds!
I wonder if all those who tout the 4% rule as so safe realize that in the most optimistic interpretation it will involve timing the bond vs. cash allocation. Better get your term premium model up and running, everybody! And the worst possible interpretation is that the success of the 4% rule is based on some pretty blatant data snooping and hindsight bias, even for the traditional retiree with a 30-year horizon.
Potemkin Village #3: The Trinity Study
Strictly speaking, the Trinity Study indeed covers the DotCom bust and the Global Financial Crisis. And it shows that the 4% rule is safe. But only towards the end of their 30-year windows. To my knowledge, the most recent installment of the study is from April 2011 with data covering 1926-2009. Therefore, we don’t have any data about the year 2000 retirement cohort yet. Strictly speaking, it will take until December 31, 2029, to get word from the Trinity Study about whether the 4% rule worked with the January 2000 starting date. What if that cohort already runs out of money in 2025? We show that is a real possibility unless stocks return more than their historical average going forward. Will the Trinity Study still be quoted as the defender of the 4% rule for the early 2000s until they actually confirm it didn’t work?
Summary
The often quoted statement above needs a few important qualifiers for us to agree with it:
The 4% rule worked just fine during the Tech Bubble and Global Financial Crisis IF:
- You have a 30-year retirement horizon.
- You are comfortable depleting your money at the end of that horizon and/or significantly cutting your real withdrawal amounts.
- You had a relatively low equity portion (60% or less).
- You are not a passive investor but rather have the foresight to time long-term vs. short-term bonds. Specifically, you needed the ability (or dumb luck?) to implement the exact allocation that didn’t work in 1965/66 and avoid the allocation that did actually work quite beautifully in 1965/66.
- Did we miss any other qualifiers? Please let us know in the comments section!
This is great work, and I think that this series is going to be a very useful (and detailed) addition to the 4% rule conversation for a long time. The depth of this analysis shows how complex the 4% rule really can be, and it hopefully highlights the risks inherent in any rule of thumb. I do think a lot of folks who chase the 4% rule are hoping to easily solve the retirement problem with a no risk solution – the whole point is that you need to understand risk to understand how this works.
Thanks for a great series of posts – looking forward to the finish!
Thanks! Glad you like our series!
More awesome stuff, ERN!
You nailed it when talking about the hindsight bias embedded in many defenses of the 4% Rule, as well as the fairly selective use of data. (Though that data selectivity goes both ways. I think Pfau, et al. do some pretty weird stuff in their critique of the 4% Rule/Trinity Study.)
The 4% Rule has become something of a beacon for people – a quick and easy way to calculate nest egg needs. Which seems to go some distance in explaining the fervor in defending it and in ignoring or discounting its very real weaknesses.
Luckily, as you’ve demonstrated, it doesn’t take too much in the way of reducing initial withdrawal rates to make a big difference over a 50+ year horizon. And portfolio allocation, naturally, makes a tremendous difference.
The work you’re doing/have done here is outstanding. I hope people take notice and take your findings into account in their planning.
Now, tell me about this Potemkin Village place…It sounds nice, but what are the HOAs like, and is there a pool?
Thanks, ERN!
Haha, thanks FL! The HOA fees are quite low. That’s because the 24/7 concierge staff, personal trainers, security, etc. are all paper cutouts. They all work for essentially pennies a day! The pool is planned for December 2029. Stay tuned!
Yes, exactly, the hindsight bias is everywhere. Probably even in my work. Who knows, maybe an equity-heavy portfolio that worked well during the last 145 years isn’t the best way for today’s retirees. But at least there is some economic rationale for long-term stock returns to beat bonds…
Thanks for stopping by!
ERN
One thing I am confused about is the optimal portfolio allocation. It seemed like in earlier posts in thsi series that an allocation of 80 – 100% of stocks performed best, but from above it seems like that allocation would have performed very poorly. Am I missing something?
The January 2000 cohort would have done better with more bonds. Over all 1,700 retirement cohorts I considered, the higher equity shares would have done better over 60Y horizons than the low equity shares.
But again: Even with 80-100% stocks there were failures and many of them occurred around Jan 2000.
In fact, Jan 2000 saw such an out-of-whack CAPE ratio you’d have been crazy to even withdraw 3% initially. It would have been wiser to start with somewhere in the low 2% and then scale that up in the mid 2000s.
Great post ERN.
You might need to take this Kitces bloke out for a beer though, he’s going to need one after being taken down like that.
I think the 4% rule is a bit of a Siren’s song for the masses, people cling to the easy answers to give them hope of escaping their current circumstances. A bit like what is offered by televangelists, late night tv infomercials, and in the gold rushes of days gone by.
A wise man once said “if something sounds too good to be true, it probably is”. You’re certainly demonstrating that here with this compelling series of data driven posts.
Ha, that’s a great suggestion: I should have a beer with Michael Kitces. He seems like a nice guy. Also my criticism is not so much targeted at Kitces, but more at the folks who use his research and misquote and misinterpret it.
Great analogy with the televangelists. Some Financevangelists sell the idea that 25x spending leads to salvation, then who wants to listen to us old cantankerous guys (pun intended) who recommend 30x?
That makes me think: We are doing this all wrong: Let’s propose that 20x spending is A-OK. Or why stop there: 17x, or 15x. Then we can grab all the attention! Just kidding, of course. 🙂
Have to disagree Slow Dad. The 4% rule is still a FANTASTIC starting point from an educational and introductory perspective. That’s all it is, a starting point, but nothing nefarious like televangelists. Also, the authors of the Trinity Study themselves said that it was an academic exercise: they didn’t want people to start quoting 4% everywhere! The authors stressed flexibility and adaptation above all else. I’d urge you and ERN to read interviews with the authors, and not just the Study itself.
The televangelists/Financevangelists are not Trinity/Kitces but mostly those in the blogging community who want to take the Trinity/Kitces results too literally…
Why? I’ve commented before that I’ve only read a few articles on this over the years (mainly in _AAII Journal_ and _Financial Planning_). Perhaps as a result of this, I fail to see what’s so special about 4%: because it’s an integer? Use 3%. It’s an integer too, and would seem to get rid a lot of the risk inherent in the possibility that 4% is an overzealous exaggeration.
I love the series and all the valuable resources you are putting together for us, ERN! I think you are hitting on some very good points that early retirees need to be aware of. The 4% rule has major qualifications to it and I know it won’t work for us. We’ve dismissed it a while ago and are more focused on a 3-3.5% SWR. I’m looking forward to Part 9 now, as another consideration we are willing to make is withdrawing less during down market years. We’ll have the ability to cut back on more discretionary expenses like travel or perhaps even do a couple small jobs to earn side cash to help offset the down market.
But either way, a long retirement for us early retirees presents significant risk. Especially after reading Fritz’s recent post over at Retirement Manifesto regarding living to a 100! I completed the survey and it concluded I would live to 97. We’ll see if I have that fortune or not, but that would mean a roughly 60 year retirement! I can’t afford to erode my principal in early years.
Thanks Green Swan! Awesome, 3-3.5% looks like a pretty safe number. Well, in 2000 that was a crazy time with a CAPE at 44. Back then, even 3-3.5% would have been kind of too high. But today that looks like a good compromise!
And yes, I saw Ftitz’ post on longevity and don’t feel so bad anymore about using 60-year horizons. Especially for joint survivorship, that should be the norm now!
Cheers!
Glad to see this fantastic series progressing. I think the reason the four percent rule is clung so tightly is people in mass prefer a sound bite. 3.25 doesn’t sound as sexy as 4. ;). But I digress. I’m honestly thinking given the poor state of the masses retirement in this country at some point the government will change the rules. I just wish I could guess how before it happens.
Haha, Thanks, FTF. You’re right 3.25 sounds awful. Or 30.77x annual spending. 25x is such a noce round number. 🙂
That’s a major concern, too: What happens when a populist government in need of more revenue takes away some of the preferential tax treatments? Unfortunately, there is no simulation, no cFIREsim for that.
Cheers!
Perhaps I never understood a definitive definition of the 4% rule. I imagined the rule as intending to be a reliable 30 year amortization of a 50% stock and 50% bond portfolio. Since I expect to spend more than 30 years in retirement, I never took the 4% rule seriously.
I do agree that, with high stock market valuations, total returns going forward are likely to be no more than a nominal 6% max. For my own purposes, I assume a 4.5% return from a diverse portfolio including mundane income oriented investments and 2.5% inflation. From these assumptions, I can do an NPV calculation of any specific life expectancy. My biggest risk is of course the very linear nature of my assumptions.
Alternatively, you can try to live off of our dividends (2008-2009 not withstanding). I would expect dividends for the broad stock market to increase at least at my assumed 2.5% inflation rate. With current stock market yields of ~2% and 2.5% dividend growth, a 4.5% total stock market return seems reliable if stock market valuation don’t change to much.
I would be interested in a future blog posts around dividend growth as an effective inflation hedge and the viability of long tern NPV calculations with the high yearly variability of inflation and market returns.
Living off dividends is a cool idea in theory. If we could find a way to get a yield as high as 3.5-4%, then cross our fingers that during a future recession the cuts in dividends are not as bad as in 2008/9 and we ignore the temporary fall in the principal we will probably make it through all right. My concern with all the dividend yield strategies is: is that a “crowded” strategy now? Will that underperform for the next decade because it’s overbought now? Have to mull that over more. 🙂
ERN, This is a ‘magnum opus’ kind of work. With this series, FL’s expositions on financial markets and factors impacting future returns, and my new Investing series on Dividend vs. Indexing, there is now a substantial body of new work in the PF blogging world that rivals anything the mainstream finance can come up with. It’s my pleasure and honor to be your ‘co-worker’ in this effort 🙂
Haha, exactly! That’s the way to go: Crowdsource our financial research. At least it’s free from conflict of interest! Thanks, TFR!
I really value the thoughfullness and analysis. Is giving me a lot of comfort on being able to retire soon.
For part 10 it would be very interesting so see the long term safe withdraw rates for an internationally diversified portfolio. I think it would benefit both for non us citizen, but also yield very interesting outcomes as the US has been in the strongest bullmarket and has gone from an emergin power to being the global superpower, with the strong equity returns that go with that, which might not necessarily be the right guide for the future.
Thanks!!!
The international diversification aspect has definitely been on my mind. Unfortunately we don’t have all the return data going back to 1871. But I am contemplating doing a case study for the 2000s with international equity returns and probably even 1970s if I can get my hands on return data. Stay tuned!
Some sources argue that foreign stocks do not actually provide much diversification from SPX (R^2 ~ 0.70). Of course it will vary depending on what specific period is studied, but if common wisdom is that international equities provide significant diversification then I’d like to see another analysis to confirm.
Timely post, as I am writing about redundancies and contingencies as it relates to several important topics, including home heating and early retirement. Starting with a 4% “S”WR might work out if you’ve got appropriate Plan Bs. Best to be prepared for a 2000-like scenario, particularly with the valuations we enjoy today.
Great work here again, as always. This series will be remembered in the annals of history as the writing and research that really launched your site into the stratosphere.
Cheers!
-PoF
Thanks, PoF! Yes, there’s the need for plan B (and C,D, etc.) when we have a 50+ year horizon ahead of us!
And I’m not even implying that today we are anywhere close to the crazy valuations as in 2000. But that’s the point: if we are prepared with a strategy that would have worked over the last 16 years – lower WR, supplemental income, etc. – then we should expect it to work over the next 16 years!
Thanks for stopping by!
Apologies if I’m mistaken, but did I not miss the blog post on variable withdrawals?
The problem with all these white papers and fancy graphs is that they don’t take into account real life. In real life, people have flexibility. It’s not like early retirees in 2002 were like “Oh, I guess I’ll just keep withdrawing using the 4% rule.”
No! They decreased expenses during those years when stocks were getting hammered and maybe even went back to work for a bit in the coming years. The authors of the Trinity Study themselves even said that it wasn’t meant to be rigid.
We don’t have the post on variable withdrawals yet. I also like the idea of flexibility and will apply it in real life in my own retirement. I would cut withdrawals if the market doesn’t cooperate early on.
But calculations like ours are still useful: By how much would the early retiree have to cut withdrawals when the market tanks by x? By x, or by x/2 or x/10?
Anyway: as I have always said, my criticism is not so much directed at the Trinity Study and Kitces, but more at the people who misinterpret the results.
Excellent series of posts.
Some areas for consideration to increase the potential SWR.
With regard to variable withdrawal, testing the Guyton Klinger ‘Decision Rules’ would be very interesting.
The original findings suggest significantly higher withdrawal rates are sustainable with this strategy
http://cornerstonewealthadvisors.com/decision-rules-and-maximum-initial-withdrawal-rates/
It would be interesting to see if you can replicate a similar increase in your own SWR results.
Another area which is claimed to lift SWR is Dynamic Asset Allocation as discussed by Michael Kitces.
https://www.kitces.com/april-2009-issue-of-the-kitces-report-dynamic-asset-allocation-and-safe-withdrawal-rates/
You made a slightly worrying observation about Kitces choice of bonds being selective in some of his research. Would you consider modelling SWR results using a dynamic asset allocation strategy to see if your results support this approach or not?
To the best of my knowledge, no-one has yet researched and combined the Guyton Klinger Decision Rules with a Dynamic Asset Allocation, so the potential SWR possible is as yet unknown. If you were able to model results that implement both strategies combined to determine the combined potential increase in SWR, then I think this would be a first in SWR research.
Finally, an allocation to gold. Various asset allocations can be tested on portfoliocharts.com, and even a modest allocation to gold appears beneficial to SWR and reduces worst case portfolio drawdowns. However the same results are not always apparent on other portfolio testing resources, so the benefit is certainly not conclusive. However most published SWR research assumes only equities and bonds and possibly cash or cash equivalent allocations, so this may also be worth exploring.
Your results would be of much interest given the rigour with which you approach your analysis.
Thanks! I noted your suggestions. I might be able to get my hands on the gold return series going back to 1871.
I put the Guyton Klinger methodology on the to-do list.
Kitces is an accountant. I trust his judgement on anything accounting related. But I would argue he has nothing of value to say about dynamic asset allocation. In fact, dynamic asset allocation is what I do for a living in my day job. It’s a lot harder than what Kitces puts out…
I added both gold and cash as potential assets in the Google sheet, mentioned in Part 7. Turns out, Gold in small amounts lowers the failure probabilities. Very intriguing!
This is an amazing series of articles and tremendously helpful for those of us near or in retirement. It has assured me that I can safely retire and also convinced me that I should use a somewhat lower withdrawal rate than I had planned, at least to start, perhaps 3.25 or 3.5%.
In 2015 Michael H. McClung published a book called Living Off Your Money in which he tests numerous withdrawal strategies, including annual rebalancing, Guyton rules, bonds first, etc. and ends up recommending two fairly simple strategies, which he calls Prime Harvesting and Alternate Prime Harvesting, as generally providing the highest SWR. It would be very interesting to see an independent test of these two strategies, which I don’t think has been done yet.
Thanks! Will take a a look!
Great article ERN. Very interesting analysis. Disturbing how slight changes in bond composition makes all the difference. Even with a big data set like the one we have we have to remember it is back tested. There is a non zero chance that economic conditions will eventually come up that defeat the 4% or whatever % rule. In a 50 year retirement, a 40 or 50% draw-down is just not mathematically acceptable, even if it technically “works” in the long run (and as you point out it may not).
One thing that got my philosopher brain thinking is that every so often we are going to his these times in history where the 4% rule either breaks or comes close to breaking, and when it does there are going to be huge cohorts of people affected. It’s not like the failure is evenly distributed, it’s all people that retired in a particular year. I wonder what effect this has on the job market? Essentially you have a lot of people that probably need to go back to work, all competing with each other (and also much younger, cheaper workers) in a time of presumed national economic stress (a recession). The economy at large may be big enough to make this a non factor, but my sense was this was very real in 2009.
Thanks, Happy Philosopher! You raise a great point. People who just saw their portfolio decimated might want to head back to work. We definitely saw that in the Global Financial Crisis: labor force participation remained quite high even for very old workers. So, personally, I wouldn’t want to bet on that finback to work option in case the portfolio drops. Too many other retirees will try to do the same. Another reason to pick the withdrawal rate conservatively!
Cheers!
Funny aside, when I read quickly I thought you wrote Pokemon village!
Pokemon village? Haha! No, that’s part 9 of the series. 🙂
Thanks for all of this work, data and simulations… Although we calculate FIRE right now with the 4pct rule, it is clear that this does not mean we will pull the plug. In our ideal life, there is always some work (yes, I did say that) that motivates us and brings joy and purpose to life.
Having read your work, I am now more than ever convinced that this is the right way for us to go: use the knowledge we have gathered to start the ideal life sooner, not when we reach FIRE.
Thanks ATL: Who knows, maybe by the time you retire the CAPE is already more “cooperative” (<20) and the 4% rule has a 100% success rate in the past history. Still no guarantee for the future but a good indicator for success. 🙂
Cheers!!!
fingers crossed. Knowing that also means you can tweak your start date of FIRE. I see more opportunities to use it to my advantage than as a constraint.
Well said! Thanks for stopping by, ATL!
I can see the folly in starting retirement with CAPE of 44. Data for US SPY CAPE is widely available. Is there an easy way to get the current CAPE for International Developed stocks and International Emerging stocks. Would be curious to see if there would be any difference in the outcome if rebalancing was carried out.
Recommended by my blogging friend FinanciaLibre (http://www.financialibre.com/where-to-find-superior-stock-returns/), see this page:
http://www.starcapital.de/research/stockmarketvaluation
Of course, this is only a snapshot not a time series.
Hope this helps!
The issue here is a simple one: you’re modeling stock portfolios that are concentrated in one asset class – US large companies. If you own a diversified portfolio, as you should, investors have done great with 4% (or 5% in my example to include advisor fees) since 2000: http://bit.ly/2mJcf7M
Realize, too, in my allocations I’ve modeled SHORT-term bonds which (a) haven’t seen nearly the run up as long-term bonds and (b) are more appropriate for retirees given better inflation sensitivity.
PS – small/value diversification was just as beneficial in the 1970s
Nice tool!
But: Your proposed portfolio is not diversified. It’s actually extremely undiversified with a strong small cap and value bias. Incidentally, these are the styles that indeed performed very well during the early 2000s. Someone who was not privy to that information in January 2000 and used the S&P500 was less successful as I show. And someone who might have used a portfolio with a strong growth tilt instead of a value tilt would have gotten hammered even worse than the S&P500 investor. What worked beautifully during the last two recessions might not work so well in the upcoming downturn. But I still wish you and your extremely undiversified portfolio the best of luck. 🙂
“Extremely undiversified”? It owns about 12,000 stocks in 45 countries, and bonds across all developed markets (not just concentrated in the US). And unlike S&P 500 indexes and Total Market Indexes, which have almost all of their weight in one asset class – large cap – the portfolio I show is much more evenly distributed across big/small and growth/value. The very definition of diversified.
PS – small/value has done well…since 1928 in the US and 1970 in non-US markets, as far back as we have data. If you didn’t/don’t know about it, you’ve got bigger investment problems than deciding on a 3% or 4% spending rate.
If you want to retire early, and expect to survive a 1970s or 2000s style market, you better know the Fama/French research inside and out
I know Fama-French probably a bit better than you. So, yes, I am aware of the size and value premium. I am also aware that there is the big push of “factor investing” and as more and more people want to capture those “premia” they are now being arbitraged away. For example, over the last 10 years, your value/small tilt did much worse than a simple 80/20 portfolio. Calculated with the same tools you used (80% IVV, 20% IEF). So, Eric, believe me as someone who holds not one but two 3-letter designations (the same you hold plus a Ph.D.), I am thinking about those issues.
But as I said before: Best of luck with your small-value tilt!
Did I understand you correctly that the Fama/French model is now defunct (size/value are no longer primary determinants of return) because a single asset class stock (S&P 500) and longer-term bond (7-10 years) mix beat a globally-diversified, multi-asset class, short-term bond centric portfolio over the last 10 years? A period where US large stocks were the best relative performers in the market and the TERM premium was 3x its average historical rate? You can’t possibly be saying that with even a cursory knowledge of the research, but I can’t determine what else your comments would imply?
And you’re supporting that point of view with an observation that more index funds/ETFs are now availble to invest in those stocks? Surely you realize that the vast majority of their assets are coming from actively-managed funds with the same or similar value/small stock exposure? Right? What you are describing is simply a transfer of management style WITHIN the same stock asset classes. Nothing more.
Care to explain why the index returns on the market and Small value from 1928-1990 (the “research period”) of +9.4% and +12.4% are indentical to the live-fund returns on Vanguard Total Market and DFA US Small Value since DFSVX inception in 1993 – +9.2% and +12.2%? Chance I guess?
Also, here’s the returns of the multi-asset stock allocation vs large cap index ETFs since 2006, adjusted for geographical diversification. Well within the bounds of what we’d expect over a 10-year period, about 1% a year higher returns for the diversified approach:http://bit.ly/2mtJdYY
No, I never said that. For the record: The Fama-French model is intact. You seem to lack the basic understanding of finance (and logic in general???) to even recognize the difference between:
a) the Fama-French factors as independent variables in a factor regression, and
b) the Fama-French style factors as alpha generators.
I only critized the use of FF as b) not as a). Do you want to go on the record and stating that our discussion here is about issue b not a? Can you confirm that, please?
So, you can cherry-pick your asset allocation all day long. I know all the periods when the factors worked and when they didn’t work. The main question is: Do we all believe that in the future we can keep milking the factors that worked quite beautifully in the past? Are there fundamental drivers that make this work? My theory: Once everybody starts using them their excess returns will diminish. Time will tell. I can just tell you that if I told one of my clients to shift into your proposed portfolio because “it’s more diversified” I’d be laughed out of the room on a good day and I’d be fired on a bad day.
But here’s one olive branch to you: I will look into the size/value premium (and the RMW and CMA factors, too) and see how much we juice up returns and safe withdrawal rates in our SWR simulation platform. I will even give you credit for the inspiration of that post. How about that?
Hey Big ERN, Thanks for the great series! I’ve read the whole thing today and really enjoyed it. I found this comment thread looking for any further discussion of the Fama-French factors. It looks like you included Small and Value tilts in Part 28: An updated Google Sheet DIY Withdrawal Rate Toolbox, but you forgot to credit the commenter Eric 🙂
As a total noob to investing and economics, would you mind quickly explaining why adding small and value would be considered less diversification than the S&P 500? Thank you!
Great! Well, Eric showed in his comments he didn’t really understand what the FF factors are all about, so I didn’t feel an urge to credit him. 🙂
By definition, the large broad indexes are 50% value and 50% growth and if you start with broad index portfolio and add value stocks you’d go to 50%+x value and 50%-x growth and you’d become less diversified (than the market-cap weights).
For small-cap, I concede that adding some small-cap to an S&P500 index portfolio will provide some diversification because you’re getting closer to the total stock market weights. But beyond that, adding more small cap (and small-cap value as is often proposed) is less diversification and more concentration away from the market-cap weights.
Your analysis is spot on, though you seem to be implying that Kitces and/or others have been advocating a 4% + CPI withdrawal rate for early retirees. I’ve not heard Kitces or any credible person recommend that; most point out that in several historical scenarios (though a definite minority of all starting years) your portfolio would be virtually entirely depleted at the end of 30 years. The “4% rule” was explicitly ‘designed’ for 30 year retirements, and your data points out that as long as you’re okay with running out of principal, it’s still on track to succeed for year 2000 retirees. And at almost any other ‘recent’ starting year, including 2008, retirees would be in significantly better shape as well.
Further, according to the Social Security administration’s life expectancy tables, there is only an 18% likelihood that at least one of two opposite-sex spouses both aged 65 will survive to 95. Statistically, the most likely scenario is for one of the spouses to be widowed around eight years or so before their own death. At any rate, a widowed spouse is not likely to need to spend as much as a 65 year old retiree. This just further strengthens the case for a 4% SWR for 65 year old retirees.
Certainly younger retirees need to be more conservative, and your post definitely illustrates that.
Thanks, William, for this very thoughtful comment. You’re right. Kitces and Trinity target their research at the average 65-year-old. They probably don’t even realize that their research is being misconstrued as relevant for a 30 or 40-year-old retiree.
Cheers!
Regarding the health of those retired in 2000, you point out problems with Kite’s work. But in my memory the first article on this subject was by the original author Bengen. Cannot remember where published. CFA publication?
Did you identify errors in its calculations? I believe he calculated the ending value (at date of publication) and compared that value – relative to starting value – and compared it to the historical distributions of that % – where the the SWD resulted in 0 failures.
I don’t remember any recent work of Bengen. His 4% rule papers are all from 1994-2001. I agree 100% with Kitces’ results and confirmed his calculations. I only disagree with the interpretation of his work. If you find the paper you mentioned, please let me know!
A big part of why the 4% rule might “fail” isn’t just when -it- fails, but also when the investor fails. When someone’s nest egg gets cut in half while taking critical living income, many people will freak out and make the knee jerk move to sell or shift. I used to be a financial advisor and I talked many clients “off the cliff” when their investments went down 10-20%. At 50%, your “I need this money” nest egg can become a powder keg of poor choices.
Oh, and another awesome article – thank you! I think most people just need to calmly understand that many cool, awesome ways to invest or “hack the system” tend to come with some unintended consequences.
Thanks for sharing! That’s a great point! We can do all the simulations and see how a supposed “success” of the 4% had a 5-year long major drawdown in between. It might not have been a success if people didn’t know about the future recovery and then lost their nerves.
I think the criterion for success/failure needs some updating!
What if you have a global asset allocation on the stock side? 50/50 stock/bonds but the 50% equity piece is only half in the US where CAPE ratios are so high? The other half is in developed and emerging markets. Do your models suggest improved returns?
Great question! I’m working on a blog post on that topic. International equities got hammered in both market crashes just as badly as U.S. equities. So, I doubt they would help you much in a downturn. If the U.S. economy is in recession everybody else’s equity market suffers!