
February 5, 2024 – Two recent papers in the personal finance area have caused enough of a stir that I’ve gotten numerous requests for comment. I noticed that if I compile all my notes, calculations, simulations, and replies, I already have more than half of a new blog post. So, today I would like to share my results with my other readers who might also wonder what to make of those new research ideas. The first paper claims that the famous “Stocks for the Long Run” mantra is all wrong because stocks don’t outperform bonds as reliably as Jeremy Siegel and many prominent finance pundits claim. The second paper effectively claims the opposite, namely that a 100% equity portfolio, half domestic and half international stocks, handily beats any bond portfolio and all diversified stock/bond portfolios, including life-cycle, i.e., target date funds. Thus, the authors claim they have upended decades of personal finance conventional wisdom on stock/bond allocations, diversification, and target date fund glide paths.
Well, isn’t that ironic; both papers can’t be right! So, which one is right? Or are they both wrong, and conventional wisdom prevails? I started this post and wanted to comment on both papers in one single post but then ran out of space. So, I had to split my material into two posts. Today, I share my thoughts on the first paper and on whether stocks are still a good long-run investment in light of the new data. But stay tuned for the follow-up post, likely later this week or early next week!
Let’s take a look…
How reliably will a 100% Equity Portfolio outperform 100% bonds?
The first paper I mentioned was published in the Financial Analyst Journal (FAJ) and is titled “Stocks for the Long Run? Sometimes Yes, Sometimes No,” written by Edward F. McQuarrie. It’s available to download for free here. The eye-catching result is the following chart indicating that bonds held up remarkably well with stocks during a 220-year time series, except for a few decades between WW2 and the early 1980s:

Thus, the author claims that essentially all of the equity outperformance came from a short sliver of financial market history, and unless that bad bond market scenario repeats, there is no sizable advantage of stocks over bonds.
So does the “stocks for the long run” mantra belong on the trash heap of financial market history? Not so fast. Here are several reasons why I believe stocks remain very attractive for most investors, not just in absolute terms but also relative to bonds…
1: The pre-1871 return data are not that relevant today
I should stress that I’m not saying that the 18th and 19th-century market data are wrong. Professor McQuarrie gives us a better understanding of market history. We should applaud him for carefully cleaning pre-1871 stock market data to better account for equity survivorship bias. I’m merely saying that the pre-1871 record of financial data is not relevant for today’s expected stock and bond returns. The United States was a new country – an emerging market country – in the late 18th and early- to mid-19th century. Thus, corporate and government bonds would have been deemed extremely risky for a recently independent country that had yet to establish itself on the world stage. State bond defaults in the 1840s and the Civil War didn’t help either. So, I am unsurprised that bond yields and returns are roughly aligned with equity returns early on because the U.S. hadn’t reached its status as a global military and financial superpower. U.S. government bonds were far from the financial safe haven asset they are today. But this also implies that most people would be extremely hesitant to use pre-1871 data for calibrating return expectations in 2024 and beyond.
So, to all the people who wonder if I plan to extend my financial history horizon to 1792, my answer would be, “Heck, no!” For example, in my Safe Withdrawal Rate Series, I currently use monthly returns going back to 1871, but I freely admit that any record pre-1914, before we even had a Central Bank, is also a bit of a stretch. But also note that when calculating safe withdrawal rates, most of the time, your failsafe withdrawal rate would come from the 1929 or 1968 cohorts, i.e., the more relevant market history. And, if you are so bothered by my 1871 starting point, you can also calculate safe withdrawal rates focusing only on 1926 and onward, as in some other retirement calculators. The results wouldn’t be too different.
Sidenote: International Safe Withdrawal Rates
A related discussion in economic and financial history is the observation that safe withdrawal rates in the U.S. are an outlier, and they are significantly lower in other countries. See Wade Pfau’s paper on the topic. Many people forwarded this paper to me over the years and asked me to comment. Please see the main result table with the “SAFEMAX,” i.e., failsafe withdrawal rate by country:

Why are some of the safe withdrawal rates so low? Much of Europe and Japan were ravaged in the first half of the 20th century. I was amazed how Norway, Netherlands, and especially Denmark could hold up so well, despite being overrun and occupied by German forces. Denmark has a higher overall failsafe than even the U.S. But in any case, unless we believe a repeat of the WW1 and especially WW2-era destruction of European countries is in store for us again, I find the U.S. safe withdrawal rate calculations a lot more representative. Most importantly, I believe U.S. cities won’t soon look like Dresden in 1945; see the screenshot below. Well, part of Detroit and Baltimore do, but not the entire city, especially not the city center.

Thus, I suspect we can safely ignore the German SWR rate from 1914 and the Japanese SWR from 1940! They are the outliers, not the U.S.! I have to roll my eyes when I hear people say that U.S. SWR calculations are plagued by survivorship bias.
So the lesson here is that just like we should ignore 1914 safe withdrawal rates from Germany, we can also ignore the relative stock/bond performance in 1792!
2: My bond returns look slightly different
McQuarrie uses corporate bonds, while in my safe withdrawal rate toolkit, I’ve always used 10-year U.S. government bonds. Thus, my cumulative Bond real returns are slightly lower; see the chart below. Obviously, I don’t have pre-1871 data, so I started both equity and bond cumulative returns at 100 in 1871. I try to plot the data in the same style as in the McQuarrie paper. Qualitatively, my chart looks the same as the McQuarrie chart zooming in on the 1871-2020 time span. Of course, in the McQuarrie chart, it looks like the Stock and Bond time series was at around 60 or 80 in 1871, while my stock and bond started at 100 in 1871, so that will explain some of the differences. But it’s also true that my average bond returns are very slightly lower, which is expected because I use government bonds only.

I can also report the return stats for the entire time series and the same sub-periods as in the McQuarrie chart. Stocks outperformed bonds by 421 bps (basis points = 0.01% points) annually over the entire time span. 215 bps during the early period, a whopping 857 bps during the four-decade bond drawdown, and then 325 bps during the last 40 years.

Sidenote: how much extra bond return was there in the McQuarrie data?
Maybe the McQuarrie results make more sense when using a different bond return series. By how much would the McQuarrie bond index outperform my Treasury benchmark bond index? If I rescale the starting points to 60 for equities and 80 for bonds in 1871 and add an additional 0.75% per year return to the bond index, I’d match the rough shape of the McQuarrie Bond index, i.e., reach a 1941 peak of around 2000, drop by 50% during the 1941-1982 bond bear market and we get the 10x real return over the 1981-2019 bond bull market (1,000 to 10,000). See the chart below.

Thus, even with an additional 75bps per year, calling the third subperiod “Fluctuating Advantage,” as McQuarrie does, feels highly inappropriate. Even during one of the longest and strongest bond bull markets on record, bonds had trouble keeping up with stocks, which actually went through four(!) bear markets over those four decades (1980-1982, 1987, 2000-2002, and 2007-2009), plus several close calls (e.g., 1991, 1994/95, 1997/98, 2018).
And we all know what happened in 2020, right? Once the U.S. fixed-income market entered its bear market in 2020, bonds fell far behind stocks again, which brings me to the next point…
3: What about that 2020-2023 bond bear market?
Even though the paper came out in January of 2024, it’s curious that the returns ended before the pandemic. The multi-decade bond bull market ended in mid-2020, and your 10-year benchmark bond took a serious beating. Thus, with an additional four years of return data, 1981-2023 doesn’t look so hot anymore for the bond portfolio. Here’s the cumulative return chart in that same McQuarrie style, again using my 10-year Treasury bond index. Notice the sharp downdraft of bond returns over the last four years!

And here’s the return stats table. The stock outperformance during the last period is back to 428 bps, almost indistinguishable from the overall time series average of 447bps:

So, I admit that the 857 bps outperformance from 1942 to 1981 may have been something of an aberration, but over the last 42+ years, the stock return engine has delivered a sizable outperformance over safe government bonds; by more than 4.25 percentage points!
The “stocks for the long run” theme definitely looks legitimate, as the last 80+ return years indicate. Clearly, you can improve the bond performance if you venture into riskier bonds with higher yields and higher expected returns. But that means you add equity-style risk through the backdoor. The best you can hope for is an additional 75-100 bps for corporate investment-grade bonds (92bps for LQD over IEF over the 1/2003 to 1/2024 time span, according to Portfolio Visualizer). Even with high-yield bonds, you’ll have trouble making up a 400 bps annual return advantage.
4: What about 30-year rolling windows?
Just because stocks outperform bonds over the very long run, 150 years in my sample, it’s no guarantee that the same is true for individual investors over much shorter horizons. So, let’s check how stocks performed vs. bonds over 30-year rolling windows. Over my sample, 1901-2023, there was only one single 30-year window where bonds outperformed stocks by a mere 0.06 percentage points: June 1902 to June 1932, i.e., the sample that ended at the bottom of the Great Depression bear market and comprised not just that equity drawdown but also five additional bear markets, including the terrible 1907 banking panic and the 1920-1921 depression. But for the rest of the sample, equities outperformed bonds very reliably.

Conclusion
In my view, the McQuarrie paper is a big “nothing burger.” The first main result, looking at the 1792-1871 newly adjusted stock and bond return data, is irrelevant from today’s perspective because the U.S. is a much more stable and developed economy today with a bond market that acts as an international safe haven. Realized returns have been lower over the past 80+ years now, and the same is true for expected bond returns going forward.
The second main result, looking at 1981-2019 data, seems highly deceptive because the author focuses on one single bond bull market, ignoring both bond bear markets before and after that long stretch of strong bond returns. Recall that the 10-year yield dropped from 15.84% in September 1981 to 0.52% in August 2020 (intra-month peak and trough). The massive duration effect from this drop in the yield created above-average bond returns lasting four decades. Even back in 2020, you’d have to be insane to extrapolate that forward with a then-yield of under 1%. But even when deceptively focusing on that one bond bull market with that once-in-a-lifetime duration effect, bonds had trouble keeping up with stocks going through four bull and bear markets. So, stocks are still a great long-term investment, both in absolute terms, with a 6-7% annualized real return, and also in relative terms, with a 400+ bps annualized excess return over bonds.
Does that mean we should forego bonds and invest 100% in equities? Not necessarily. Bonds can still add value because they tend to diversify risky stock portfolios, especially during demand shock recessions, i.e., when yields drop in response to accommodative monetary policy (1929-1932, 2000-2002, 2007-2009, and 2020). Especially when you’re in retirement and facing Sequence of Return Risk. So the consistent stock outperformance doesn’t necessarily point toward a 100% equity portfolio. But that will be the topic of the next post when I discuss my views on the second paper and the pros and cons of a 100% equity portfolio. Stay tuned for that one.
Thanks for stopping by today! Please leave your comments and suggestions below.
Title picture credit: pixabay.com
Thank you for an excellent post. Whilst I don’t share your equally strongly held view that one can rely on this era lasting for the USA (or know that it is certain to fall like Roman, Athenian, British, Macedonian dominance), it is clear that the data shows that bonds provide less volatility at the cost of less real return over most retirement periods. I prefer to diversify internationally to hedge against a madman being elected as president or some other such misstep although it’s likely that the resulting global instability will hurt all developed markets. However to return to my main point, the interesting question is where have these papers gone awry.
I am really looking forward to your next paper. It would be interesting for these researchers to actually find something that could improve our asset allocations and reduce sequence risk. I think that social security and other annuity streams firming a greater share of income in later years should reduce the bond allocation to meet the goals of an optimal sustainable consumption rate and a 50% minimum bequest.
Yeah, that empire failure thing is a concern, though not imminent in the USA, I hope.
We’ve had some terrible presidents in the past and always recovered from them. Even came back stronger.
About the other paper: don’t get your hopes too high. I doubt that the “Beyond the Status Quo” paper will change anyone’s views on asset allocation. Sadly!
Once again, great post, looking forward to part 2! Just an odd question (sorry if it is a bit “marginal” to your central focus): I had come across the conclusions of the Wade Pfau article before and now had a look at the original text – thx a lot for referencing it! Might be I have overseen something, but I am still wondering what these numbers regarding other countries actually mean: Withdrawals following inflation in these countries? Investment limited to domestic markets? Why would anybody not diversify except to avoid currency fluctuations? If investments are considered to be worldwide, are currency fluctuations taken into account?
The Wade Pfau paper assumes you invest in that country’s domestic stock and bond market and you apply that country’s CPI to adjust withdrawals.
That’s what the paper assumes, and like you, I find this unrealistic. That’s another reason the “survivor bias” talk is not really serious.
+1
1) I suspect the performance of a bond-heavy portfolio depends on the valuations at which you buy. In that sense, it’s just like stocks.
In late 2023, treasuries were offering ~+2.5% real returns in an environment of fast-falling inflation. Corporate bonds were offering ~+3.5%. That strikes me as a decent time to start a bond-heavy portfolio. With enough duration, one could live off the 4-5% interest and never sell a bond WHILE avoiding most SORR (in exchange for some inflation risk).
But if one had started their bond-heavy portfolio in 2020 or 2021, with near-zero real yields, I suspect the portfolio’s longevity would be questionable already.
2) Speaking of valuation, the gap between the forward PE of the S&P500 (19.5) versus S&P400 mid caps (14.5) or S&P600 small caps (14.5) is at proportions last seen during the dot-com bubble, when smaller stocks outperformed. https://archive.yardeni.com/pub/stockmktperatio.pdf
So I think the interesting question of the moment is whether a portfolio that leans hard on cheap small and mid cap stocks bought at low valuations is safer than a portfolio full of “magnificent 7” stocks?
Change “ravished” to “ravaged”: Much of Europe and Japan were ravished in the first half of the 20th century.
Changed that. Thanks!
Good point: The McQuarrie paper may actually give the right asset allocation right now, over the next 1-2 years: bonds look attractive again, especially once the Fed starts lowering rates. And stocks have very lofty PE + CAPE measures.
Also, I should stress that in my post today I don’t mean to say that we should all have 100% equities. In retirement, when facing SoRR you definitely need bonds in your portfolio. Traditional retirees with a 30-year retirement and the ability to (partially) draw down their assets could live quite well with a bond-heavy portfolio, as you suggest.
Of course, small-cap stocks look a little bit less overvalued, so maybe that’s the way to go.
Great write up, broadly in line with my perspective. Thanks!
FWIW, below are some relevant Cederburg responses to McQuarrie’s seeming contradictory study from the RR community:
The second quote in particular is in line with some of your thoughts – pre-developed market status of the US doesn’t seem particularly relevant/comparable to today’s conditions.
“In general, there is no real disconnect between (i) the possibility that bonds could outperform stocks over, say, a 30-year horizon (closer to McQuarrie’s conclusion) and (ii) stocks having a better distribution of 30-year returns (closer to our studies). If stocks had state-by-state dominance over bonds, they would always outperform bonds over every 30-year period. That’s too strong to be realistic. We find very close to first-order stochastic dominance, which is to say that the probability of stocks achieving any given payoff or larger is higher than the probability of bonds achieving that same payoff. You should choose the better distribution for investing into the future, but backward looking disappointment is always possible (if we rule out state-by-state dominance).”
“We’ve been taking the stance of looking at developed countries, and there is relatively little data from pre-1890 because there were few developed economies. Our JFE publication goes back to 1841 for the UK and has longer samples for a few other countries. The US isn’t classified as developed under our method until 1890. Our method requires an assumption that the periods we sample from are comparable, and treating developed countries as similar seemed like a better assumption to us than including country-periods in which the majority of workers are farmers or ranchers (e.g., pre-1890 US).”
Both are in line with my view.
For example, I’m not troubled by the occasional 30-year window when bonds may outperform stocks. From an ex ante point of view we have to look at distributions. We don’t require “state-by-state dominance.”
In the FWIW department, we are just now setting up our first bond ladder 1.5 years after fully exiting the workforce and its attendant income stream. Our portfolio is our sole source of income in retirement, so we are very sensitive to SORR, which we felt acutely throughout 2022 in the lead up to quitting, and the subsequent six months afterward. Yikes.
So as we evolve our decumulation strategy, my thought was to simply lock in a decent rate of return on five year’s worth of cash, and then decide each year whether to leave it in our checking account for the year or roll it over into another bond or our equity portfolio. Doing the latter would, of course, require us to identify which portfolio positions to liquidate, something that is an ongoing source of mystery to us now that we’re in decum mode.
Cap gains on taxable positions have so many different effects, including ACA premiums, Medicare IRMMA, SSA tax, and state and fed income tax – it makes it a ludicrously complex problem to solve.
So another advantage of the bond ladder is it throws off cash along the way (or simply appreciates in value until it matures), and then lands in our checking account with a very predictable tax effect.
Agreed. I really wish there were many more posts discussing tax efficient methodology for folks that are predominantly in taxable accounts. It’s painful to think about rebalancing when taxes come into play when all you’re trying to do is keep risk in check.
You will likely do no rebalancing at all. Instead, withdraw from the asset with a relative overweight. That may not bring you back to the target weights either, at least not that fast. But the tax drag from constantly rebalancing would be too high.
Love the strategy! Of course, to fund a large bond/CD ladder you also have to liquidate assets at some point, so we’re really only shifting the tax burden, never eliminate it.
It sounds like what we need is a FIRE blogger to build a spreadsheet at least as complex as Karsten’s portfolio calculator to model the effects of different income streams on “ACA premiums, Medicare IRMMA, SSA tax, and state and fed income tax”. There is an optimum for any given person, and a calculator could work for everyone under a given country’s tax policies.
Somebody please accept this challenge.
I’m not a tax guy. I wonder who would be the tax+Excel nerd who can come up with that!
As always, a thoughtful analysis that exposes details that matter. And as we know, the devil is usually in the details!
I’m familiar with Wade Pfau’s work on specific-country risk and how it affects safe withdrawal rates (the U.S. being the exception along with a few others supporting a “higher” withdrawal rate) as noted in the chart you cite.
What are your thoughts about a single equity holding such as VT (a total world index that is country market cap-weighted)? It seems to me that making a passive bet that the collective wisdom (or ignorance) of every global investor mitigates country risk over the long haul.
If the U.S. continues its outperformance then its weight in the index creeps ever-higher. The opposite is true if the U.S. equity market lags and a new leader will emerge. Either way winners are rewarded (higher weighting in the index) and losers punished (not to pick on Italy, but it’s a mere 0.7% of the index). The holder of the index fund is just along for the ride.
Sure there are downsides to this strategy (if you’re in the U.S. your consumption is in dollars, you lose the foreign tax credit if held in a taxable account, etc…) but if you want to give up any expectation that you have a crystal ball and can pick global winners it seems the way to go.
Is this thinking too simplistic?
The VT (=Vanguard total world stock market index fund) would be great. I personally don’t think that your entire equity needs to be VT. For US-based investors, there is a high correlation between domestic and international.
Both papers also ignore the availability of inflation protected US treasuries for investors!
Ignore it because it didnt exist for the vast majority of the time period, nor all countries, sure.
Aggressive definition of “ignore”
Correct. Even in the US, we’ve had TIPS only since 1997, I believe.
Yeah, not enough history for TIPS returns.
But don’t get your hopes too high. TIPS performed much worse than Treasury bonds in 2007-2009.
Isn’t the innovation of TIPS the ability to buffer the longest term sequence risk – surprise ongoing inflation – with less drawdown risk vs traditional inflation hedges (equities, commodities)? The late 60s retiree scenario.
I don’t see how optimal financial planning can happen without taking the impact of that ability into consideration – at least for those that are considering some bonds in their allocation.
And not necessarily eliminating treasury bonds either.
And looking at the McQuarrie Bogleheads threads…
He advises…
TIPS ladders for those approaching retirement (45+) – and will also add beyond the ladder using LTPZ when real rates approach 2.5% – to preserve buying power for a future ladder
100% stocks for those under 45 with a good ‘family backstop’ and plans to continue working
I think that 20y before retirement is way too early to shift into TIPS ladders or bonds. See here: https://earlyretirementnow.com/2021/03/02/pre-retirement-glidepaths-swr-series-part-43/
Exactly. I think a lot of the articles that downplay or dismiss the value of bond ladders, TIPS and Treasuries are doing so from the perspective of accumulation and growing wealth, versus post-retiree focus on decumulation and wealth preservation.
In retirement, bonds are helpful. 20 years before retirement seems a bit early.
TIPS didn’t hedge well against the global financial meltdown. In a deflationary recession (1929-1932, 2000-2002, 2007-2009) you’re better off with nominal bonds.
Thanks for the interesting article! As a retiree who went pretty much wholly over to Vanguard’s VTINX fund a few years ago on the theory that it was silly to keep playing the game once we had won it, I’m now thinking in terms of increasing stock allocation but hate to do it at these multiples.
I need to review your article that (as I recall) dealt with increasing stock exposure on a glide slope after retirement.
Correct. Parts 19+20 of my series go through the glidepath approach. If you are overinvested in bonds and like to shift to stocks that’s not a bad idea. It provides a partial hedge against Sequence Risk in retirement.
Looking forward to the next paper’s analysis. 👀👀
Likely on 2/12. Stay tuned.
Funny to see a German with so much love for the USA. Hope that is unbiased
Naturalized US citizen! Just being patriotic.
One issue that is not addressed is the difference in taxes. For many people the taxes are going to be lower on long term captal gains than income from bonds
True. The tax drag from interest and the tax advantage from deferred capital gains would add to the advantage.
Another great article Karsten. I’m also commenting so I can turn on notifications. 🙂
All right. Thanks for staying in the loop!
Great article! I wanted to point out that Dr. McQuarrie’s paper is the subject of two lengthy threads on the Bogleheads forums (with him participating) – including this one about how he’s not at all in favor of bond funds and worries that folks might mistakenly conclude that his paper showing that stocks don’t always out-perform bonds might lead them to think that intermediate-duration bond funds like BND are a viable alternative.
He’s fine with a TIPS ladder and apparently has no quarrel with folks like Jonathan Clements who invest mostly in globally-diversified equities with a small slice of short-duration bonds (Clements uses VT -@ ~72% – with the rest equally divided between VGSH and VTIP). But he’s very critical of widely-used target-date and fixed allocation funds like Vanguard’s for their heavy use of BND and equivalents.
https://www.bogleheads.org/forum/viewtopic.php?t=422026
That’s good. It wouldn’t be the first time if someone’s academic paper was taken a little too far by folks in the influencer scene.
I also feel a bit sorry for him how he probably planned this paper in 2019 and then the bond market blowup chipped away from one of his 2 main points. Surprising that the FAJ still published it with such outdated data.
I wonder how all the research on past performance and withdrawal strategies would be affected if actual implementation costs (commissions, bid/ask spread, fund fees, taxes, etc.) were included. Index returns were unobtainable back in the day, since no low cost index funds existed – individual stocks and high priced mutual funds with high loads were. I would ascribe to Bill Sharpe’s observation that all active investors averaged the index’s return on a gross basis, but the net would be substantially less, perhaps up to 2%, or more, due to the frictions. Plus, the average investor in the past was dramatically under-diversified, so the volatility drag over time would reduce their returns much further. Bonds and bond funds also had their high costs too, though perhaps not quite as high as stocks, though all the income was federally taxed, like now, but tax-deferred accounts didnt exist long ago.
These frictions would bring the average investor’s “net” return down substantially, affecting performance and SWR. If 10% and 6% were the average historic stock/bond index gross returns respectively, I wonder how conclusions would change if more realistic “net” returns, say of 8/4% were used? Volatility would presumably stay the same (roughly 20%/8%?), thus the net “Sharpe” ratios (return/stdev) would decline from 0.5/0.75 (10%/20%, 6%/8%) in the above examples to something like 0.4/0.5 (8/20, 4/8), which would clearly reduce SWR. This is a crude approximation, but arguably better to assess strategies and outcomes than the artificial index return assumptions.
Good point. I am troubled by that thought as well. Because t-costs were so much higher, I fear that a) historical SWRs would have been lower and b) investors have now priced in this additional liquidity and thus expected returns will be lower than the historical ones.
That’s why I like to build in an additional layer of safety in my SWR calculations. Don’t retire the second the math gets you over the historical SWR hurdle. Maybe add another 5-10% to your target.
Amazing piece, as always. Can’t wait for the next one. Just curious, did anyone else load up on TLT (and similar) when it hit approx $85? I don’t love long bonds but couldn’t help myself!
You are very brave! At 5.10%+ the 30y bonds were a steal!
Brave or stupid, time will tell (although I truly am happy with 5%+ for as long as it takes to get a pop in price). 🙂 Thanks for all of your wonderful work.
There may be another small peak in yields this year, because the Fed will not cut rates as quickly as people want. But I think the 2023 rate peaks will not be tested again. So: good move, buddy!
I bought TLT, ZROZ, EDV, and some 30 year treasuries in early-to-mid November and sold them in late December for about $100k in gains. It was the craziest trade of my life. A yield correction I expected to take 12-18 months and went all-in on happened in 1 month. I have no idea where long-term yields are heading from here. Maybe nowhere.
Good for you! Amazing trade. I did the same, but only sold about half (happy with the yield for now as I wait for as long as it takes for the price to further appreciate).
Thoughtful analysis that once again helps to lessen/obviate the need for “financial advisors” for those that are interested.
Thanks! Glad you found this useful!
Why do the bonds get “rescaled’ in 1981?
It’s McQuarrie’s suggestion, so don’t shoot the messenger: To better compare the post-1981 performance and to prove that bonds almost kept up with stocks after 1981. Using a log-scale it just means you shift up the curve, parallel to catch the Stocks in 1981 level again.
I guess this by Ben Felix is what the next ERN post will be about?
https://youtu.be/JlgMSDYnT2o?si=AWHl3i1VADG4lELx
No, my assessment is not exactly the same as from Ben’s:
1: before retirement, sure do 100% equities. Maybe even right until retirement, see SWR Part 43.
2: I agree that bonds can be a risky long-term investment. I think Ben Felix was referring to one of my early blog posts: https://earlyretirementnow.com/2016/05/19/bond-vs-stock-risk/ So, during accumulation it may be sensible to avoid bonds. Correct.
3: In retirement, you can afford a lower average return. Even a 1.3% real return affords you a 4% SWR over 30 years. So, low bond returns don’t hurt you so much in retirement. At least in the US there is a low correlation between stocks and bonds and this is why bonds are crucial in today’s US retirement portfolios, despite their lower average returns.
4: I agree that domestic bonds were not the best diversifier in other countries during the crazy volatile times around WW1 and WW2. If the whole country goes bankrupt, both stocks and bonds suffer (e.g., Weimar Republic). But that’s not a risk that we face in the US.
Long-term charts are quite interesting for historical analysis, and your analysis that pre-1871 data is not relevant to the current market is spot-on. You also correctly point out that pre-1914 is questionable since there wasn’t even a central bank. Don’t forget, though, some other major dates that make prior data irrelevant: 1) The US went off the gold standard domestically in 1933, and 2) the US dropped all pretense of an international gold standard in 1973.
Without any anchor to gold, the printing presses can run at full speed producing nominal dollars at any time. Inflation-adjusting returns is important, but investments are priced in nominal dollars, and stocks in particular increase with higher inflation (see Venezuela, Turkey, and Zimbabwe). Can you imagine a 1932-scenario with a 90% stock crash and 25% unemployment where the Federal Reserve didn’t pump out money at full speed?
For my own analysis, I like to use post-1973 data to reflect the reality of a total fiat currency. The stock vs. bond advantage then is even bigger!
Sure, stocks outperform bonds. Even more so with the recent data. But I don’t think this has anything to do with leaving the gold standard.
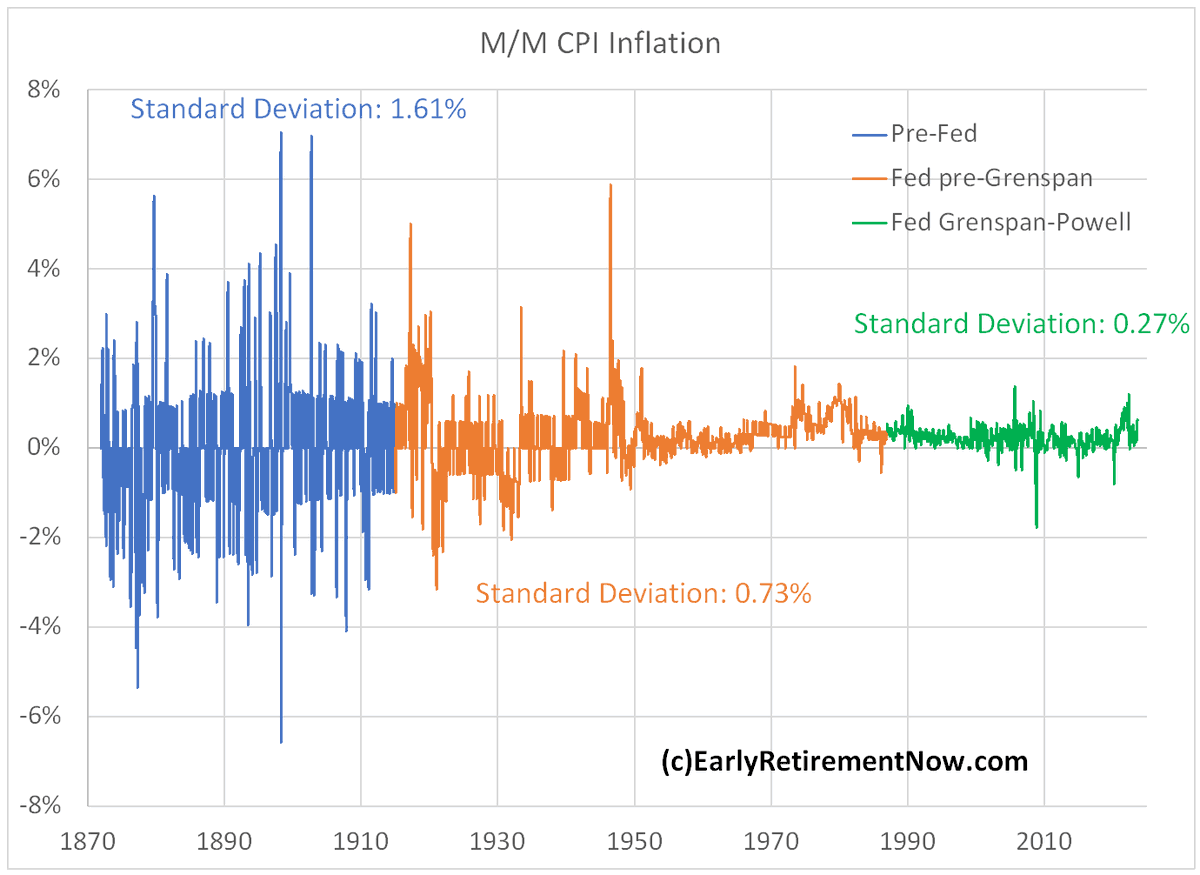
Month-over-month CPI inflation volatility:
Pre-1914: 1.61%
1914-1987: 0.73%
1987-2023: 0.27% (Greenspan/Bernanke/Yellen/Powell)
Thank you so much for the link to the paper from Wade Pfau (“An International Perspective on Safe Withdrawal Rates: The Demise of the 4 Percent Rule?”) I found it a great resource to address my concerns about US exceptionalism in the 20th century by offering a comparison to the UK (a story of decline from geopolitical dominance in the 20th century). You provide a tremendous service. Thank you so much for everything you do.
Thanks. Glad yo liked the link!
Not just the link. I loved the analysis in your post. Thanks again.
That’s very kind of you! Thanks! 🙂
Would love to hear your take on if AI (assuming it actually does reshape the economy fundamentally) is Inflationary or Deflationary? And what it means from a stocks vs bonds perspective? My thoughts are that people losing jobs to AI is probably deflationary, but could result in UBI or something which is probably inflationary. And on net probably still OK for stocks in the long run which will still accrue the profits of the whole thing.
AI will be disinflationary. AI would then lower inflation because of productivity gains. The same way IT caused a goldilocks economy in the late 1990s.
I hope people don’t fall for the fallacy of UBI.
Goldilocks is one possible outcome; though doesn’t it depend on the nature of the AI transformation and how high the unemployment rate goes as a part of that? The IT boom itself didn’t really substantially raise unemployment on its own, right? Just an overall productivity boost? In that way this could be different, but I don’t think people know enough yet to say either way. Thanks for your response!
Productivity can come in two forms:
1: Produce the same output with fewer inputs.
2: Produce the more with the same inputs.
All prior revolutionary productivity boosters (rail, steam engine, assembly line, automation, robots, refrigeration, IT, internet,…) have ensured that it’s #2, not the luddite theory #1. AI will follow that same trend. Hence, I hope for goldilocks.