
October 6, 2023 – There’s been a lot of chatter about the Bill Perkins book “Die With Zero” and its approach to life and retirement planning. Most recently, just yesterday on the awesome Accidentally Retired blog. After several readers asked me about my views on the “Die With Zero” idea, I finally relented and decided to write a piece in my Safe Withdrawal Rate Series on the topic.
I’ll briefly describe the areas where I agree with Perkins. But then I also go through all of the fallacies in this approach. Let’s take a look…
What I like about the Die With Zero book
First, I see some parallels between Perkins and me. Like Perkins, I used to work in finance and called it quits at a very productive point in my career to focus on more important things in life. Of course, Bill Perkins’ net worth is much higher, but in qualitative terms, I can still relate to his life story. Why work into my 60s to build an even larger nest egg when I had enough at age 44 to live comfortably? Sure, I might have 10x-ed my net worth over the 20 years of peak earnings between my mid-40s and mid-60s. I would have been even more comfortable, but I would have paid the opportunity cost of missing out on lavish travel and the peace and tranquility of the relaxed suburban life here in Camas, WA. So, in 2018, had the book been out then, I would not have learned anything pathbreaking and new. But I would have certainly enjoyed Perkins’ work as an additional motivational impetus to quit my job.
Second, I like Perkins’ idea of focusing on experiences over consumption of material goods. Even though, with his nine-digit net worth, I’m certain Perkins has some nice material stuff, too. But of course, the idea is that almost all material stuff depreciates and fades, while memories of past experiences will flourish.
Third, I like the idea of not going too hard-core on the frugality idea when planning for FIRE. It reminds me of my popular 2021 post, Stealth Frugality, where I propose to live a generally frugal life but don’t become so frugal that people start talking behind your back about what a weirdo you have become. As the name of the post suggests, we were frugal without people even noticing, sprinkling in some conspicuous consumption clues to the outside world. I did not need to “borrow” a Netflix password from friends and relatives or other crazy, unhinged antics that some folks in the FIRE community pursue. Sure, it took me a little longer to reach FIRE, but at least I could enjoy the ride. Perkins would surely agree.
Fourth, I like the idea of bringing more people into the FIRE community. The current FIRE influencers spend a lot of energy marketing to people with low net worth levels, say, the folks who just graduated from Dave Ramsey, got out of debt, and are now ready and willing to keep going. That’s all a noble cause, but few folks will have the stamina to go through the likely 10-year or longer accumulation phase to reach FIRE. We should expand the search for FIRE enthusiasts to the already affluent who, for some reason, don’t even realize they are FIRE or close to FIRE. I’m not sure there are many such “oblivious FI folks,” but we should try to grow the movement any way we can.
But there are also several areas where I’m afraid I have to disagree with Perkins’ work…
1: Die With Zero and Capital Depletion are nothing new!
Quite intriguingly, the idea of depleting your portfolio is not new. The success criterion of the 4% Rule is capital depletion. Depletion, as in “having $0.01 at the end of retirement, counts as a success.” I frequently hear people talking about how innovative the Die With Zero approach is and how it allows you to withdraw more money and retire early. For example:
[The Die With Zero method’s recommended nest egg] will be lower than the traditional advice of multiplying your salary or spending by 25 – a popular calculation used and recommended by financial planners that’s based on an annual 4% withdrawal rate. But, for those who want to spend down all their money in their lifetime, that calculation may yield too high of an estimate.
Source: Business Insider, May 15, 2021
I have to wonder: did I miss something? Did I misread the Trinity Study? No. It’s just another day of mathematically illiterate people confusing and confounding simple mathematical and financial concepts. Case in point: the writer(s) at Business Insider falsely assumed that the Trinity Study was based on Captial Preservation. It’s not. Historically, using a 75/25 portfolio and a 30-year horizon, the 4% rule would have run out of money just about 2% of the time. So, using capital depletion (=dying with zero) as the success criterion, you would have succeeded 98% of the time.
Also, the 4% Rule would have preserved the (real) initial portfolio value only 70% of the time. In fact, conditioning on a CAPE Ratio greater than 20 (today’s value is closer to 30), the probability of maintaining your (real) portfolio value after 30 years drops to less than 50%. So, again, the Trinity Study, Bill Bengen’s work, and much of the Safe Withdrawal analysis out there are not usually based on capital preservation. But please see Part 2 of the series for an in-depth analysis of the capital depletion vs. preservation issue. I demonstrated that if you want capital preservation, you’d typically need a nest egg much larger than 25x expenses.
Thus, if people claim that Die With Zero automatically allows you to withdraw more and/or retire with a smaller nest egg (and therefore earlier) because of capital depletion, that’s false advertising. In Perkins’ defense, he is not explicitly making that Straw Man Argument about the Trinity Study. It’s mostly the journalists and some FIRE influencers. But Perkins is also not doing much to put this misunderstanding to rest either, so he’s at least partially responsible.
But, I indeed concede that the 4% Rule likely leads to a sizable nest egg at the end of your retirement in 98-99% of the historical cohorts that didn’t run out of money. So, I am the first to admit that if you calibrate your withdrawal strategy to the historical worst-case scenarios, then you set yourself up for potentially overaccumulating because asset returns are volatile, and it’s difficult to pick a withdrawal amount that generates a “point landing” of $0 assets and the end of your life.
2: Vast overaccumulation in retirement isn’t that much of a problem.
In an interview, Perkins laments that most retirees don’t get close to depleting their savings. He references a 2016 study that shows that the median 75+-year-old American has more money than the median 65 to 74-year-old ($281,600 vs. $237,600). In the book, he uses 224,100 and 264,800, respectively, which are the 2016 numbers in 2016 dollars, while the numbers in the Business Insider article are the 2016 numbers in 2019 dollars. The ratios are the same, though.
There are multiple problems with his interpretation of these statistics. First, neither $281k nor $237k is very impressive. I don’t consider that overaccumulation. Healthy 75-year-olds still have 10+ years of life expectancy, and much more when factoring in joint life expectancies of couples. So, it’s not like $281k is all useless extra cash. If I assume $100k of that $281k is excess savings, how much is that really in the grand scheme? If you assume a (conservative) 5% return on equities (over the long run, it was closer to 6.7%), this retiree could have spent an additional annual amount of $454.93 between the ages of 25 and 74 to lower the retirement nest egg by those $100,000. Excel formula: =PMT(0.05,50,0,-100000,1)
It is better than nothing, but it wouldn’t have made a big difference in your young-age spending. You can’t miraculously send those $100,000 through a time machine to your younger self to fly in a private plane and party in the Bahamas (one of the author’s memorable anecdotes). The issue here again is the time value of money. Someone with finance training should know that!
Second, these numbers don’t necessarily prove that individual retirees grew their net worth. A single-year snapshot for 2016 does not tell us anything about the net worth of the current 75+ cohort when they were younger. For that, we’d need panel data, or the very least, the SCF data from years prior. If anyone has trouble understanding the basic distinction between panel data vs. time series vs. cross-sectional data, please continue your motivational speaker shtick, but stay out of debates about data analysis! You’re embarrassing yourself.
Besides, if you bother to look up the source data at the Federal Reserve, you will find the following table:

Well, isn’t that interesting? The 2019 Survey of Consumer Finances report includes data for both 2016 and 2019. Those 2019 figures were available at the book’s publication date. But Perkins mentions only the (outdated!) 2016 number but ignores the more recent 2019 figures because they would have negated his central premise. In 2019, the older cohort had a slightly smaller median net worth: $254.8k vs. $266.4k (=-4%) and a significantly lower average net worth: $977.6k vs. $1.217.7m (=-21%). Also, notice that between 2016 and 2019, both the median and mean net worth of the 75+ cohort declined by 10% and 14%, respectively. Again, due to composition changes in the three years (new folks entering the 75+ cohort and people dying), it’s not entirely appropriate to make too big a deal of the percent changes. But this drop points to a significant withdrawal from retirement portfolios of the 75+ cohort, considering that the stock market rallied by over 50% nominal and over 40% in real terms between 2016 and 2019.
Also, looking at a more extended sample of household net worth numbers from all the past Surveys of Consumer Finances conducted every three years between 1989 and 2019, most of the time, the 75+ cohort had a smaller net worth than the younger 65-74 cohort. The lower net worth is even more pronounced in the mean figures than the median numbers. So, focusing on that one little outlier blip from 2016 and ignoring all the age cohort data, it feels like someone is fudging the numbers. Sorry, Bill, you just lost a lot of reputation! You have crossed the line of data analysis malpractice.

Update 10/18/2023: The new 2022 SCF data are out. Again, the mean and median net worth numbers for 75+ are below the 65-74 age group. Please see the chart below:

But you know what? The last few paragraphs are still mostly moot. They mainly showcase his and his ghostwriters’ confirmation bias data hackery. Even if I were to concede all points to Perkins, namely, that the average retiree in the late 2010s and early 2020s has not spent much of his/her nest egg, that doesn’t mean anything. Our current retiree population is likely one of the luckiest ever. Most of them accumulated assets during the best bull market ever, 1982-2001, with only short and shallow bear markets in between (1987, 1991). The Dot Com crash (2001-2003) and the Global Financial crisis (2007-2009) did produce deep equity bear markets, but they were short and easily diversifiable with a large enough bond share. And the strong bull market since March 2009 – again with temporary and shallow interruptions – is also one of the best market rallies ever. Today’s retirees, aged 65+ and especially 75+, experienced the best Sequence of Return Risk imaginable. Good for them, but there is no guarantee that future retiree generations will fare so well again. Side note: there may be a very narrow slice of the current retiree population that retired at or around the bull market peak in 2000, but their numbers are too small to have a significant impact on today’s mean/median stats.
In contrast, retirees from the notorious 1929 and 1965-1968 cohorts would be about 120 to 160 years old today. They are no longer around! But their memory is. That information about past drawdowns and past stock/bond correlations made it into the statistical distributions that rational and reasonable financial planners ought to use when drafting retirement plans, whether it’s professional financial planners or DIY amateurs like us in the FIRE community. And because nobody could have known ex-ante how superbly well financial markets would work out eventually, it’s no surprise that we have some excess precautionary savings ex-post. But in a less attractive market environment, the net worth of retirees would have looked very different. As a former energy trader, Perkins should be familiar with risk management and the potential for an asymmetric risk profile. Having money left over at age 95 is less of a headache than running out of money at age 75.
So, if you want my opinion on why there’s some excess net worth in the stats, I can provide two reasons: First, the precautionary savings motive described above, i.e., people hedging against a potentially unfavorable market environment. Ex-ante, that was the rational thing to do, even though ex-post, people will have some excess savings. The median traveler at the airport gate arrived too early for the departure. But it was still the rational thing to do because wasting 30 minutes at the airport is cheaper than arriving 1 minute late, missing the flight, and having to buy a new ticket.
The second reason is the lack of helpful guidance from the financial planning community. Everybody reverts to some naive heuristic, like the 4% Rule. To get a more customized solution, you’re likely stuck with yours truly and maybe a handful of other small niche providers. For example, if you had retired in 2003 or 2009 and used a 4% Rule, it’s no wonder that your portfolio grew during your retirement. At and around those bear market bottoms, you should have used at least a 5-6% withdrawal rate to account for the attractive equity valuations. So, I agree with Perkins that the mainstream retirement community is confused about the quantitative side of retirement planning. But Bill Perkins’ is even more confused and proposes an even dumber rule than the 4% Rule. This brings me to the next issue…
3: The Die With Zero savings target is not linear in the horizon
This is probably the most disappointing feature of Perkins’ work. You would think that as a former finance professional and energy trader, he’d spend much more time on his magic formula, i.e., the savings target you should aspire to retire. But the best he can come up with is this:
Nest Egg Target = Retirement horizon * annual budget * 0.7That’s it? Why is the formula linear in the retirement horizon? That goes against the most fundamental financial insight: the time value of money. If you have twice the horizon, you shouldn’t need twice the nest egg because the second half of your retirement needs less than the first half. (There is, of course, one exception, namely, when the expected real return is zero, in which case the nest egg target becomes linear, i.e., retirement horizon times annual budget. But then you would underestimate the target by 30% because you would not get that 0.7 multiplier.)
I can easily demonstrate how wrong Bill’s math is. First, assume you can access an investment with a fixed real rate of return. One could use a TIPS ladder, for example. In the chart below, I plot the nest egg target as a function of the horizon. All lines are plotted as multiples of the annual budget. I do so for the DWZ formula (T*0.7) and portfolios with different real rates of return ranging from 0% to 6% p.a. I also plot the 4% Rule of Thumb as a single dot, i.e., 25x at a 30-year horizon. The lines are clearly not linear, except for the aforementioned 0% rate, where you’d be way above the DWZ rule. Using real returns between 2% and 3% (30y TIPS rate as of 10/5/2023 is 2.50%), you’d need a much smaller nest egg for a very long retirement horizon beyond 30 to 40 years. And you’d need a significantly larger nest egg than 0.7*T for short horizons. In fact, not even with equity-like real returns would you get away with a nest egg of only 7x when your horizon is ten years. So, the Bill Perkins formula is thoroughly incorrect and useless if you want to implement it through a TIPS ladder. The curves are not straight, and their slope is not 0.7. (side note: I’m aware that TIPS only go out to 30 years, so you may still face some residual interest rate risk when facing a horizon of more than 30 years).

Another approach would be a Single Premium Immediate Annuity (SPIA). I went to the website Immediate Annuities (I’m not affiliated with them, but I like how easy it is to get quotes there) and pulled some SPIA annuity quotes for males, females, and couples at different current ages between 40 and 90 years old (in 5-year steps). I assume the couple consists of a male and a female, both of the same age. For the DWZ formula, I assume a life expectancy of 95; for example, a 40-year-old would use a 55-year horizon. Or a 65-year-old would target the standard 30-year retirement horizon. Here are the net worth targets as multiple of the annual budget and as a function of the current age. Notice that the curves decrease because we have the retiree’s age, not the horizon, on the x-axis.
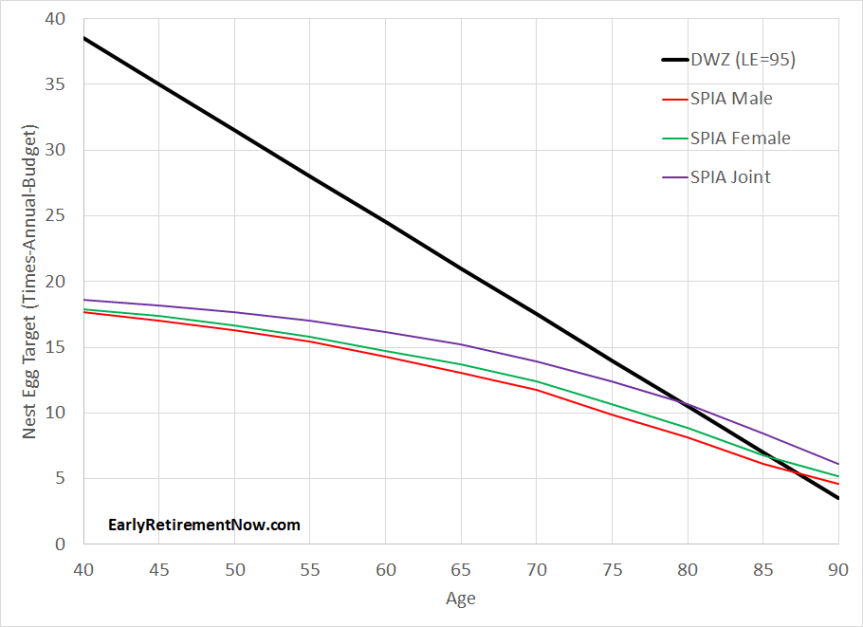
Notice how the curves are not linear and have a slope nowhere near 0.7. In fact, for younger retirees, you again need a much smaller nest egg than the 0.7*horizon formula would suggest. But also notice that SPIAs are not inflation-adjusted. Especially over longer horizons, you expect to wipe out a significant part of your purchasing power. For example, 40-year-old retirees with a (potential) 55-year horizon would deplete about two-thirds of their purchasing power, assuming a 2% trend inflation rate. At 2.5% inflation, you will erase 75% of your purchasing power and more than 81% when the CPI is 3%. That might cut it too tight for early retirees with a frugal budget. Say, if you think you can survive on $25k today, will you be able to live with dignity on $6-$8k a year (inflation-adjusted) when you’re in your 90s? I don’t think so!
So, if you’re a 40-year-old retiree, you may be impressed with the whopping 5.66% SWR for single males, 5.58% for single females, and 5.38% for couples. But don’t be tempted to put your entire nest egg into one single nominal SPIA and retire with only 17-19x your current budget. Leave a sizable(!) reserve to deal with the inevitable depletion of your purchasing power! How do you do that? I model this COLA adjustment as a withdrawal case study that slowly phases in withdrawals to make up for an assumed 2% inflation rate. I’m using a 75/25 portfolio and calculating the historical fail-safe cohort to see how much you need to set aside to exactly deplete your money in that worst-case scenario. See the chart below. Now, we’ve shifted the minimum nest egg requirement to just above 25x. It is still better than the 0.7*55=38.5 from the DWZ formula. Don’t get too confident, though, because inflation could come in much worse than 2%, which explains why SPIA+2% gives you a seemingly higher SWR/lower nest egg target than a traditional SWR analysis.

But also notice that, as before, the SPIA-recommended nest egg sizes are much larger than the DWZ formula when you get to your 80s. Here, the nonlinearity of the withdrawal and annuity math works against you, and you need significantly more than the DWZ linear formula would recommend.
Finally, we can plot the failsafe retirement nest egg that would have survived a retirement using a 75/25 portfolio with a capital depletion target. That’s the standard ERN approach, straight out of my Google Simulation Sheet (see Part 28 for details). Again, nest egg targets are not linear, and the slope isn’t 0.7.
You’d need more than 25x to hedge a 30-year retirement as recommended by the 4% Rule (i.e., you need the extra cash to hedge out that residual 1-2% risk of running out of money). I also plot the nest egg target when you model a slowly declining real retirement budget, melting away 1% of the budget every year, and you can shift down the curve. A lot of folks, Perkins included, tout this consumption shrinkage as the panacea to retirement savings. There is indeed a significant drop in the nest egg target, but the curve is still not at all linear and doesn’t have a slope of 0.7 either.

Summary so far: your target nest egg should not be linear in your retirement horizon. None of the commonly used retirement tactics (TIPS ladder, SPIA, SWR analysis a la Trinity or ERN) will ever generate a linear function in your horizon. If you’re young, you’ll need less; if you’re old, you’ll need more than what Perkins recommends.
4: The savings target should depend on future expected cash flows
Another issue that Perkins seems to ignore is that retirees may have future cash flows. Young retirees should certainly account for future Social Security and pension income, albeit applying a small cut to hedge against potential policy risk. I will not elaborate on this issue because it should still be fresh in everybody’s memory after reading last month’s post in the SWR Series: Social Security Timing – SWR Series Part 59. But even traditional retirees often like to account for, say, a potential future downgrade in their primary residence or other supplemental flows. Without guidance on how to factor in such future flows, the already problematic linear nest egg recommendation becomes even more suspect.
5: The savings target should depend on asset valuations
Almost as disappointing as the asinine linear nest egg formula is the absence of any recognition of how asset valuations determine your nest egg target. Case in point: when Perkins wrote this book, ostensibly in 2020 and/or early 2021, we had rock-bottom interest rates. 30-year TIPS rates were below 0%, which would have implied that for a 30-year retirement, you’d need more than 30x annual expenses to hedge your retirement budget even with depletion over 30 years! Not 0.7*30x=21x, but 30x!
In contrast, today’s TIPS rates are again at multi-decade highs. As I showcased in one of the charts above, with CPI-adjusted safe returns that high, you potentially retire with a much smaller nest egg than the recommendation from the DWZ book. Again, the great irony is that the occasion where a linear nest egg target could have been rational would have been the case of zero real rates, where the nest egg target would have been T*Budget. Not 0.7*T*Budget!

If you run a traditional safe withdrawal rate analysis, as I do here on the blog, equity valuations are the big gorilla in the room. As I have written on my blog for seven years, your withdrawal strategy should be more cautious when the stock market is at an all-time high vs. in a deep drawdown. In the chart below, I plot the minimum nest egg per $1 of retirement budget to sustain your retirement even if we suffer a repeat of a historical wort-case event. Notice how the failsafe nest egg recommendations differ crucially depending on the equity drawdown, between 0% (=equity all-time-high) and 50% drawdown. If the market is underwater by that much at the start of your retirement, you can sustain your retirement budget with a much smaller nest egg. I was surprised that Perkins, who worked in finance, didn’t think equity valuations should be more prominent in your retirement planning.

6: Hedging against old-age health expenditure shocks is feasible
The author has a response to folks wondering about the risk of health and long-term care expenses later in life. I am paraphrasing here: “Don’t even bother; it’s so expensive that you poor little peasants and peons can’t afford it anyway.” He mentions how astronomically expensive it was to pay for his father’s end-of-life care and how even a few days of care would have wiped out most middle-class retirees’ nest eggs. What a sad and defeatist attitude. And how condescending!
His reasoning reminds me of the Suze Orman spat 5 years ago when she argued that nursing homes cost $300k a year. Of course, Suze argued you need a bazillion dollars to retire to pay for a nursing home, while Perkins uses the same argument to push you in the other direction, i.e., retire anyway and just forget about a nursing home altogether. Of course, the reality for most ordinary folks who are not in the 9-figure net worth club is different. There are cheaper options for nursing homes. And most old-age folks should be able to get away with a much lower degree of care, e.g., hire some domestic help with cleaning, gardening, etc. There will be an additional cost, and because nobody knows how much exactly you will need to spend, it is indeed rational to keep some extra precautionary savings around as a reserve. You can’t afford Suze’s Beverly Hills nursing home, but those extra savings will certainly give you peace of mind to be able to pay for unexpected costs later in retirement and live a graceful life.
Moreover, as I have written in a prior post (“When to Worry, When to Wing It? – Part 47), because the nursing home stay or other old-age expenses are so far in the future, it’s usually not something on my mind right now. Even a relatively small bucket invested in 100% equity index funds (due to the long horizon) should give you restful sleep at night.
Summary So Far
The Die With Zero approach reminds me of a quote I once heard from a professor of mine describing the work of another economist I prefer to leave unnamed (luckily, it wasn’t me!):
“Your work is both innovative and intelligent. Unfortunately, the innovative parts aren’t intelligent, and the intelligent parts aren’t innovative.”
In other words, Perkins’ take on early retirement is certainly neat. His style is fresh, and he exudes the high energy and confidence – some would call it cockiness – of someone with a high net worth. I wouldn’t be surprised if he used one of Tony Robbins’ ghostwriters. Therefore, credit where credit is due, the Die With Zero book and his whole philosophy are undoubtedly helpful in bringing more people into the FIRE community, for example, those who are turned off by FIRE’s (undeserved!) reputation of extreme and excessive frugality. Lots of people will be drawn into his narrative and inspired by someone so fabulously rich and confident. But his ideas aren’t new and certainly not revolutionary. His philosophy is a rehash of the “Your Money or Your Life” book from decades ago (which he credits and references), just upping the coolness factor a bit.
However, when Perkins wanders off the beaten path and showcases some “innovative” ideas, he quickly becomes unintelligible and unintelligent. He has a valid point criticizing the status quo of today’s retirement planning landscape that leaves many retirees so uncomfortable touching the principal of their nest eggs. But what he proposes as an alternative, the asinine linear formula (0.7 times horizon times budget), is even less helpful than the generic mainstream B.S. retirement planning tools – if you thought that was even possible.
Perkins’ formula, which ignores some of the most basic finance principles, i.e., time value of money and (high school level!) amortization math, would vastly exaggerate the target nest egg for all FIRE retirees. With a 60-year horizon, he would propose a 42x annual expenses nest egg. But a simple 75/25 portfolio would have sustained a 3.25% withdrawal rate, equivalent to only 31x. And that’s for a bare-bones 60-year retirement without any future supplemental flows like Social Security. With some supplemental flows, you might be able to push your SWR back below 30 and potentially even close to 25x gain. Specifically, Perkins’ formula would all but guarantee that you overaccumulate assets during a FIRE-style retirement, the exact issue that Perkins laments so much. What irony!
Likewise, for very short horizons, say, under 15 years, the DWZ savings target is even more dangerous financial malpractice. It’s far too low and will all but guarantee that money doesn’t last as long as your horizon, even with very aggressive estimates of (CPI-adjusted) expected returns. Thus, no credible retirement planner would ever take the explicit numerical recommendations in that book very seriously.
Luckily, people in their 70s and 80s would likely not even make it to the infamous formula. After that barrage of condescension and insults against old folks of the type “spend your money while young because you’ll be a useless and brainless vegetable when you’re older,” – most 70+-year-olds would have put down the book before page 160. Thus, Grandma and Grandpa will likely be safe from bad financial advice for now! Whew!
A better way to model Die With Zero: The “Safety First” Method
We could consider at least partially moving away from the stereotypical Trinity Study approach of hedging your longevity risk on your own with a large stock/bond portfolio. Safety First often involves moving at least a portion of the portfolio into other asset classes (TIPS ladders, QLACs, standard annuities, etc.), thus sacrificing some or even all of the portfolio growth upside for a higher withdrawal rate.
There are many flavors of the Safety First approach, and Wade Pfau wrote a good summary on Forbes. Since I am already past 5,000 words, I must defer detailed simulations to a future post. But it’s on my to-do list, so stay tuned and watch this space. I will present in a future post how annuities and TIPS ladders can likely improve safe withdrawal rates. Specifically, you give up a large portion of the upside, which some are happy to do because they want to Die With Zero. Still, you hedge against worst-case scenarios, like the bad Sequence Risk events, a la 1929 or 1968, which increases your failsafe withdrawal rate.
As nice as this all sounds, there is one caveat. The attractiveness of the Safety First approach depends crucially on the interest rate landscape. Thanks to the recent rise in rates – both nominal and real (TIPS) rates – some of the previously unattractive strategies suddenly look quite appealing. It may not last, so I hope I get that detailed post ready before interest rates drop again!
Thanks for stopping by today! Please leave your comments and suggestions below! Also, check out the other parts of the series; see here for a guide to all parts so far!
All the usual disclaimers apply!
Picture Credit: pixabay.com
Wow, again a fantastic analysis. Thanks so much for pointing out the fallacies. I was struggling with the formula Perkins presented after reading his book. And thought I misunderstood or oversimplified the math. But as it turned out and you made clear, he himself oversimplified. Karsten, thank you for your great work and for sharing your intelligence with the world! All the good from The Netherlands!
Hi Rolf! Thanks for weighing in. I’m glad I’m not the only math geek out there feeling like that when I see a formula and it doesn’t quite seem right! 🙂
And greetings back to NL! One of my favorite Euro destinations. We visited Amsterdam, Den Haag, Utrecht, and Haarlem last year. All beautiful places!
I’m not a math geek, but the things you pointed out in this post were the biggest problems I had with Bill’s book when I read it. The formula just didn’t make sense given what I knew from reading your SWR series, and his hand waiving around end of life care was enraging as someone dealing with an in-law with dementia.
While dementia care is not cheap, five years of care (to get around the Medicaid 5 year lookback period) is relatively calculable, and I would rather be 75 with a plan for how my household will pay for it and still allow the unaffected spouse to have assets than to have to spend everything down to qualify for Medicaid and leave the unaffected spouse destitute in their old age.
Thanks for sharing!
Yeah, all good points. That’s my beef with some of the ultra-rich influencers (Orman, Perkins, Ramsey, etc.): They extrapolate some their own costs to the average Joe, not knowing that we can find much better and more affordable options.
I’m a fan of your work (posts and podcast guest), and I appreciate that, like you, I’ve delved into Bill’s formula. While I’m hesitant to disagree with your post, in my opinion, you’ve taken Bill’s formula out of context.
Bill’s formula actually reads as follows:
“Survival threshold = 0.7 × (cost to live one year) × (years left to live).”
The “survival threshold” isn’t a “Nest Egg Target,” as you’ve reframed it; it represents the “bare minimum”. According to Bill it could make sense for individuals to “keep working” even after reaching it. Bill also proposes tapping into the equity of our house or using other financial resources, so it doesn’t rely solely on market assets. It serves more as a mental model to alleviate the scarcity mindset that some or all of us may have.
What I’ve taken from the concept of the survival threshold is a number that Bill proposes to help people relax and start spending on life fulfillment, rather than relentlessly striving to reach an impervious retirement number, especially when they might be too old to fully enjoy it.
In the end, Bill argues that people should shift their focus away from a single “number” as their primary goal, as no number will ever truly be enough. Instead, he suggests concentrating on a “date,” which marks a “net worth peak.” Unfortunately, he doesn’t provide a clear method for calculating this number, which I feel is the main weakness of the book.
Cheers,
The Bludger
Bare minimum vs. nest egg target is a distinction without a difference. The nest egg targets from my SWR toolkit are also bare minimums to have a relaxed retirement. Whatever you call it, bare minimum, nest egg target or any other financial feel-good phrase you might pick, that bare minimum can’t be linear in the horizon. it violates all math and finance principles.
Hi Big Ern,
I’m a fan of your work, and I appreciate that, like you, I’ve delved into Bill’s formula. While I’m hesitant to disagree with your post, in my opinion, you’ve taken Bill’s formula out of context.
Bill’s formula actually reads as follows:
“Survival threshold = 0.7 × (cost to live one year) × (years left to live).”
The “survival threshold” isn’t a “Nest Egg Target,” as you’ve reframed it; it represents the “bare minimum.” It could make sense for individuals to “keep working” even after reaching it. Bill also proposes tapping into the equity of our house or using other financial resources, so it doesn’t rely solely on market assets. It serves more as a mental model to alleviate the scarcity mindset that some or all of us may have.
What I’ve taken from the concept of the survival threshold is a number that Bill proposes to help people relax and start spending on life fulfillment, rather than relentlessly striving to reach an impervious retirement number, especially when they might be too old to fully enjoy it.
In the end, Bill argues that people should shift their focus away from a single “number” as their primary goal, as no number will ever truly be enough. Instead, he suggests concentrating on a “date,” which marks a “net worth peak.” Unfortunately, he doesn’t provide a clear method for calculating this number, which I feel is the main weakness of the book.
Cheers,
Duplicate comment. Please see my reply to the other one.
Im not sure why anyone would want to ‘die with zero’ in the first place leaving nothing to their heirs.
Agree. But the idea would be to give money to your heirs before you die. So, you can still think the way you do and also “die with zero” if it weren’t for the mathematical headaches in planning to exactly die with 0.
I listened to the audiobook a year or two ago, mainly because so many in the FI community rave about it. I was skeptical going in, and after listening I was left underwhelmed – it’s an unimpressive and vastly overrated book IMO. It’s mainly an effort to cash in on a catchy title. You’re probably right that he used ghostwriters.
The book has two fatal flaws as I see it. The first is, it’s predicated on an assumption that giving away your money today is somehow objectively better than giving it away when you die. I don’t think he does a good job of supporting this assumption, he discusses it a little but didn’t convince me and IIRC didn’t even make a good argument for it, it was really just assumed. If I have children or a charity I want to leave my money to, I’m fine with them getting the money when I’m dead. I don’t see how I get greater utility by giving it all away while I’m alive. The second is that it completely ignores uncertainty – uncertainty about how long we will live, uncertainty about future medical expenses, future inflation, future life events (marriages/weddings/divorces, what colleges the kids or grandkids go to etc.) and of course sequence of return risk – it completely ignores SWR. Most of us over save because we are saving to not run out of money in a reasonable worst case scenario, of course we could all save less if we simply plan capital depletion exactly on our life expectancy birthday assuming a flat rate LT average return … that’s not how any of this works.
The “good” parts of the book is mostly cliches like “buy experiences over things” that are better argued elsewhere.
I’m with you 100% on your second point. This is exactly the “precautionary savings” issue I raise. Because of uncertainty (life expectancy, health, personal expenses, market returns) you need to keep a buffer of savings. None of the “math” in the book or fancy charts in his little website app are useful. The latter rely on fixed real returns, which nobody can lock in at a very attractive rate over 50+ years.
On the first issue: leave some money to your kids when they are in their 20s so they can enjoy their life a bit. Maybe help with a house down payment. I can support that effort. But you’re right, the bulk goes to my heirs when I’m dead and I no longer face any uncertainties myself. So, agree with you 99%, on this one I guess.
Yeah I’m not saying not to give anything away while still alive, just not doing so with the goal of “die with zero”. What I would give to adult kids or charities while living, would need to fit into a sustainable SWR. The lump sum principal would be distributed on death and I’m fine with that.
Yep, that’s 100% my approach!
Yeah I think he was a result of survivorship bias. He amassed more wealth than he could reasonably spend and looked back on his 20’s wishing he spent more back then. But he was a clear outlier and most others don’t have the same degree of luck and financial success that they can put off saving in their 20’s if they want to retire early.
I think it’s a good read for some of the ultra savers who are saving 70-90% of their paycheck to consider reevaluating their life from a different perspective and “live a little” in the present.
That’s a good angle. Just because he regrets spending too little, doesn’t mean that every young fellow in their mid-20s should spend as liberally.
Last time I checked, we actually have a problem with too much spending, credit card debt, etc.
Yeah, he kept mentioning how your earnings are higher at middle age, but he neglected the fact that your expenses also increase proportionally if not more if you have kids. I get not passing up once in a lifetime experiences in your 20’s but most younger folks can better inconveniences to save money like having roommates, biking/public transportation, hostels, low cost airlines, etc. You might as well live less comfortably when you can tolerate it so you can have more creature comforts when you can’t tolerate it at an older age.
Very true. Worked well for me. After finishing Grad school my spending only slowly transitioned into the higher earnings bracket. Worked out well for me. So, his advice is really only applicable to the 0.01% of highest earners, not the broad masses.
……. What is this nonsense? Thank you for reading this book so I didn’t have to. 😂
At your service. I have to read this stuff so you can just relax and read the summary here! 🙂
Great post done with your usual analytical mathematical style. I trust your analysis is correct from that viewpoint. Like the bludger, I also read the book, and agree that it is weak in the mathematical arena, but we have you for that. What I appreciated about the book was a fresh (at least to me) view of how to look at what is important in your life and make sure you’re doing that when you can.
I liked the concept of bucketizing things you really want to do, like that trip to Italy or hiking the Appalachian Trail, and putting them into reasonable age ranges. I didn’t take him to say over 70 you’re basically dead, just that maybe planning the AT hike at that age isn’t the smartest move, statistically speaking.
The “you aren’t an insurance company” chapter was also somewhat enlightening to me. Sorry to misapply credit if this is a presentation of a viewpoint that others have done in past books, but this is the first time I have seen it. Intellectually of course I know I’m not an insurance company, but my saving plan assumes that I am…plan for every worst possible case scenario…it will make retirement nearly impossible at any date.
I read a few FIRE blogs, and as you said, there are only maybe a couple of bloggers who really dive into SWR and “do the math”, none that I’ve seen who do it as completely as you do. So thanks for that! I just took DWZ in a different context, and for that it was helpful for me. In fact, until I read your article I didn’t even remember that he had math in his book. Cheers!
I can agree with all you wrote. I also think that the fresh style will get more people excited about the FIRE concept. So, use the book as a motivational tool (and I liked the bucket approach, though I don’t use it in finance, as you know, see Part55), but leave the math part to the people who know math.
But I still insist: absent of any tangible, concrete recommendations, the book is useless. Imagine you are a 50-yo with $3m in the bank and a $100,000 p.a. budget. How much will you give away to charity today and still be confident? The formula in the book is nonsense, so what’s the alternative here?
I was exactly the same !
I hated that book, not for its math, but for its philosophy. It just seemed so extrovert-centric and egotistical to assume that elaborate parties (and other examples of consumption he describes) could really lead a thoughtful person to happiness.
“Experiences > things” is just the latest way of keeping up with the Joneses in the Instagram world.
Haha, that’s an interesting take. You’re 100% right, Perkins’ style can certain rub people the wrong way. There is a fine line between exuding confidence and narcissism. Some of his anecdotes certainly go that way. Good point!
@Brian
““Experiences > things” is just the latest way of keeping up with the Joneses in the Instagram world.”
I absolutely love this comment/insight of yours.
The expression “experience over things” simply has no meaning and is indeed one of those popular internet memes that people take to be axiomatic because it is the popular thing to say.
Just as true that an “experience” can be more valuable than a “thing” in certain cases, so too can a “thing” be more valuable than an “experience”. After all, a thing might lead one to have many experiences that are much more valuable than just an experience.
Case in point, the act of buying some tools that one uses to build something could be incredibly more valuable as a growth experience than dropping a few thousand dollars to go on a guided tour of Paris.
All good points. This experience>things is not the gospel. I’ve gotten utility out of things because of the experience derived from owning the things. So, your really good example, shows how we can’t really separate things from experiences. Yeah, good point.
But you do understand, that I at least had to say a few good things about the book., right?
My favorite line in the post
“Sorry, Bill, you just lost a lot of reputation! You have crossed the line of data analysis malpractice.’
Shall we sart calling Karsten “G.O.A.T”?
Awww, thanks for the compliment!. I don’t even need to be the GOAT. All I need is that hopefully people don’t say kiss-of-death phrase about my work “the parts of your work that are original aren’t intelligent and the parts that are intelligent aren’t original”
A very nice post, but I find this statement confusing: The Dot Com crash (2001-2003) and the Global Financial crisis (2007-2009) did produce deep equity bear markets, but they were short and easily diversifiable with a large enough bond share.
Haven’t you previously argued that bonds are a poor source of diversification in your post The Great Bond Diversification Myth?
For retirees, it would have been essential to have some (long-duration) bonds in their portfolio during the 2001-2003 and 2007-2009.
The bond diversification myth post was about the fact that even a 60/40 portfolio still has a very large correlation with the stock market.
I am hoping to find some guidance on the right percentage of long duration bonds to hold for this type of situation in the future in retirement, versus intermediate or short term? Also, should they have been nominal bonds or TIPS, and bond ladders versus bond funds? I seem to remember from one of your posts that long term treasuries have had terrible returns over the long term, and over most historical time periods
TIPS give you inflation protection, even though that whole inflation story is probably now passed. Nominal bonds are more liquid and will likely suffice if we assume that CPI will return to 2-2.3% in the long-term.
A bond ETF with a fixed maturity target will get you better duration exposure if you believe that bond yields will eventuality return to below 4% again (and Fed Funds Rate to 2.5% as the Fed expects).
Bonds are not terrible on average. But they go through long periods of underperformance sometimes. It looks like bonds just got clobbered. Maybe we’ll now experience a bond renaissance again?!
You had me at “time value of money”
It’s one of my favorite principles in finance, too! 🙂
ERN with the 10 year now at 4.8% and likely heading to 5% I would be interested in seeing you revisit your “The Great Bond Diversification Myth” post.
The important message is still the same. If you have a 75/25 or even 60/40 portfolio you still have a close-to-100% with the stock market.
But I have to concede, that at 4.8% yield and the prospect of yields to come down over the next 10y again, 10y Treasury bonds seem like a good investment again.
When you write your promised upcoming post regarding the impact of TIPS ladders and Safe Withdrawal, I hope you at least mention the impact of the new IShares ETF product that consists of TIPS ladder in the ETF: https://www.businesswire.com/news/home/20230921646329/en/
I am also wondering about the behavior of TIPS if you need access to the funds outside of the ladder container, and there is a sustained stock market drop– look at what happened to TIPS versus nominals in 2008 and March 2020. Do the really help with sequence of returns risk if they are just in a regular TIPS fund and no ladder?
Big Fan of your site– I have read every post
Thanks for the link.
I would suggest o simply buy the underlying bonds themselves and save the money for the expense ratio, though.
The idea of a bond/TIPS ladder is that you may face some fluctuations along the way in your portfolio value (duration effect) but if you hold the bond(s) until maturity you generate a risk-free payoff.
Thanks for the response— also sorry to make so many comments on related topics, and I appreciate the time you’ve spent to answer. I will go the direct purchase route. I don’t want the fluctuations of a regular TIPS bond fund, so I am pursuing a ladder with maturities of Years 1-5 of retirement since these funds are to be used as a safety tool to address sequence of returns risk for drops in equities and bond markets during first few years of retirement. Returns on TIPs now at 1.5 % to 2.4% real right now, from what I can tell.
Not a bad option. TIPS will be good for a few years with real yields around 2.4-2.5%: https://www.bloomberg.com/markets/rates-bonds/government-bonds/us
FYI the value of even directly held TIPs will fluctuate in your account before maturity. So going direct vs a fund won’t eliminate the visual of the market value going up or down during the ride to maturity.
Yes, naturally, due to (real) interest changes and the duration effect. The best you can achieve is to guarantee a certain payoff at certain dates, but the portfolio may fluctuate along the way. Sometimes dramatically!
Great post, Big ERN. I’m surprised that the author was a trader, because the best traders in my daily experience are data mavens and he clearly isn’t. Maybe he was a lucky trader rather than one of the best, but it’s hard to sustain luck. So I’m scratching my head about him.
Here’s a possible future column for you going in the opposite direction: What WR is perpetual? Asking on behalf of an older guy I know who is focusing on legacy.
Exactly my thinking! Some traders are physics and math PhDs. Minimum requirement is usually a quant-centered undergrad degree. I would have expected more on the math side.
About the “generational wealth” question: the short answer is that you could set T=60 years and a required final net worth target=100%.
Another approach: a CAPE-based rule with cautious parameters (a=1.5%, b-=0.5) so that would last infinitely, though with a bit volatility in the withdrawals.
Thanks, Big ERN. Using those inputs and assuming a 75 equity / 24 debt / 1 cash port, WR of 3.0% looks 100 percent likely to retain 100% original port value in real terms after 720 months (i.e., perpetually). Do you agree? If so, 2.5% is nearly certain to grow port’s real value. Do you agree?
If so, I believe I’m done and I owe you (something of value TBD!) ….
Yes, 3% will not run out if we believe the future returns are not worse than any historical 60-year window,
So, you’re done. You owe me a beer! 🙂
Karsten, my Big ERN maven, thank you again! I will gladly “send” that beer and then some if you will DM me with your street address in Camas.
Please confirm that “3% will not run out” means “3% will not diminish the port in real terms, subject to the stated assumptions,” would you please (as that is the objective of a perpetuity — maintaining the real value while paying a yield).
“3% will not diminish the port in real terms” after ~50-60 years. In the meantime everything is possible. You could have some drastic drawdowns in between, but have the peace of mind that the portfolio will likely recover in the long run.
You might put ‘Ed Thorp endowment’ into google and look for an AQR paper
I read the AQR paper, thanks for the pointer. The interview was really good. He mentioned how important the personalization of SWR analysis is.
Where do I enter these parameters? Is there a tool you recommend or have?
In the Google Sheet, see Part 28 for the link and explanation.
For the CAPE parameters, please go to tab “CAPE-based Rule”
There you can enter the a and b parameters. Also see part 54 for additional info on how this sheet works with supplemental flows.
Not to be cynical but he was mentored by John Arnold… an ex-Enron executive 🤪
In my experience, when the trader was in the game has a lot of input on how open to mathematics they are or how much they pursued furthering their mental approach. Former floor traders from back in the day were more for street smarts and sizing a person up than data analysis. More than a few of them haven’t been able to adjust to the changing market mechanics.
Doesn’t look like all of that applies to Bill Perkins but he’s also in management not down in the weeds running numbers on crack spreads (for instance).
That would explain a lot. Thanks for filling in the missing data for us! 🙂
Perniks and Ramit Sethi are selling confirmation bias of “retirement financial comfort” while laughing all the way to the bank.
Wow, that’s a hard-hitting assessment, but I can certainly sympathize with that view. I sometimes wonder if all these finance influencers use their own financial comfort tools. Or is their financial comfort mostly due to selling the financial comfort dream to others?
I totally agree with you PRO
Hi ERN! I just caught up with the SWR series, and it looks like just in time for this post!
I would add on top of all the good points you make in this article, that even the premise about dying with more than 0 being a waste I think ignores some basic psychological factors as humans.
First of all, and most obviously, I certainly don’t want to die right as the bank account hits zero! If I did, presumably the cause of death would be the heart attack I get from looking at my savings account! Having some money left over gives peace of mind in the final years of your life. If you live another 10 years, you can still live comfortably, travel, and buy a bunch of things you want. If you die next year, well, at least you died happy!
Second, money does not equal happiness. Certainly, lacking sufficient money can cause unhappiness. But if you can afford, when retired, to be housed happily, to have your necessities, provide for your loved ones, and have an annual budget for luxuries in the low 5 digits, then there isn’t much more left to do with your money besides spending it on status symbols or social causes (whether charity or political activism). But the former is shallow/worthless, and the latter is something you can already do with the leftover money when you die.
Of course, this is also indicative of the mentality people with a net worth of 9+ digits. If you have a 20 million dollar nest egg, you could retire immediately, buy a mansion in San Jose, then take out around 600k a year for the rest of your life, even if you are immortal, which is enough to live abroad every day of the year if you wish, paying for expensive hotels every day, and flying first class in planes once every few days, eating every day at fancy restaurants, buying hundreds of books and video games each year, and maybe leaving a 6 digit sum for your loved ones to spend each year. So, for those that choose to go beyond this already “ridiculous” level is indicative that they overvalue spending money, which I think leads to the “die with zero” philosophy.
Thanks for this very thoughtful comment. All points are 100% spot on. Sure, one could hedge this risk you mentioned in 1 through an annuity. But I don’t like to lose control over all my money. I can certainly buy a small annuity for the essentials, but most folks like to hold on to the bulk of their nest egg. Then it’s very hard to spend it down without worries about that “still alive with zero” concern.
Hi BigERN. Thank you for another great post.
A lot of people have mentioned that they want to die with zero to me in the past, as of it’s actually plausible to do so. I always thought it was ridiculous to think you can actually plan to spend your last dollar on the day you die. And these people are usually planning with averages like 85 and paying no heed to the tails of the distribution.
However, I also think that as a person gets older, it can make sense to gently bump up the SWR and start to eat into more principle as they approach a theoretically oldest possible age (110?).
I wonder if you have some rule of thumb or formula for how to gradually and safely increase spending as you age with a portfolio of stocks.
Sorry if I missed you saying it already.
Rising SWR with age sounds a lot like the Spend Safely in Retirement (SSiR) strategy Steve Vernon, an actuary, developed and researched. See https://robberger.com/spend-safely-in-retirement-strategy/ for some details, but the base idea is delay Social Security to 70 to max inflation adjusted reliable income and add RMDs (or pseudo RMDs where RMDs don’t apply). That bases remains safe spend on a combination of remaining life expectancy and current portfolio balance but won’t always rise since a steep drop in portfolio balance would swamp an increasing glide path percentage withdrawal rate. But combined with SS or annuity floor income, could work well.
Karsten, SSiR seems like a good topic for an SWR series post if you’re up for it. I realize RMDs are not strictly SWR since they fluctuate with portfolio balance, but they should be safe, since they’re actuarially based and not as harsh fluctuations as a fixed % of portfolio remaining balance.
Thanks for the link.
The problem with the RMD approach is that your withdrawals are growing so much that you’ll likely short-change yourself early in retirement. You should do better by raising your early withdrawals and cutting you late withdrawals.
You make a great point that SSiR (RMD) based withdrawals don’t work well for early retirement (or maybe even early in a standard retirement) due to the low spending % supported early vs more spending late.
Maybe SSiR is only suitable in a couple cases:
1) For someone for whom SSiR provides enough income compared to desired spending at the time they retire (overfunded retirement).
or
2) Only switch to SSiR later in retirement once above crossover point is passed or say at RMD age. In this case, it does require planning for it earlier by delaying SS though to maximize inflation-adjusted income.
But it seems to me that SSiR is safer than SWR based income (meaning lower risk of running out) once it can support exceeding desired spending by enough to not be too worried about a major RMD drop due to severe market conditions.
1: That’s a very inferior approach. You’d work way too long and/or short-change your early retirement.
2: One could do the switch pater in retirement. But notice, the approach is not really safer. If you withdraw more money later in retirement and have the same allocation as the SWR study, than you are more likely to run out of money than with the SWR Google Sheet. Or am I missing something?
1. I may have been unclear on the use case I meant this would apply to. Use SSir only if you preferred working over early retirement until the point where SSiR provided enough income. In other words, at the age you start wanting to early retire, if SSiR meets or exceeds your desired income, it may be a good choice because it is actuarially sound. In that case, you aren’t being forced to work longer or accept lower early retirement income than you want. But you gain the actuarial risk reduction.
2. That’s not the crossover point I meant. Not same as SWR at start and more later. I meant switch only if/after SSiR provides more income than you want (taking into account income impact on reasonable risk of major market downturn early on). That still skews lower than your SWR Google Sheet in the beginning and higher later. Skewing higher later and lower earlier should be safer than constant nominal SWR due to sequence of returns risk. I think this would only happen if SWR were providing higher than desired income, which means SSiR would provide a lower starting target at the point of switchover.
I guess what’s always bothered me about retire as soon as SWR covers estimated future spending needs is that it ignores the idea of living below your means once in early retirement. For people to achieve FIRE, they needed to live below their means while accumulating (which among other things is a risk reducer). Its quite unnatural to start suddenly spending every dollar of sustainable retirement income – its the equivalent of living paycheck to paycheck in retirement. I think you said something related on ChooseFI and probably somewhere in your SWR series that financial psychology would likely prevent anyone from spending down to their last dollar – they’d naturally downshift spending to prevent it.
1: I prefer to retire when I can afford it. Also, SSir is distinctly not supported by actuarial principles because it’s too conservative for young retirees. That’s not really actuarially sound. You spend too little when you and way too much when old.
2: So, there is no crossover point then. Because if the market performs OK, i.e., better than the worst-case scenario, then I’d also raise my SWR Toolkit withdrawals.
3: “bothered me about retire as soon as SWR covers estimated future spending needs is that it ignores the idea of living below your means once in early retirement”
Agree. That’s a danger.
Apologies, but this is actually a reply to your Oct. 11th reply below, because there’s no Reply link on that below reply.
So, actuarially sound wasn’t the right word choice since it’s not annuitized. But, in the words of the actuary who came up with SSiR:
“• It provides a lifetime income, no matter how long the participant lives, and it automatically adjusts the RMD withdrawal each year for remaining life expectancy.
• It projects total income that increases moderately in real terms, while many other solutions aren’t projected to keep up with inflation. The Spend Safely in Retirement Strategy produced projected real increases in income of up to 10% over the retirement period.
[…]
• It produces low measures of downside volatility, with potential future annual reductions in spending typically well under 3%, which is hopefully a manageable amount.”
I’d encourage you to at least skim one of the actual papers before judging it too harshly. My brief blog comments can’t do SSiR justice. Given it was developed by an actuary and selected as “best” after comparing 292 different strategies (as far as I know, including SWR), seems worthy of more research before dismissing it. Here are the two referenced in the link I’d provided earlier:
SSiRS Paper: https://longevity.stanford.edu/wp-content/uploads/2017/12/How-to-pensionize-any-IRA-401k-final.pdf
SSiRS UpdatePaper: https://longevity.stanford.edu/wp-content/uploads/2019/07/Viability%20SSiRS%20Final%20SCL.pdf
In particular, I believe it compensates for the below (related) SWR strategy risks:
1) The decades of past data used to determine SWRs aren’t particularly independent of each other as consecutive time series reuse all but 1 year of data from the previous series, so 60 years of data only has 2 completely independent 30 year spans, for instance (credit Alex Murguia @ Retirement Researcher).
2) SWRs for US equity markets are much higher than for any other country’s equity market (credit Wade Pfau), which puts in question whether US will continue to do so much better than other countries in SWR.
3) “past performance does not guarantee future results”
Above should have said your Oct 11th reply above.
Also, I meant to also say that I really like the SWR approach for portfolio assets (combined with a reliable income strategy for at least a significant percentage of essential spending) and your handling of SWR, especially the Google Sheet to customize, is by far, the best handling of SWR I’ve seen. I’m just trying to give SSiR a fair comparison given the risks I outlined above related to any SWR approach as SSiR is the only viable alternative I’ve found to SWR (approaches like bucketing or risk wrap from Retirement Researcher’s RISA fall in different categories, so I wouldn’t consider them direct alternatives to SWR).
OK, noted. I think SSIRS is not a total waste of time. It’s OK to consider it.
For example, one could justify it as a supplement to a (nominal) annuity strategy. The nominal annuity is slowly phased out due to inflation. If you can mix it with the SSIRS strategy that’s likely going to grow withdrawals over time, especially with 100% equities, then go for it. And the volatility of the 100% equity portfolio is cushioned by the safe annuity payouts. Not a bad strategy.
Section 7 of the linked SSIRS “viability” paper provides further comparisons that may be useful.
Thanks! Indeed it does. A couple things it shows:
1) The RMD (SSiR) approach does better than the 3% SWR in poor market conditions (10th percentile scenario), which would be the scenario that most concerns me. Makes sense since it reduces sequence risk by back-loading withdrawals and scaling them to remaining life expectancy and portfolio balance.
2) It highlights the difference between front-loading and back-loading, which is a retirement income style personal preference characteristic in the Retirement Income Style Awareness (RISA) Assessment from Retirement Researcher.
3% is less than the worst-case scenario from a SWR analysis. If you wanted to do a fair comparison, you’d compare the 10th-%ile of the SWR analysis, easily in 4%+ region to the 10% charts in that paper. I’d prefer the SWR-based approach.
John,
Section 6 also provides some practical suggestions to address the front loading issue. However, as is usual in such discussions, context is important and it is worth noting that the SSIRS is not intended for early retirees, explicitly from Section 2.1 (Target audience) of the subject report:
“The Spend Safely in Retirement Strategy (SSiRS) is intended to be used by middle-income workers and retirees to generate retirement income from their IRAs or employer-sponsored defined contribution (DC) retirement plans, such as 401(k) plans. It uses investment options commonly found in IRA and DC administrative platforms, and does not require the ongoing assistance of a financial adviser. For the purpose of this report, we define middle-income retirees as having $1 million or less in retirement savings.
The SSiRS is designed for older workers and retirees who:
• have not accrued significant benefits in defined benefit pension plans,
• have accumulated meaningful balances in DC retirement plans, IRAs, or other savings, and
• might not work with financial advisers.”
All good points.
For example, SSIRS doesn’t really tell you how to handle multi-stage retirement problems, i.e., retire early, withdraw a lot, then claim SocSec benefits later and reduce the withdrawals. What’s the impact of future benefits on today’s withdrawals?
Noted. A lot of uncertainty about the withdrawals. I’d rather pick a SWR with a flat path.
I still don’t like the RMD approach. They can plot all sorts of pretty pictures with median withdrawals. But your withdrawals have almost the full volatility of the portfolio.
That’s a misunderstanding on multiple levels.
1: the SSIRS simulations also rely on historical returns.
2: In some instances it’s indeed true that because of overlapping windows you have only a small fraction of the sample periods as effective, independent observations. Potentially the number divided by the overlap length. SWR analysis isn’t that bad. Because only the first 5-10 years of asset returns really matter (due to Sequence Risk), you actually have a lot more than 150/30=5 independent windows. More like 150/5 or 150/10 independent windows (despite the overlap). As someone who’s actually done some quantitative work I can confirm that, because, for example, if you run any kind of regression of, say, SWR on equity valuations you will find that the ratio of Newey-West heteroscedasticity-adjusted standard errors and the basic OLS standard errors is a lot smaller than the sqrt of the retirement length. Exactly for the reason I stated.
So, again: SSIRS is a suboptimal withdrawal strategy. Among the 3 items you list that SSIRS compensates for, 1 is not even a serious issue due to Sequence Risk, and even if all 3 were serious issues, they would also apply to simulations in the SSIRS strategy. Or do you believe that if you applied SSIRS with the returns of German/Javanese/Austrian equity/bond returns during WW2, then you wouldn’t have very poor outcomes, just like you’d have in a SW R analysis?
Thanks Karsten. Great point on independent sequences being closer to 15-30 due to first 5-10 years being most important. So, I withdraw risk #1.
However, my point about SSiR being less susceptible to market risk was only that by back-loading some spending (specifically, limiting early spending) rather than nominal uniform spending with SWR, some sequence of returns risk is mitigated. This show up in the 10th percentile (worse) market performance graph in the 2nd paper. SSIR is not a standalone RMD strategy. It combines maximizing/delaying Social Security for higher reliable income floor (admittedly, not a good fit for very early retirements where Social Security PIA is too small) with RMD based withdrawals for variable income.
Retirement Researcher’s RISA elucidated that front-loading vs back-loading (or nominal flat) spending is a personal retirement income style preference, not an objectively better vs worse strategy.
Correct. And this is exactly what would happen if you use my SWR toolkit. You tie your initial WR to the worst-case scenario and then when reality is better than worst-case, you’d also move up your withdrawal amounts over time if appropriate. But keep it flat in the worst possible case. Similar to SSIR. Only, the SWR analysis is based on financial data, while the SSIR uses WRs completely detached from the asset allocation. The RMDs don’t depend on what your equity share is. Doesn’t feel right.
So, again, I don’t say that SWR is perfect. But it does everything the SSIR does and it does many things better.
One way to increase SWR with age if the new portfolio balance allows is to restart the SWR calculation in future years if the combination of balance, remaining timeframe, and equity valuations justify an increased SWR amount (not just %, but actual $ amount).
Yes. That’s what you’d so anyway: one should do a regular (maybe annually) checkup on the retirement plan.
Right, but while the idea of an annual health check for a drawdown retirement plan is common, it does not appear to be common to promote specifically upratcheting SWR calculations if/when expected portfolio gains allow.
I’ve seen SWR discussed many dozens of times and places, but only once ran across someone touting the idea of upratcheting inflation adjusted fixed SWR via periodic recalculations.
When combined with your personalized SWR spreadsheet calculations, upratcheting SWR as portfolio growth permits seems a nearly optimal balance of safety and efficient spending utilization smoothed out over retirement.
Yes, Kitces is the “inventor” of the ratcheting approach. I (indirectly) recommend it when/if your plan works better than the worst-case scenario.
Great. So that makes 3 places total recommending it. Kitces, you, and where I first heard it was Dr. Wade Pfau @ Retirement Researcher. Should be a widely touted enhancement to SWR.
Any chance you could modify the CANCEL REPLY function to preserve any draft reply if you reopen the reply window. It seems to happen frequently that my draft reply is getting deleted before sent. This is the only site I’ve seen this issue arise though I’ve posted comments on other sites. Thanks.
Thanks, I forgot to mention Pfau.
I’m not a tech wizard. No idea why this happens. When I reply on other sites I have that same problem often. I always type a reply in Word first and then copy/paste.
Now that we’re finishing up year 2 of this extended bear market, I’ve wondered if you were ~80% to your FI number at the all time high for the stock market at the end of 2021 and you kept saving through the last 2 years and are still at ~85% of your number but now have roughly the same number of shares of being at your FI number at the ATH, are you considered FI?
I haven’t done any simulations, but I doubt you’d be at 85% of your target. The market is still down, especially when factoring in inflation. So, even with contributions and even with a bit of dollar cost averaging, you might be still underwater.
The question is: will you need less now that we are way off the all-time-high equity market valuations? Maybe not, but you might be close.
Check with 2 sides of FI (https://twosidesoffi.com/) where Eric put his 2024 retirement date on ice. He might have been 80% FI in early 2022, but I don’t think he’s back on track for 2024 FIRE.
Yeah you’re right I’m not quite there but also not far from it thanks to an earnings jump the past couple years.
I was basically trying to figure out if say at the ATH in 10/2021, your goal was X shares of VSTAX at 3.25% WR, aren’t you still technically FI if you got there now since if you actually retired then you’d probably have ~0.95 * X shares of VTSAX now.
It’s never a black/white thing, so you are likely close. If you factor in that your retirement horizon is now a bit shorter, yeah, maybe you’re good to go. But I’d confirm it with and plug the numbers into the SWR Google Sheet! 🙂
Yeah will do. I plan on working a few years past that milestone anyway so it doesn’t really matter, just trying to figure out where the goal post is in the event of a layoff or something.
I’ve noticed that most frugal FI/RE oriented people were pretty insulated from the big CPI shocks the last 3 years. They’re generally lower consumers of housing (upgrades), cars, eating out, clothing and the other big line items making big jumps the last few years. Some things like eating in couldn’t be avoided, but I bet their “personal” CPI increases have been slightly lower than the national average.
Yes, very good point. If you’re a homeowner, you’re not exactly feeling the pinch too much.
You should certainly revisit the SWR analysis and then increase the withdrawals as you move along. Especially when you go through retirement and you *don’t* suffer the worst-case, you will be able to adjust along the way and likely ratchet up your withdrawals.
There is no rule of thumb. It will depend on your age and life expectancy. Also on asset valuations.
Sorry for the noob question, but if I’m reading your first graph right, 30yr TIPS at the current 2.5% outperform the 4% SWR at 30yrs (and possibly beyond). Is that right? Looks like ~22X nest egg for the same performance, but also with the HUGE added benefit of removing the risk of the 75/25 model. One may lose out if the market performs really well, but at the same time: no anxiety! What did I miss?
Correct, but there are a few caveats:
1: You wipe out the portfolio for sure in 30y. You cannot use this strategy in FIRE.
2: Thanks to more attractive asset valuations, your traditional SWR is now also higher, closer to 4.5%. See Part 54.
3: that 4.5% SWR is really the absolute worst-case failure. In all the other scenarios you’d have boatloads of money left over, while the 30y TIPS ladder predictably wipes out your portfolio.
So, stay tuned for that next post!!!
ERN,
Nice post; Perkins ‘formula’ is clearly wrong.
Having said that, I have long been interested in the idea of dying with zero, or any other arbitrary value, determined in advance. I am intrigued by your final chapter “A better way to model …” and am looking forward to your follow up post.
Are you familiar with this 2011 paper (and its 2017 follow up): https://obj.portfolioconstructionforum.edu.au/articles_perspectives/PortfolioConstruction-Forum_MilevskyHuang_Spending-retirement-on-Planet-Vulcan.pdf
Another method that may hold onto “the stereotypical Trinity Study approach” for longer could be constructed from the idea of running down your assets until you ‘need’ to annuitize, sometime referred to as the annuity hurdle approach, see e.g. the 2007 paper: Modern Portfolio Decumulation: A New Strategy for Managing Retirement Income by Richard Fullmer.
Thanks for the links. Will check them out.
I like the idea of “running until you need to annuitize”
A caveat would be that likely during that time you also face low interest rates and low annuity “yields”
But generally this approach is sound.
For info, the 2017 follow up paper I refer to above is available foc at:
https://papers.ssrn.com/sol3/papers.cfm?abstract_id=2944125
Good paper! Thanks!
Amazing take. I was really hopping for something like this. Finally someone who is not dazzled by this book and have a mathematical approach to this millionaire-opinioned book.
Funny that the FIRE’s reputation of extreme frugality is what made me adhere to it in the first place. Amazing how different people can be
Right: we want to be in the middle: Not as extremely frugal as some FIRE folks but more math-savvy than the Perkins book! I’m glad so many of my readers think the same way!
This book really is not for the Fire crowd it’s for the fatfire types out there. The math is wonky but the message is spot on and something missed by most people in their planning. You are going to die, and probably not when your spreadsheet says. It’s not about dying with zero, it’s about not dying with regrets and a giant pile of money.
FatFIRE is FIRE, too. Ask me or Fritz Gilbert (Ret. Manifesto) of Leif (Physician on FIRE), etc.
Both the Perkins approach and my SWR analysis rely on a rough estimate of life expectancy. Nobody claims to have a spreadsheet that tells you when you die.
As I mentioned in the post: the math in the book is so stupid, it would create massive overaccumulation for the FatFIRE types. The exact issue that you and Perkins want to avoid. So, unless we address that issue of a giant pile of money when we die, we have a problem.
What do you think about using the RMD rates as a more conservative approach to “Die with (closer) to zero”? They already incorporate longevity risk and start pretty conservative at 4.x% in one’s 70’s, 5.x% in early 80’s before ramping up to in late 80’s and 90’s.
I wonder if there’s somewhere where you can calculate what the RMD would be if it existed for 50 or 60 year olds.
Try the IRS single life expectancy table. Convert the life expectancy to a ratio.
Also a possible source of that information but not a good one because it’s not dependent on gender.
See Part 56 for the actuarial tool. You can find the life expectancy values there as well, for any age you like.
I don’t like the RMD approach because it short-changes you when you’re in the FIRE crowd.
Seems there is a practical way to DWZ (at least if you are rich enough in the first place), see: https://abnormalreturns.com/2023/10/10/dying-with-zero/
In 2016 he gave away his last $7m and he recently died in 2023. How did he live the last 7 years, I wonder?
Pensions, etc if he followed the suggestions of Milevsky, et al above.
Gotcha. He must have had a comfortable life until the end. Good for him. I’m glad he gave away his money to causes he cared about.
Very thoughtful written post as always! I had a question for you on the CAPE ratio. You often mention that a ratio above 20 results in lower probability of success using the 4% rule. But do you think this rule of thumb is worth a rethink?
For one, it looks like the ratio has been above 20 almost consistently for almost 30 years! Surely the 4% rule of thumb hasn’t been so off the mark for so long.
Second, what if different industries may warrant different ratios? For example tech is a far larger part of the S&P index right now. And if it fundamentally warrants a higher ratio, in theory the ex-tech S&P may not be as high as the headline number suggests?
Would love your thoughts. Thank you again for all your great and thoughtful work!
All excellent comments.
The mathematical logic works the other way around: All historical retirement cohort failures occurred when the CAPE was high. But retirement doesn’t have to fail just because the CAPE is high. It’s a matter of probabilities. Just because the CAPE has been high for a number of years doesn’t mean that we have to toss out the rule.
Second, the CAPE went as low as 12 (Shiller) and even 10.6 (ERN, adjusted model, see https://earlyretirementnow.com/2022/10/05/building-a-better-cape-ratio/) in 2009. So, while the general path is a bit higher, there has been a lot of variation in the CAPE. And it’s certainly true that the SWRs in 2009 will turn out to be much higher than in 2000 at the peak (even though we need to wait much longer to find out for sure).
Agree! Different industries with different growth rates can sustain different CAPE ratios. I think that’s the main reason the USA has a much higher CAPE than the rest of the world. Likely permanently. So, maybe the precise cutoff might have shifted a bit. Maybe historically 20 was the cutoff, and now the danger zone starts at 25. But the CAPE is still a valid valuation measure.
Excellent! Thank you for the thoughtful insights once again.
Any time!
One thing I heard the other day that I found interesting was a conversation where the question of returning to historical interest rates was discussed. The general thought was that our last 40 years has been declining interest rates were debt could be refinanced in the future without problems. If we are in a rising rate environment or it just stays elevated from the last 40 years what are the implications. Is that at all predictable etc. Just seemed like an interesting angle to think about.
Yes, we’ve had a regime change.
I cross my fingers that we’ve seen the rate peaks in the 10y and 30y bond rates and we will hopefully star another bond bull market as rates move down again closer to 3-3.5% again.
Sitting on the edge, waiting for your next post on how locking in higher rates and more bonds can be a better safeguarding for sequence risk…..I’m Ok to give upside away…it’s the downside potential that bothers me and has me still not in Early Retirement. Hopefully your post will make me jump 🙂
Too busy in retirement. Hopefully before interest rates tank again!
I’ll go back and read this because I always enjoy your posts. However I confess I stopped when you said the difference between you two was that Bill Perkins has a 9 digit worth. I’ve read as much as $400M. Then I read more about his lifestyle etc. I think you can live a perfectly great and rewarding life off say a few million to 5. Chose your #. So Bill would need to spend and/or give away >98.8% of his net worth and still live a completely acceptable lifestyle with great experiences. So yeah not much at stake these days for Bill and it makes whatever he says questionable. It is when the margin is less that this notion of “die broke” comes with real concerns and risks. Not going to buy the book. Will read your post.
Yeah, very true. I haven’t heard that he’s given away massive amounts of cash to scale back his own net worth. Or maybe he has such a large retirement budget that needs all this cash. Either way doesn’t look very relatable.
Barely made it through 2 chapters in Die with Zero. The entire book is one idea that could have been summarized on a postcard, just repeated page after page after page.
It’s a hard read. Probably went through multiple ghost writers and added it all together to get to 200 pages. Hence the repetitiveness.
Patiently waiting for the write up on how a SPIA with 2% COLA would effect SWRs. Maybe replacing a portion of the bonds. I’m attracted to the Safety First method from a psychological standpoint. Hoping to see some analysis!
Early next year! 🙂
Isn’t it time for you to write your final SWR Post with a summary of what works, what doesn’t and what you’re using?
I was just reading the GK one and wondering if that doesn’t work, what in the world should we use? I just can’t read 60 posts again. Since they come in drops, I end up forgetting most things. If we had a final summary post it would be awesome! Thanks a ton for all you do.
As in any academic and scientific pursuit, there’s never a true end. But I will hopefully wrap up my findings so far and publish a book some time next year.
I think most people miss an important part of Perkins’ thesis, which is that the accumulation phase needs to evolve into a spending phase, and is most notably phrased in the title of Chapter 1 “Maximize your positive life experiences.” We’ve just retired, and our saver mentality is still very strong, and we resist spending money for a unique dining experience because we can get (almost) the same food for 1/4 of the price.
We’ve gotten so engrained in being thrifty that we run the risk of not getting the maximum enjoyment with our hard-earned savings that we potentially miss out on things that we’d regret not doing later on in our years when we can no longer even make the trip. We went on a hike up Rainbow Mountain in Peru as part of our Machu Picchu/Galapagos adventure, hitting the peak at 16,000 ft, but that’s not something we might be able to physically do 10 years from now.
For me, the takeaway from Perkins is not the financial or mathematical calculations, but the notion that we ought not necessarily be so concerned about capital appreciation/preservation and spend just a little more effort in experiences appreciation, particularly in our go-go years. So Perkins isn’t necessarily saying something different financially, but he’s saying something different experientially.
Give your kids money now, when they potentially need it the most and you can at least see if they did something wise with their windfalls, rather than leaving them a big bucket after you die, when they’re likely to not really need it and you can’s see what they do with it.
Spend the $600, or whatever, at French Laundry, or similar, so that when you die, you won’t be thinking, “Gee, I wonder what a dinner at French Laundry would have been like?” and not worry about the $6037 less you would leave for your heirs 30 years from now. Of course, that’s easy to say if you have a sufficiently big enough bank you’ve saved and earned, I suppose. Nevertheless, we did the hard work to get here, but “enjoying one’s retirement” does involve a sizable mental shift to use your 4%, or whatever percentage, to maximize your experiences and essentially build a different nest egg of memories to enjoy in your slo-go and no-go years.
All good points, thanks for sharing. I agree that some of the softer, psychological content is useful. Just not the quantitative part. Maybe he should have just left the math part out of the book then?
“Die with zero” sounds like it is straight out of WEF playbook. Another dangerous idea in FIRE. Perkins is 1-2 bad movie deals from being a thousan-aire, not a 9 figure guru.
Retirement appears to have two states of death and two states of net worth. Death = quick or long costly health battle then death and Net Worth = runaway or diminishing purchasing power. Most can afford a quick death, few can afford a long costly health battle (Dementia, ocular degeneration etc at 70 yrs old with otherwise good health can costs $12K+ per month in today $’s for 20 years) regardless of net worth. The risk is to end up with diminishing purchasing power and long costly health issue. This is why determining a runaway SWR is vital to mitigate the long health battle reality.
Haha, that’s a funny take. Never thought we could link the WEF to his approach! I’ve been to Davos for skiing and it’s sad that the WEF now gives this beautiful mountains town a bad name.
Good analysis on the 2 different scenarios for everybody’s eventual demise.
Because of that expensive scenario I will refrain from giving away too much of our portfolio. We will still be generous but we also hold on most of our cash for exactly the reason you mention.
Having retired and set an initial SWR for the next say 40 years, what’s the best way of tracking what actually happens over future years, to determine whether you’re likely to die with zero, die with millions, or run out of money too soon? i.e. how/when might I have reasonable confidence that I can increase spending on more go-go years experiences, or might want to reduce spending to avoid panicing?
I suggest you recalculate your SWR yearly to see if you’re still on track. You might find that you can increase your withdrawals or you might want to cut your budget.
It strikes me that recalculating SWR every year and fully adjusting up or down degenerates to a fixed percentage withdrawal strategy, unless you’re also recalculating/changing the SWR percentage each year (which I suspect you would recommend using your SWR spreadsheet). But in the simple case (say a 3%, 3.5%, or 4% SWR), it degenerates to a fixed percentage annual withdrawal rather than an inflation adjusted stable withdrawal strategy. That would cause it to have the downsides of a fixed percentage withdrawal strategy, such as:
1) Becomes too low $ amount to be practical late in retirement in a scenario where the portfolio would have depleted at the max planning age.
2) Would require very uneven spending.
2) Ratcheting up when recalculated SWR calculation should generally be sound, but as I believe you commented long ago in a response in an earlier SWR article, can be risky as it may push up to the worst case and if future is worse than past, it could significantly increase risk of failure.
I suspect you didn’t mean 100% switching to a newly calculated (restarted) SWR every year.
Any clarifications around how you would mitigate above while retesting SWR annually? Thanks!
Agree with the ratchet up. If the market doesn’t drop, then you simply move up the withdrawals.
If the market does drop and you condition your SWR analysis on the market drop then you don’t have to ratchet down. At least if the market drop is not as severe/swift as in previous historical bear markets in the SWR simulations.
Thanks for your thoughts. I think it’s worth me at least tracking initial SWR + annual inflation adjustments against latest recalculated SWR based on latest asset values. I’m sure there will be quite significant differences at times. When the difference is more than say 50% I suspect many will adjust their spending habits.
Correct. Though. it would take a while to see a +50% in spending. Most people will ratchet up their withdrawals before then.
I find this really interesting as a non- American. I live in Australia where if you buy a principal residence and keep it for 30 years and it goes up by $20 million it is tax free when you sell it. Many people have done it and there is a guy named John Symonds who owns a prime property in front of Sydney Harbour trying to sell it for $200 million tax free. This is why we call Australia the lucky country! One is even allowed to set off investment property losses against your salary and pay a low rate of tax by reducing your marginal rate of tax. Real estate speculation is rampant here due to this negative-gearing tax perk. We don’t need to go into fancy finance strategies or FIRE strategies to retire early very wealthy here. Borrow as much as possible and buy as much as possible or keep upgrading your principal residence to more and more expensive properties in blue chip suburbs is the strategy here. This is a very desirable place to live and a massive housing shortage. Demand and supply as per Economics 101 is the wealth strategy by speculating on real estate. I worked in finance and have done option trading and other strategies but most probably a mistake as piling into real estate would have been the better strategy to retire early.
Thanks for sharing! I didn’t know that. That’s a huge incentive to own property. But in an efficient world it will be priced in and likely explains why real estate is so expensive in Australia.