
Update: We posted the results from parts 1 through 8 as a Social Science Research Network (SSRN) working paper in pdf format:
Safe Withdrawal Rates: A Guide for Early Retirees (SSRN WP#2920322)
Welcome back to our safe withdrawal rate series! Over the last two weeks, we already posted part 1 (intro and pitfalls of going beyond a 30-year horizon) and part 2 (capital preservation vs. capital depletion). Today’s post deals with yet another early retirement pet peeve: safe withdrawal rates are likely overestimated given today’s expensive equity valuations. We wrote a similar piece about this issue before, but that was based on cFIREsim external simulation data. We prefer to run our own simulations to be able to dig much deeper into this issue.
So, the point we like to make today is that looking at long-term average equity returns to compute safe withdrawal rates might overstate the success probabilities considering that today’s equity valuations are much less attractive than the average during the 1926-current period (Trinity Study) and/or the period going back to 1871 that we use in our SWR study.
Thus, following the Trinity Study too religiously and ignoring equity valuations is a little bit like traveling to Minneapolis, MN and dressing for the average annual temperature (55F high and 37F low, see source, which is 13 and 3 degrees Celsius, respectively). That may work out just fine in April and October when the average temperature is indeed pretty close to that annual average. But if we already know that we’ll visit in January and wear only long sleeves and a light jacket we should be prepared to freeze our butt off because the average low is 8F =-13C! Likewise, be prepared to work with lower withdrawal rates considering that we’re now 7+ years into the post-GFC-recovery with pretty lofty equity valuations.
How do we account for today’s equity valuations? Very simple, we run our simulations and then compute success probabilities, not just averaging over all observations but we also bucket the over 1,700 possible retirement start dates in our study by how cheap or expensive equities were at the time. We’ll do so by looking at the well-known CAPE Ratio.
A quick CAPE ratio primer
The measure for equity valuation we use is the CAPE ratio. We are all familiar with the PE ratio. Price divided by earnings measures how much you’re paying per dollar of the current annual earnings (normally a four-quarter trailing E, though PE ratios based on estimates of future earnings are common, too). This is done both on the individual equity level, but also for an index, e.g., the S&P500.
Robert Shiller, who is one of the 2013 economics Nobel Prize winners, introduced another interesting concept: The cyclically-adjusted price earnings (CAPE) ratio (see free data on Shiller’s site). It divides today’s index level by a 10-year rolling average of real (CPI-adjusted) earnings. Think of it as the average real earnings over an entire business cycle. Shiller found that the usual PE ratio is a bit too noisy; remember, you divide two highly volatile series P and E. However, making the E portion of the PE less volatile apparently gives you a sharper predictor of future returns.
The median CAPE ratio is just about 15. Which is quite intriguing because if we were to invert that number 1/15=0.0667=6.67% (= CAEY = cyclically-adjusted earnings yield) we’d land almost exactly at the long-term average real equity return of around 6.6% (see more details here). That’s more than a coincidence because the real return on the index should roughly equal the average real earnings yield in the index. Since 1871, the CAPE was anywhere between 5 when stocks are really cheap at or near the bottom of recessions/bear markets to over 40 at the height of the dot-com bubble. And most importantly:
The Shiller CAPE is correlated with future equity returns
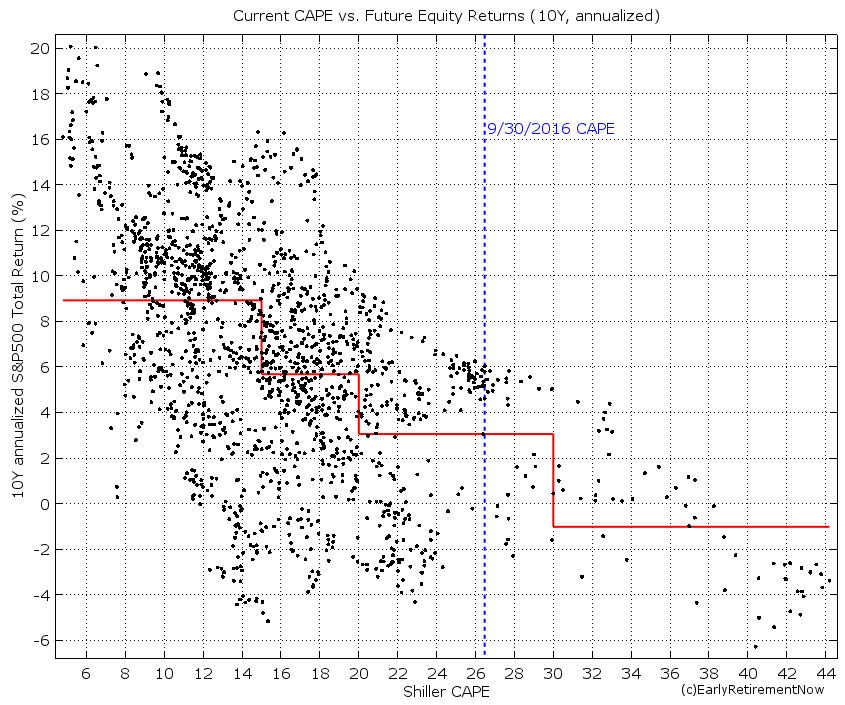
That’s right, today’s CAPE ratio is pretty good at predicting future equity returns. Well, not perfectly but there seems to be a strong and statistically significant inverse relationship between the CAPE and forward-looking equity returns, see chart below where we plot the CAPE ratio versus the subsequent 10-year annualized S&P500 return. For something as ostensibly unpredictable as stock returns, this is truly amazing. Equity returns are not exactly a random-walk! If we split the CAPE into four regions we get pretty different average equity returns by bin:
- CAPE below 15 (below the median): Average equity return of 9% real (!)
- CAPE slightly elevated (15-20): Average equity return just under 6%, still very solid returns that will likely support a 4% safe withdrawal rate.
- CAPE moderately elevated (20-30): Only about 3% real return (!) going forward. Today’s CAPE falls into this range. The 9/30/2016 level was at just under 27, and after the recent rally, it’s even a bit above 27.
- CAPE severely elevated (30+): A below -1% real return over the next ten years. Bummer! Good luck starting your retirement in that environment!
Simulation results
Let’s look at the Success rates over 30-year (top panel) and 60-year horizons (bottom panel). The charts have the familiar format you might remember from before, plotting the success rates as a function of the portfolio equity share (rest invested in 10Y Treasury Bonds). In this chart, each line corresponds to the success rate of a different CAPE regime at the beginning of retirement.

Quite intriguingly, over the 30-year horizon (top panel) and for equity weights greater than 40%, every single failure of the 4% rule occurred when the CAPE was above 15 at the start of retirement. In contrast, for all CAPE<15 you have a 100% success rate. You get close to a 100% success rate with a 75+% equity portion and the CAPE<20. I wish the original authors of the Trinity Study had dug deeper into when those failures occur.
Also, did we mention that a 30-year horizon is an entirely different animal from a 60-year horizon? Oh, yeah, we pointed that out before, but to state the obvious, success probabilities are much, much lower over the longer horizon.
Anyway, the current CAPE of 27 falls smack into the 20-30 region represented by the yellow line. At a 60-year horizon with capital depletion, we are now looking at a 72% success rate with 100% equities (much lower than the 89% success rate over 30 years). Quite amazingly, lowering your equity share in response to expensive equity valuations will actually lower (!) your success probability. How crazy is that? True, for a seriously overvalued equity market (CAPE above 30) you do get a bit of a hump-shaped curve (see the maroon line in the bottom panel) with a sweet spot between 70 and 80% equity weight (same is true for the 30-year horizon with both the 20-30 CAPE and 30+ CAPE). But for the other three lines in the bottom chart, including the yellow line representing today’s regime, we see that the success probability is solidly increasing monotonically in the equity weight. Equities rule when you’re looking at a 60-year horizon! Again: due to the long horizon, investing in equities is the way to go even if they are overvalued in the short-term. Bonds with a 2.6% long-term real return just threaten your long-term sustainability as we mentioned here. (Of course, one solution would be to have a higher bond share only until equities return to a CAPE<20 and then increase the equity share again. But we haven’t calculated that yet.)
Higher final value target
As we stated previously, a zero final asset value is not acceptable to us due to our strong desire to leave a bequest. As expected, once we target a higher than zero final asset value, the success probabilities diminish even more, as we pointed out previously. Below are the charts for targeting a 50% final asset value target.

Now even the CAPE regimes of below 15 or 15-20 no longer guarantee success over a 60-year horizon (or even a 30-year horizon for that matter). Bummer! The only good news is that the higher final asset target only lowers the success probability to 71%, from 72% (bottom chart, yellow line, 100% equities).
Let’s lower the SWR to 3.5%
Lowering the withdrawal rate to 3.5% should improve the success rates, as we pointed out last week: at 100% equity share we had a 96% success probability preserving 50% of the final value after 60 years. That rate goes down to 88% when the CAPE ratio is between 20 and 30. Of course, for CAPE values below 20, the 100% equity portfolio had a 100% success rate, both over 30 and 60-year horizons. Nice to know, but again, today’s CAPE is at 27. For me personally, a 12% failure probability is still a bit too high.

How about 3.25%?
To insulate ourselves from running out of money we likely have to lower the SWR all the way to 3.25%. Now we can get all the way to 97% success probability with 100% equities and even close to 100% with an equity share of 80-90%, see chart below.

I wouldn’t want to get my hopes too high about the benefits of bonds, though. Despite the recent rally in bond yields (and the resulting pummeling of bond prices) since November 8, yields are still extremely low by historical standards. For example at 2% annual inflation and around 2.5-2.6% yield for the 10Y Treasury Bond, we are looking at 0.5-0.6% real yield. Much less than the average 2.6% real return!
Update (2/7/2022): As suggested by reader AndyG42, I should point out that over the years, my views on the 100% equity portfolio have evolved. It’s certainly true that the probability of failure is small but if you like to eliminate the chance of a failure in past historical cohorts, you’re better off with a lower-than-100% equity weight, likely somewhere around 70-80%.
Conclusion
We face a triple-whammy of bad news when it comes to safe withdrawal rates and using the Trinity Study data for our purposes:
- We have a longer retirement horizon. My wife will be in her mid-30s when we retire and her family seems to have a longevity gene. We like the money to last until my wife is at least in her mid-90s. We face a 60-year retirement horizon, twice the longest horizon the Trinity Study considers.
- We like to leave a bequest
- Today’s equity expected returns could be low due to the current sky-high equity valuations
All of that does not bode well for the 4% rule. To push failure rates of the withdrawal strategy to a low enough level, we’d likely have to lower the SWR to 3.25%.
Quite intriguingly, bonds don’t offer much benefit for the success rates, unless stocks are wildly overvalued, with much higher CAPE ratios than today’s value (>30!). For CAPE ratios below 30, mixing in bonds has either only a marginal benefit or even lowers the success probability.
What we learned so far: The Trinity Study and many in the FIRE crowd seem to recommend a generous withdrawal rate and conservative stock vs. bond allocation. But with a 4% SWR and 70-80% equity weight you have a roughly 1 in 3 chance of wiping out your money after 60 years. We want to do the opposite: A conservative withdrawal rate (e.g. 3.25%) and a generous equity weight (e.g. 100%). Who would have thought!?
Is there a good way to figure out International Valuations, or Emerging Markets valuations? I might have missed, but this seems to be discussing US.
Everyone always just refers to Star Capital’s page: http://www.starcapital.de/research/stockmarketvaluation
Yes, that’s the one! Long simulations are not possible with the international data. Going back to 1871 we’ll have to rely on U.S. data. But we can definitely look at the non-U.S. CAPE ratios.
Thanks, jp6v!!!
Thanks!
Outstanding stuff as usual, ERN! Great analysis.
Portfolio allocation is such an important part of all this as you rightly show. Which, to my mind, means there’s almost no argument for keeping any coin in government bonds. (Which you’ve talked about in the past.) Without overheating any Monte Carlo machines around here, my feeling is that, by reducing Treasury exposure and reallocating those funds into vehicles like real estate and P2Ps, the modeling would show superior longevity results when starting in a high CAPE valuation environment. And I think results would be especially susceptible to improvement given the current high-CAPE/low-r environment we’re in.
I think you make another great point in passing that relates (gasp) to a market timing of sorts. By adjusting withdrawals to emphasize reductions in relatively “overpriced” holdings, we’d likely be able to juice results. (I think the PIEs wrote about something along these lines not too long ago.) Which is where I think your results showing better performance for 100% equities portfolio when starting in a high-CAPE environment come from. By starting with all equities, there’s imposition of a de facto rule to sell only “overpriced” stock assets during the first phases of retirement. This same rule could be more formally applied to a non-100% equities portfolio to even better effect.
All of which is to say: Muchas gracias for this awesome analysis. Without the deep dives you’ve done with the modeling and analytics, we’d never be able to do anything more than blindly conjecture about strategy. This is all very, very interesting and valuable work, ERN. Many thanks as always, and holiday cheers to y’all!
That’s a great point: Don’t move to equally expensive bonds as an alternative to expensive equities. Real Estate (doing that already) and P2P lending (have to explore more before investing there) would be viable methods to juice up the expected returns. Not to mention put-writing as we wrote about a few weeks ago (https://earlyretirementnow.com/2016/10/05/passive-income-through-option-writing-part-2/) which can also do well if equities move sideways for a while.
Thanks FL, great comments as always!
ENR, this is an excellent piece of analysis, very insightful, as usual!
The implicit assumption in the simulations is that the future long-term real return on equities will be equal to the historical one. That is, if you FIRE today with high CAPE, after 10 years of ca 3pct returns you will enjoy 6pct average return for the next 50 years. This may or may not be true going forward for a variety of reasons. Thus, an interesting question to ponder is this: if the average long-run real return on equities is going to be 4 or 5pct, AND the CAPE is high today, what does that mean for SWR? A forgotten attempt to answer this question can be found here: http://raddr-pages.com/research/enhanced_monte_simulation.htm, although it ignores the starting valuation levels.
I am really curious whether the answer will be a) whether the LT return is 4pct or 6pct does not matter, it is really the first 10 years which define the SWR or b) for a 60-year long retirement LT return matters a lot, and with high CAPE today and low expected LT return, the SWR can dip quite below 3%. My gut feel is a) is true for 30 years, but b) is true for 60 years 🙁
WDYT?
ERN, apologies for the typos…
Haha, no problem. Happens to me all the time!
Thanks OT. That’s an intriguing method. The reason why I also prefer to use actual past return data is that Monte Carlo doesn’t capture that mean-reversion along the business cycle. One solution would be to run the MC exercise as you quoted with a lower E(r) and some additional reduction in the first 10 years. Have to think more about this…
Cheers,
ERN
You can build a simulation that takes into account low yields and high valuations and then autoregresses to historical averages (or any other number you want). I’ve done it here in python code: https://github.com/hoostus/prime-harvesting/blob/master/montecarlo.py#L10
Wow, this is serious stuff. Thanks for sharing!
I don’t like the 4% SWR when you’re so young either. A lot of things could and would go wrong in 60 years. It’s better to keep the withdrawal rate as low as possible when you’re young. Before 50, it’s be best to supplement your income with a little work here and there. In 2017, I’m afraid of the high valuation too. I’d be very hesitant to early retire if I had just 25x without any backup plan. Great post!
Thanks! Completely agree. Supplementing income when young is the best way to overcome that sequence of return risk.
Cheers!
ERN
Last week, 3.5% was the new 4%.
This week, 3.25% is the new 3.5%.
I can’t wait so see what happens in the next installment of this series!
I agree with you and your numbers, though. My plan has been to keep 25 years of expenses in a traditional retirement / capital preservation ratio (60 / 40 to 80 /20 — probably leaning towards 80 / 20) and the overage in 100% stocks. In other words, the bigger the portfolio, the higher the stock proportion. I haven’t had a good reference to support the plan other than common sense, but this does the job well.
We are currently 90 / 10 with about 30x current expenses in retirement funds, but also still working for at least a couple years. Thank you for the insightful research, Doc ERN!
Best,
-PoF
Thanks Dr. PoF! Glad you liked this post! Yup 3.25% is the new 3.5%, which was the new 4% from last week. Go figure. But if everybody is really nice to me I’ll ramp it back up to 3.50% once we take into account Social Security payments! 😉 Stay tuned for future posts in the next weeks.
Cheers!
Great analysis as always ERN. I wonder if we can introduce a practical element that retirees can adopt regardless of their starting WR. Faced with declining equity market in the prior 12 months, a retiree can choose to withdraw only 95% of their prior year withdrawal. Most people can manage to cut 5% of expenses for short term without feeling a big pinch. Alternatively, they can choose to forego inflation raises for 1-2 years till the market recovers. I wonder what this behavior does to the success probabilities for each of the above SWRs you projected.
Thanks, TFR! Great comment. Lowering the SWR temporarily is something I will personally do. My suspicion: foregoing CPI-adjustments for a year or two or a one-time cut by 5% may not be enough. If the baseline fails spectacularly then so will the small adjustment in spending. But I will think how to model this quantitatively!
Cheers!
Thanks ERN. Because a retiree is faced with a probabilistic choice on withdrawal rates in this deterministic world, I have moved away from indexing to dividend growth investing in recent years. It allows me to model income with a better clarity and REITs form an important part of the allocation, in lieu of P2P or other bond substitutes. Even what happens to dividends during deep recessions can be modeled based on data to avoid selling stock at extremely depressed valuations. I have a post coming on this topic by second week of Jan. Would love to have your inputs on it. Happy holidays!
Thanks! That’s an intriguing idea to use the dividend flow to avoid liquidating stocks at the bottom. I tried some of that here: Cash Management in Early Retirement and for the broad index like the S&P500 at least the dividend flow is insufficient to fund expenses (hence the case for the cash cushion). But maybe some high-paying dividend stocks, like REITs or the so-called Dividend Aristocrats might do better. I hope they do. But the concern is that some of the high dividend yield stocks will cut the dividend if business gets tough. Looking forward to your research!
I just found your website; great stuff.
Your comment, “Of course one solution would be to have a higher bond share only until equities return to a CAPE<20 and then increase the equity share again. But we haven’t calculated that yet.", has been calculated by Kitces and Pfau, "Increasing Retirement Withdrawal Rates Through Asset Allocation" (AAII, 4/2015). They conclude that a dynamic, valuation based equity approach – decreasing equity exposure to 30% in years when CAPE below (approximately) 10, increasing equity exposure to 60% when CAPE above 21, and allocating 45% stocks when neutral valuation – provides the highest safe maximum withdrawals over 30 yr. retirement periods.
Comments?
Matt
Hi MBC! Thanks for stopping by!
The problem with these cutoff numbers is they were created based on the historical valuations. This is a common error when backtesting data. We don’t know that the valuations will be similar in the future. Given the low bond yields, stock valuations could be this high for many years and you will have missed all of those gains while sitting on the sidelines waiting for a price that never came. This is the same argument against market timing which is exactly what you are attempting to do by adjusting your asset allocation based on the CAPE. The expected returns are still higher for stocks than for bonds so putting any allocation in bonds will lower your overall expected returns. The CAPE should only be used to inform realistic returns not to time the market.
Good point! Thanks for sharing that!
Awesome figures and explanation. Loving this series!
I am looking forward to your case studies and also how SS may factor into the equation. Again, I am stunned by the 60yr horizon projections based on current valuations. If that does not get aspiring early retirees to sit up and take notice, I don’t know what will. What do you make of the strategy of selling particular assets (equities when CAPE is high) to increase your chances of portfolio longevity? Darrow over at Can I Retire Yet did a few posts on this concept.
If you are thinking of a case study, what about including one where there is a small base income, perhaps from a small pension or side hustle? The small but not insignificant pension is our base income situation…..
Wishing you and family a relaxing and merry holiday season. Cheers to y’all!!
Thanks, Dr. PIE! The small base income (consulting income, blogging???, Pension, etc.) is obviously a big help. If this is steady income, I would simply still do that same as before: Withdraw a % out of the net worth and supplement with the income from the pension. The pension income would only be relevant when we do any kind of dynamic withdrawal. Then we can lower withdrawals from the nest egg by x% but suffer a loss in consumption by less than x% due to the pension.
I will look more into the issue of Social Security, so a steady income at a later date that causes me to lower the withdrawals in the future. Good idea!
Merry Christmas/Happy Holidays to you too!
Love this analysis ERN – fantastic! And yet, so depressing? Looks like I better jack up my target nest egg amount by another $1MM or so? Ha, ha.
In a high CAPE environment, I suspect the value of Social Security or other guaranteed annuity payments will be quite high. It’s analyses like these that make me appreciate my pension a little more each day!
Great article!
Thanks! Yes, exactly, having any kind of fixed payment, independent of withdrawals from the nest egg is worth a lot: a) just subjectively for the peace of mind, and b) when the CAPE is high interest rates are normally low and so the discounted value of a fixed income stream has a high value.
Great point!
Cheers!
Great posts in this series so far! This must have taken some time to put together. I’m very grateful that people like you guys exist to figure this stuff out because I would have no chance!
Thanks FWPT! Yes, that took some time to get it running, but it was great fun, too.
Cheers!
Big ERN, best series I’ve ever seen on withdrawal rate, great analysis. Can’t wait for the rest (let’s hope you don’t keep ratcheting down the SWR!
Ironically, we’re targeting 3.5% when we FIRE in Jun18, but I did mine more on “gut” than deep analysis. Love CAPE theory, and felt highish valuations today don’t bode well for returns, hence the more conservative 3.5% (may have to consider 3.25% based on your work). We’re looking at a 40 year horizon.
Asset allocation, agree with earlier comments, and supplement our mix with P2P, REITs, some commodities, and option trading. Roughly 50%(equity), 30% (bonds), 20% (alts and cash). Building a bit of cash over the past month on the Trump Rally, will reinvest on the next dip. Keep up the great work!
Thanks TRM! Well, the good news is that I presented the bad news first. Just to shake up everybody. 🙂
But with Social Security/Pension payments we can probably ratchet the SWR up again. Not much, but Part 3 is probably as bad as it gets in terms of bad news.
Yes: option trading is a good one, so is P2P lending (have to explore that some more).
Cheers!
Good stuff. I’ve been hoodwinked into thinking “balanced portfolio” forever. My wife and I are currently 55 looking at retiring asap. Have socked away north of $2 million but sitting on “only” 55% equities. Waiting on a dip to up that based on confidence gained in reading your stuff. Thank you!
Thanks, Kelly!
Ahh, that dreaded waiting for the dip. But who knows, 2017 could start with a big stock market dip again like 2016. Get your cash ready! 🙂
Cheers!
Why do the charts have different values at 0% equity?
Very good question. Even if you don’t have equities, the bond market apparently has different future returns depending on what equity valuation regime we’re in.
Cheers!
Thanks, ERN — great stuff!
You mentioned in Part 1 that your simulation included 9 different withdrawal patterns, though the analysis in Part 2 & Part 3 uses “withdraws a fixed amount at the beginning of the first month and then inflation-adjusts the withdrawals every month” for the charts and tables. Are you going to dive into salient impacts of different withdrawal techniques?
I’m particularly interested in some of the rules-based ones (e.g., Guyton-Klinger) which seem to have promise if you can stomach reduced spending in down years.
Two additional topics you might consider exploring:
* Simple flavors of market timing (e.g., changing % equities/% bonds based on CAPE or prior year’s returns)
* Belief updating: assuming we will have these simulation tools available to us for the entire life of our retirement, it’s likely that we’ll be running and re-running retirement scenarios every year (month? week?) that include current portfolio value, recent bond returns, CAPE, etc. These simulations may tell us to change our withdrawal method or amount in years 2, 3, 4, or beyond. The simulations you’ve run assume that once you start retirement, you choose a withdrawal method and stick to it forever; though I doubt that’s a realistic assumption! I figure if you’re as deep into the weeds on this stuff as the average ERN blog reader, you’ll probably be fiddling with your withdrawal rate all the time! It’d be interesting to see the impact of this included in the simulations.
Thanks Kevin!
Right now I’m doing only that stubborn “set it and forget it” scheme. I will also explore the possibility of Social Security/Pension at a later date, shrinking the withdrawals (i.e., not fully adjusting for inflation).
The advantage of doing it this way: Computationally it’s very easy. You compute just one number per sim (either the maximum possible SWR to exactly reach the target or one final $ number given the SWR). Then we can easily compare the success of one rule. SWR=4% gives you $400k as final value for one date and $500k for another. Very easy to compare what’s a success, what’s a failure, and outcomes can be ranked along one dimension.
Very different story with the dynamic rules: How do I compare 60 years worth of withdrawals? 720 numbers per simulation. If I show you two streams with 720 numbers each, which do you prefer? There are some simple rules (mean-variance trade-off). But it’s all subjective then what’s a success and what’s a failure. I will write something about the dynamic rules in a later post, but I can’t guarantee that everybody will be happy. 🙂
Cheers!
Wrote about the Guyton-Klinger in today’s post (part 9)!
Very cool analysis ERN. I’m really enjoying the series. I’m personally not a big fan of CAPE only because so many market timing folks use it for trend watching. There are so many risks because earning reporting requirements change significantly over time. That being said I do agree regardless in this application that the market is on the upper end of valuation, so it’s appropriate for your analysis as the best proxy we have over history. Keep up the great articles.
Same here: CAPE is not that useful for timing the stock market. If you had sold the S&P500 in the late 90s when the CAPE was at 27 you would have sold way too early.
Cheers!
The only problem I have with this analysis (or any other based on historical data), is that they only use US stock data during the huge equity boom of the last century. If you look at the performance on the international market, credit suisse indicates a SWR of ~3% globally. Past performance is no indicator of future returns as they say, and I doubt the US continues outperforming everyone else going forward.
Good point! Well, it helps to not have entire continents ravished by two world wars. That’s another reason I prefer to just stick with U.S. stocks going forward.
Based on research like yours, the Trinity study, and others, I’m looking towards a 3% SWR, smart spending/ frugality, and part time work to keep me in a good place and increase my chances of long term success. Thanks for your efforts on this!
Thanks, Arrgo for stopping by! Yes, low 3% it is for us as well. But it’s not set in stone: once the equity valuations come back to more normal levels we can see ourselves going towards 4% again!
Cheers!
Nice write-ups and charts, but this really has to be taken as an introduction to the real thing (variable withdrawals). Nobody in their right mind would use a flat 4% (or whatever X%) for a 30 years to 60 years retirement, irrespective of the market roller-coaster. There is really WAY TOO MUCH research that solely focuses on the SWR number, which is in truth is pretty much a meaningless metric, aside from giving you some kind of very coarse target when accumulating.
Now, I am curious to see how you will analyze and compare variable withdrawal models (hopefully including the Bogleheads VPW in the mix). This is actually tricky to do… Been there, done it! 😉
Thanks. I personally view this “set it and forget it” rule mostly as a baseline. True, nobody would strictly stick to it regardless of asset returns. But caution: this is a double-edged sword. That dynamic rule can also blow up in your face. Look at this example:
Someone starts retirement, and withdraws 4% p.a. Then the market keeps going up and the person also raises the withdrawal rate and readjusts to 4% after every new stock market all-time-high. Then the market tanks, but he doesn’t lower the withdrawals because of a) lifestyle inflation (got used to ever increasing standard of living) and b) because he takes the Trinity Study too literally. You almost guarantee that he’ll exhaust his money that way. Dynamic withdrawals are the hardest when they mean you have to curb your consumption. In that sense the SWR-set-it-and-forget-it isn’t such a crazy assumption. I will personally do something more sophisticated, but the SWR is a good start.
Cheers!
This is a fantastic series, really enjoying the blog so far. I’m a bit uncomfortable relying on a 4% SWR not so much for the technical reasons you describe, but for behavioral reasons. Over a 50-60 year time frame I just can’t predict how much I will really need or want to spend. I can’t foresee personal disasters that may inhibit my ability to spend 4% and stick too it. At very high savings rates and frugality going from 4% to 3% takes less than many people suspect, especially if market returns are at least average. Here is a link to my last post on the 4% rule you may find interesting. http://thehappyphilosopher.com/dangers-of-relying-on-the-4-rule-in-early-retirement-scenarios/
Looking forward to the rest of the series. Cheers!
Thanks! That’s an excellent article.I’m glad that a lot of us in the FIRE community agree on the new realities of SWRs! Happy New Year!
Hey ERN, you may already be aware of this, but if not, I like to use this correlation for future market expectations. It has a much tighter fit compared to Shiller CAPE (r_squared of 0.913 vs. 0.664).
http://www.philosophicaleconomics.com/2013/12/the-single-greatest-predictor-of-future-stock-market-returns/
Also, thanks a ton for all the work you put in to this analysis! Very much appreciated! 🙂
Thanks for the reply! That’s a very intriguing study. Makes perfect sense, qualitatively. The current outlook seems to be less-than-average returns from both a CAPE and that new allocation measure. One issue I don’t like: I’m interested in real returns, not nominal. I wonder what’s the correlation between the different measures and 10Y forward real returns? Does it still beat the CAPE in real space? Unless you have the ability to perfectly forecast 10Y forward inflation, I prefer the real return correlation.
But thanks for stopping by and for that thought-provoking comment!
Happy New Year!
Good point. I went back and ran the calc using Shiller’s data for real return, and the fit has an r_squared of 0.744, so definitely not as tight as nominal, but still better than CAPE (and a more linear fit as well).
Ha, that’s what I thought. It’s still a kick-ass correlation.
Thanks for sharing!
Someone plugged your work on Bogleheads.org: https://www.bogleheads.org/forum/viewtopic.php?f=2&t=207069&newpost=3175293
Awesome! Thanks for the note!
ERN: I’m really becoming addicted to reading your blog, and although some of it is too technical for me, it seems your statistical analyses and conclusions are pretty accurate. I’d like to ask a question, and offer some cautions:
1. Your describe a CAPE of 27. Is that just for U.S. equities? What’s the CAPE for international equities, and does it have the same semi-predictive powers as it does for U.S. equities?
First Caution:
2. I’ve seen a few people in the comments discuss P2P as an alternative to bonds. Over the past 5-6 years, I’ve invested a mid six figure sum in P2P, and I’m done. The returns are typically great in the beginning, but quickly diminish to where the annual loans losses pretty much wipe out the interest income. (This is observed over thousands of small P2P loans I’ve made.) These results, however, are often masked because people reinvest their interest, and it therefore pumps up the return stated by Prosper and LendingClub, and the lenders don’t really notice that their seasoned loans are non-performing. (If your new loans really are yielding 15%, then it brings up the overall stated return shown, but if you stop reinvesting, eventually the truth will become known.) So I decided that perhaps the issue was from doing non-secured lending. So I started P2P lending to subprime auto borrowers (who were paying 30% interest) and secured against the vehicles. Ultimately, that also is turning out not to yield nearly what I expected. The only true, consistent, high-yield I’ve found is giving hard money mortgage loans to people and securing it by the first lien on their property and by insisting they put down sizable cash down payments in the 30% range. These loans are harder to find, but having done 7-8 of them, I’ve NEVER had a borrower miss a payment in the past 4 years. Part of the difference, too, is that I get to the underwriting personally, interview the borrower personally, and make it clear what will happen if they stop paying.
Second Caution:
3. You advocate a very large equity portfolio to achieve SWR success over a long period. I do not doubt your math or statistics, but I do doubt most peoples’ ability to stay the course during a very rough stock market stretch. If you’re in the accumulation phase and still working, it’s not that hard to see big downturns as buying opportunities. But when you already have millions in the market, no outside income, and your see your net worth drop in half, the behavioral impulses can become overwhelming. Therefore, for anyone who has not truly tested their risk-tolerance with a large equity portfolio in the 2008 swoon, I suggest they keep it more conservative and work a few extra years.
Again, thanks for taking a fresh look at the 20+ year old Tinity study.
Jason, thanks for stopping by and your kind comment!
1: Yes, this is for the U.S. only. I use the S&P500 total return index in the simulations and the CAPE for the S&P. My friend FinanciaLibre had a great post on the topic of international CAPE comparisons:
http://www.financialibre.com/where-to-find-superior-stock-returns/
2: Wow, you’re an expert on P2P loans. I am still thinking about getting my feet wet with Prosper/LendingClub. Do you have a blog where you can share more about your experience with the private mortgage loans? Do you want to write a guest post about this and publish here?
3: I know, it takes guts to jack up the equity share. I have to do it myself quite often: slap myself in the face when I become myopic again to overcome the “behavioral forces” as you call them. As I wrote in my guest post for J$ at BudgetsAreSexy.com:
It also helps to look at this chart occasionally:

(From out post on bond vs. equity risk)
Cheers!
ERN
Great article and series! Thanks for the contribution to the FIRE community regarding safe withdrawal rates. It’s a hot topic but very little new is really presented but your analysis really adds to the information out there. I completely agree that high equity allocations are critical for 50+ year timeframes that many of us are planning for in the FIRE community. I also agree that US valuations are high. But as I’ve posted, I’m trying the best of both…..a high equity allocation but a significant shift outside the US, particularly in emerging markets. Many would throw heavy stones at my approach but I think the data supports a heavy equity tilt and using valuations (plus other mean-reverting data like company profits) for 10 year+ investing allocation decisions. Keep up the great work!
Thanks! That’s a good point: EM looks cheap in terms of valuation. So does non-US DM. These might be the places to find the extra few % return in the near-term!
Good lock and Cheers!
Hi Mr & Mrs ERN! Thanks for this series–I got hooked on the Guyton-Klinger post and am starting from the start to catch up.
Regarding CAPE: Doesn’t it drop by about 20% in 2019 when the Great Recession with its mammoth P/E of 71 drop out?
If so, we just wait until 2019 to do our retirement math and we’ll be much better off.
Am I wrong in thinking the CAPE is silly while “once in a lifetime” data distorts it so badly?
=r2u
Thanks!
That’s a good point about the CAPE. It won’t fall by 20%, though. We are rolling out a 12-month window during the crisis that had almost zero earnings and replace it with more normal earnings. I once did a projection forward and found that due to this roll effect we’d observe a drop by about 2 in the CAPE. It’s a drop by 7%. Not quite 20% but still noticeable.
I kinda eyeballed the value from looking at http://www.multpl.com/shiller-pe/table and seeing what the 70.9 TTM P/E for 1/1/2009 did the the numbers (http://www.multpl.com/table).
But getting more detailed, if I replace 70.91 from 1/1/2009 with the current TTM P/E of 26.73, I get the drop:
(70.91 – 26.73)/10 = 4.418
A drop of 4.418 from a CAPE of 29.32 is ~15%.
What am I doing wrong? Does adjusting previous year’s P/Es by CPI cause that much difference?
And again, thanks for the blogs! I’m too old to worry about a 60-year retirement, but still young enough to consider myself retiring “early” and not rich enough (or too much a worry-wort) to be entirely anxiety free!
That’s not how the CAPE is calculated though. You take the real earnings, take a 10-year average and then divide the current real S&P price index by the average earnings.
So, if you were roll out one entire year of zero earnings and replace it with one year of normal earnings you’d increase the CAPE by 10/9-1=11.1%. But earnings never dropped to zero in the crisis (at least not in the U.S. – in Japan they dropped to below zero). So assigning a haircut due to that and the fact that the S&P index will also increase from now on (I hope), I would suspect that the drop in the CAPE is proabbly around 10%. Not too different from your 15% but certainly lower than your initial 20% number. 🙂
Well, that explains it! I’m sure my eyes have seen the formula and I just ignored it. (It’s all here in excel: http://www.econ.yale.edu/~shiller/data/ie_data.xls)
I guess I should be comforted that the CAPE is not so easily distorted, and discomforted about what that means for the future of the S&P…
Thanks for patiently clearing up my misunderstanding!
I’m planning on early retirement at 47. I have access to the State of Washington TAP Annuity at any time after separating from service (details at https://savewithwa.empower-retirement.com/preLoginContentLink.do?accu=DRSWR&contentUrl=preLogin.Tab2.G3&specificBundle=preLogin). It offers automatic 3% COLA adjustments every year, as well as balance refund to my heirs if I die before receiving the full amount of my initial investment. The annuity calculator (https://drs.wealthmsi.com/annuity) shows a 5.486% effective withdrawal rate for a 47-year-old. Sound reasonable?
Wow, you are getting 5.5% payment out of an annuity for a 47-year-old and 3% COLA? That’s extremely generous. I would have thought 5.5% initial payment and no COLA would be about the market rate for an annuity at that age. Make sure that this is really with the COLA. If it is, it sounds like a good deal (probably only offered to government retirees, I guess).
Thanks for the reply. And, thanks for posting this series. Very generous of you and much appreciated.
I’m not sophisticated enough with mathematics to be able to model this appropriately, but maybe you can steer me in the right direction or guide me towards resources that would help: If I did indeed go with the 5.5% annuity, what’s the likelihood that I’m missing out on significant gains I would otherwise have enjoyed?
For example: I annuitize $100,000, yielding $5,500/year in real terms for 36 years (my life expectancy) for a total payout of $198,000. A $98k gain over 36 years; annualized return of 1.916%.
Based on historical data (or the CAPE-predicted future returns you’re describing), how do I calculate the odds that my $100,000 would grow to a significantly different amount? Is there, for example, a way to say there’s an X% chance I would gain $100,000 or more, a Y% chance I would gain $150,000 or more, a Z% chance I would gain $200,000 or more, and so on? Or, inversely, a 95% chance I would gain X or more, a 90% chance I would gain Y or more, an 85% chance I would gain Z or more?
Clearly an annuity is insurance against the worst-case outcome for future returns, but how do I model the difference between the annuity outcome and the lousy-, average-, better-, and best-case outcomes that could potentially happen?
There is a short and a long answer:
Short: If I use the Excel IRR function and I create a cash flow series of -$100K and then +$5500 in year 1, increasing by 3% p.a. for 36 years, you’d get an internal rate of return of almost 8% (nominal). That’s the more relevant return. Don’t use the 1.916%, that’s not proper. 8% is an awesome return for something as safe as an annuity. Yes, you may beat that with equities, but might also run out of money after 15 years.
Long answer: There are so many different ways to answering this. They all go beyond what I can write in a simple response. If you like, I might make a blog post out of it. Maybe in early June?
For now, maybe look at the SWR toolbox and play around with a 5.5% SWR and a 36Yhorizon? It looks like there is a significant chance of running out of money if you try to generate a 5.5% SWR on your own. Especially in today’s environment where equities are expensive and bond yields are so low.
http://earlyretirementnow.com/2017/01/25/the-ultimate-guide-to-safe-withdrawal-rates-part-7-toolbox
Cheers!
Cheers to you! Thanks for correcting my math and pointing me to Excel IRR and the SWR toolbox. And of course, if you want to use my question as fuel for a blog post, go for it! Subscribing now.
Awesome! Stay tuned!
Hi, I would love some additional math help:
In addition to the funds I plan to annuitize at age 47, I’ll have the option of annuitizing a different account sometime between age 55-65 (I choose the year). I’m trying to figure out how to fairly compare my options.
I used the Excel IRR function (thanks!) and at age 55, on a $100k investment initially paying out $5969/year, increasing 3%/year for 28 years (life expectancy), I get an IRR of 6.811%.
If I instead annuitized my account at age 65, would I increase the initial investment to $193,268 ($100k growing at 6.811% for 10 years) and run the numbers on that value, or is a calculation like that bogus?
If I am indeed looking at this the right way, then it appears the IRR on an age-65 investment of $193,268, initially paying out $13,561/year, increasing 3%/year for 20 years, would be 6.240%.
Better to take the age-55 option? Or am I way off on making a fair comparison?
Hi Stevel, this isn’t math help, but from looking at how my parents aged, I believe you might be better off enjoying the $6K/year from 55-65 than $13K/year thereafter.
Or as my older brother observed: “In my 30s, it’d hurt if I injured myself. In my 40s it’d hurt if I overdid it. In my 50s, sometimes it hurt for no apparent reason”.
Haha, that’s a good one. Same feeling here, and I’m only in my early 40s!
I think that’s an appropriate comparison. It looks like taking the payments at age 55 has a better IRR. But obviously, if you can get a high enough return by investing the money yourself for 10 years you can beat that. But is it worth the risk? Iwould take the age-55 option. Cheers!