
Welcome to the newest installment of the Safe Withdrawal Series! Part 25 already, who would have thought that we make it this far?! But there’s just so much to write on this topic! Last time, in Part 24, I ran out of space and had to defer a few more flexibility myths to today’s post. And I promised to look into a few reader suggestions. So let’s do that today pick up where we left off last time…
Updates on the rules suggested by readers
People came up with two interesting suggestions I hadn’t considered before. So I wanted to feature the simulations for those as well:
- What about starting with a cash bucket, i.e., having 2-3 years worth of spending stashed away in a money market account or short-term CDs to access if the market doesn’t cooperate? Sounds a little bit like Fritz’ Bucket Strategy.
- How about we cautiously start at 3.25% and then have the flexibility to walk up our withdrawals if the portfolio grows enough over time? How long would it take to actually grow withdrawals in the cohorts where the 3.25% turned out way too low?
Notice that both rules have one thing in common: the withdrawal rate is below 4%! Let’s not even try to make the 4% Rule work because we can’t. Any new alternative flexibility scheme that may look better than the existing ones in year X has to sacrifice something in another year Y. But obviously, we can get somewhere if we consider the flexibility of simply working another year or two and adding a cash cushion or a lower SWR. Both would imply a net worth target higher than 25x consumption!
Cash Bucket
What I assume here is that the cash bucket doesn’t reduce the stock/bond investment but it’s in addition to the $1m portfolio. Notice that we did a very similar calculation in the post two weeks ago: How much do we have to scale up the entire portfolio to make sure it doesn’t run out after 23 years (1929 cohort) or 28 years (1966 cohort). We needed about $226k of additional savings in 1929 to make the portfolio last the entire 50 years, and $146k in 1966. But for today’s exercise, let’s assume the money is not invested in the same 80/20 portfolio but instead held as cash in a money market account (returning just the 3-month T-Bill interest rate). Also, assume that we only withdraw from that cash cushion if the investment portfolio goes more than 20% underwater. Once the cash cushion is exhausted we tap the investment portfolio and we never replenish the cash account it again. So, think of the cash cushion strictly as an insurance policy against Sequence Risk for the first few years after retirement.
How much extra money do we need to make ends meet? Not that much! Only about $100k to $115k in the two worst-case scenarios! Much less than what I calculated two weeks ago. Makes sense because if the portfolio goes down so will the additional savings if they are invested in an 80/20 stock/bond portfolio. But letting the cash sit on the side we are not exposed to that initial drop, which was particularly brutal in 1929. So, for the record, let me state that this cash bucket strategy seems to work pretty well, despite my previous doubts! It’s relatively inexpensive insurance against Sequence Risk! Think of it as a mini-glidepath during the first few years of retirement! And it “only” takes the flexibility of getting to 27.5x instead of 25x annual spending!

3.25% initial withdrawal rate (=floor) plus upward adjustments
We know that the 3.25% SWR would have been OK for the 1929 cohort. Let’s assume we start with this as the initial withdrawal rate. But also assume that we will walk up the withdrawals in the absence of bad sequence risk. How long will it take to ratchet up the withdrawals if the returns aren’t as bad as in 1929? We answer that question in the chart below. It’s a bit of a mixed bag!
- 1929 would have never moved up the withdrawals. Makes sense!
- 1966 would have been stuck with the 3.25% SWR for a long time and only toward the end would have seen an increase by few percents.
- 1972, which is a true type 2 error: a 4% SWR would have worked but we would have withdrawn a lot less for about 25 years! Then noticing the mistake we’d have almost doubled the withdrawals in the second half of the retirement!
- The 2000 cohort would still be withdrawing the same initial amount! Even though the market recovered, the portfolio ex-withdrawals did not. Ouch!
- The 2007 cohort has only recently started to move up their withdrawals. But we’re still below a 4% SWR even after the long rally! A bit of a disappointment!

(Technical note: I set the GK guardrail that guides the upward adjustment really tight to speed up the ratcheting up of consumption! If the effective WR falls below 0.99×3.25% then move up consumption by 1%! If you keep the standard GK parameters, 0.8×3.25% guardrail and 10% adjustment the process of increasing consumption is even slower!!!)
Let’s now look at the remaining flexibility myths…
Myth #4: If you’re really, really flexible you can even use a 7% withdrawal rate!
Jim Collins in his stock series Part 13 makes the following assertion:
“In fact, the authors of the [Trinity] study suggest you can withdraw up to 7% as long as you remain alert and flexible. That is, if the market takes a huge dive, cut back on your percent and spending until it recovers.”
I didn’t read that in the Trinity Study. Certainly not explicitly, and not even implied. And certainly not over horizons that go beyond 30 years as many of us are facing. In fact, a 7% initial withdrawal rate, even with adjustments to the withdrawals if the market wouldn’t cooperate e.g. through constant % withdrawals, Guyton-Klinger, etc., makes it almost a certainty that the portfolio and thus the withdrawals will never recover to their initial levels! That’s because if we look at the long-term real, inflation-adjusted capital market returns, we get around 6.70% for equities, see my post from last year. For bonds, we get about 2% real returns over the last 100+ years, though, looking at today’s yield, right about 3% nominal, that gets you only about 1% after inflation. Mix equities and bonds together into an 80/20 or 75/25 portfolio and you’ll get an expected real return below 6%. That means you’re eroding the purchasing power of the portfolio and before even running one single simulation, I suspect that this 7% rule will not so easily recover. In other words, a 7% withdrawal rate doesn’t even pass the “smell test!”
But just to be sure, let’s check the cold hard numbers and see how some of the cohorts would have fared under the 7% Rule. I model the “remain alert and flexible” and “cut back on your percent and spending” part of Jim’s assertion as the good old Guyton-Klinger Rule with +/-20% guardrails and 10% spending adjustments once you bust through the guardrails (both up and downside!). It’s not a pretty picture! That $70k annual withdrawal out of a $1m portfolio (=$5,833 per month) would have dropped to about $2,000 to $2,500 per month after a little more than a decade for the 1929, 1966, 1972 and 2000 cohorts. True, the 1972 cohort recovers again to almost the initial withdrawal amount, but that’s 25-30 years into retirement and only very temporary; thanks to the dot-com bust and Global Financial Crisis the withdrawal amount drops again and finishes at 47% underwater. Still better than the 1966 cohorts and 1929 (-66% and -74%), though!
The 2000 cohort is also 54% in the hole after only 18 years. And since 7% real returns are not really all that realistic after a 9-year bull run we can expect further deterioration in the withdrawals going forward. Unless we assume that there are no more recessions over the next 30 years! The 2007 cohort is also 21% underwater, even though the S&P500 index has gained new highs more than 100% above the 2007 highs!

OK, so maybe the 7% Rule looks so bad because I just picked really bad pathological examples. Oh well, I did that because I want to see how “flexibility” works out in some of the financial tail events. But in case you’re interested, I also simulated the 7% Rule for 10 cohorts, each 2 years apart between January 1958 and January 1976. So, we span multiple years over multiple business cycles and not just the worst case scenarios.
The picture looks a little bit better for the 1958, 1974 and 1976 cohorts. They even go beyond their initial withdrawal amount, at least temporarily. Especially the 1976 cohort seems to be OK with the 7% Rule.

But for those who think that this is a validation of the 7% Rule: It’s not! Look at the CAPE Ratios prevailing when those cohorts retired: The Shiller CAPE was around 14 in 1958 and 1974 just above 10 in 1976. Equities were much cheaper, i.e., close to the bottom of their bear market lows. Today’s retirees are facing a CAPE above 30, which is significantly worse than even the other seven cohorts that didn’t exactly fare so well with the 7% Rule. Specifically, the seven other cohorts all have the same pattern: They run into the guardrail and never recover. Most of them have painful drawdowns in withdrawals down to about $1,500 (-74%, ouch!!!) even during the first 25 years. And all end up with vastly lower withdrawals once you get to 30+ years into retirement.

So instead of “…cut back on your percent and spending until it [the portfolio] recovers” Jim might have as well written:
- “…cut back on your percent and spending until you win the lottery“
- “…cut back on your percent and spending until hell freezes over“
- “…cut back on your percent and spending until you die“
- “…cut back on your percent and spending. Period!“
Side note: After finishing this section it occurred to me that one way to “save” the 7% Rule is to not just assume you adjust the withdrawals but we even lower the percentage target from 7% to, say, 4%. That would at least ensure that the portfolio will again recover in the very long-term. But it’s again one of those squeeze-the balloon scenarios. See the drop to $1,500 to $2,500 in withdrawals after 180 months? That would become $850 to $1,400. We are now looking at an 80+% drop in the withdrawals and potentially decades before we dig out of that hole. Dogfood for dinner!
Myth #5: “I don’t have to worry about no type 2 error!”
Type what error? If you read Part 23 of this series, you’ll remember that I pointed out that “flexibility” solves one problem but creates another: Since nobody knew in advance whether the 4% would fail, lots of cohorts in my simulations would have cut spending and/or gone back to work for no good reason. The 4% Rule would have eventually worked out and the portfolio would have lasted the entire duration of the retirement. But nobody knew at the time!
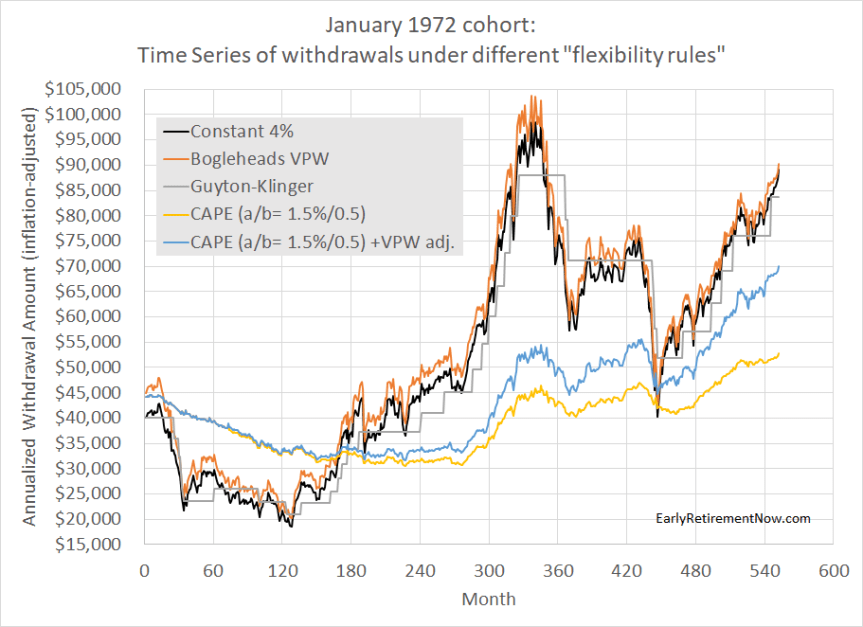
Case in point: The 1972 cohort! It suffered some of the same bad market environment as the 1966 cohort but by starting six years later you avoided some of the initial weak equity and bond returns. But due to the recessions in the 1970s/80s it still had a bad first decade before the great bull market of the 1980s and 1990s kicked in. Only, nobody knew that the big recovery was around the corner until later, so the 1972 cohort would have…
- …unnecessarily gone back to part-time work for about a decade.
- …unnecessarily slashed withdrawals under the Constant % Rule, VPW and Guyton-Klinger Rules, by up to 50%. Recovery only after 15 years!
- …unnecessarily walked down the withdrawals under the CAPE-based rules. Not quite as badly as with VPW, but the walk-down would have also lasted longer. 25+ years! Ouch!

How about the year 2000 cohort? The 2000 cohort is an interesting crowd because it’s not even obvious yet whether they will be a 4% Rule casualty or not. For a 30-year time horizon, we’ll have to wait until 2030 to find out! It is sometimes referred to as a 4% Rule success story, though I seriously doubt that, see Part 6 of this series! Well, just for the moment, let’s take the 4% fans by their word and assume that the 2000 cohort was a success. Well, let’s hope they didn’t follow the flexibility mantra because that would have meant going back to work for a total of around 9 years (50% rule) or 11 years (30% rule).

The other dynamic/flexible rules look equally unattractive. After 18 years, neither the Constant %, Bogleheads VPW nor the Guyton-Klinger Rules would have recovered to their initial withdrawal amounts. That’s despite the fact that the portfolio without the withdrawals would have easily recovered. But as I pointed out last time (Myth #2), the portfolio takes longer to recover if you take money out along the way. I’m almost too embarrassed to make this obvious and trivial point but you’ll be surprised how often people neglect this little detail…

The CAPE-based rules would have done pretty well, though. No noticeable decline in consumption. But then again, due to the nosebleed high CAPE Ratio in 2000, you would have withdrawn only slightly above 2.5% of the portfolio! So, here’s an example where flexibility would have worked. But only if you had accumulated a net worth of 40x consumption instead of 25x!
Myth #6: Social Security to the rescue!
Social Security, to be sure, can be a great addition to the early retirement planning. As I showed in my Case Study Series, many volunteers ended up with safe withdrawal rates North of 4%. Thanks to Social Security and pensions! For “older early retirees” Social Security can make a big difference. If you expect benefits worth $20k per year and have a $1,000,000 initial portfolio then the fail-safe withdrawal rates for 1929 and 1966 would have increased by this much, depending on when benefits start:
- Benefits start after 20 years: +0.45%
- 25 Years: +0.29%
- 30 Years: +0.20%
- 35 Years: +0.14%
- 40 Years: +0.08% (all figures calculated with the Google Sheet developed in Part 7)
It helps tremendously if you’re 50 years old and expect the maximum benefits at age 70, only 20 years into retirement. But for retirees in their early 30s, future Social Security benefits will likely not move the needle much. If the failsafe is somewhere around 3.25% (1929) or 3.50% (1966) without Social Security then Social Security doesn’t even get close to making that a 4%!
Myth #7: Thou shalt not over-accumulate wealth
I’m throwing this one in just to poke a little bit of fun at the flexibility fans. That’s because here I’m actually the one invoking flexibility while they seem to be surprisingly stubborn and inflexible. The criticism that I hear most often is that I’m overly conservative and will just end up with way too much money. My response: I could get rid of that problem pretty quickly, for flexibility is a lot easier when you have too much money:
- Give money to our church and a number of charities.
- Donate money to a university. We don’t have the cash to fund a building or a stadium named after us. But did you know that with a low seven-figure sum you can create an endowed professorship or chair at most universities? How cool would it be if we funded the “ERN Family Chair of Economics” at my alma mater? And if the university manages the money wisely that endowed chair might last longer than some football stadium, too! 🙂
- Help out our daughter with student loans, house down-payment, etc.
- Travel in more comfort: First class instead of coach class! A suite on the Queen Mary 2 instead of an interior stateroom on a Royal Caribbean cruise!
So, the possibilities are endless. And for all those who are still inflexible and uncreative about how to get rid of their extra cash, please reach out to us and I’ll let you know our checking account number! We can get rid of your excess cash problem!
Thanks for stopping by today! Please leave your comments and suggestions below! Also, make sure you check out the other parts of the series, see here for a guide to the different parts so far!
Picture Credit: pixabay.com
Great post ERN. It seems like the lower withdrawal rate is the way to go. I don’t know if you’ve covered this yet, but is it practical to use annuities to smooth out the ride? The “problem” with using a lower safe withdrawal rate is that in most cases you finish with a huge amount of resources. Doing so means you did not get to enjoy a good portion of your wealth. Buying lifetime annuities may help you “finish broke” but the high costs may offset any benefits.
Thanks! I don’t like annuities that much. They insure against longevity risk but inflation is a real concern. Maybe use an annuity if you’re in your late 70s, early 80s and running low on cash…
Interesting read, especially the “Cash bucket” option. But what exactly do you mean with “Also, assume that we only withdraw from that cash cushion if the investment portfolio goes more than 20% underwater.”? At what portfolio levels would that be? Also considering that over time the total portfolio amount will fluctuate as result of the markets and withdrawals?
I didn’t include too many details. Pushing 3,000 words already.
But the rule is pretty simple: Draw a line of how you’d draw down a $1m portfolio over 50 years (same as mortgage annuitization math). If your equity+bond portfolio drops to 0.8x that line, stop withdrawing from the portfolio and use the cash. Pretty simple stuff. 🙂
I’m having a little trouble visualizing whether you’re using nominal or real dollars, and if that matters. Normally a mortgage calculation is in nominal dollars assuming some interest rate (I suppose that’s the assumed equity+bond rate of return here?). Furthermore, once you kick in the cash spending do you exhaust it or go back to equity+bond if portfolio goes back above the 80% line?
Everything I do is in real, inflation-adjusted terms. More details, check this post:
https://earlyretirementnow.com/2018/02/28/inflation-risk-for-early-retirees-part-2/
And the section toward the end: “How I account for inflation in my Safe Withdrawal Rate Series”
We now know you’re a real guy (Macedonian content farm rumors aside) – so your use of real dollars makes sense. In the example in the article you referenced above, that means you’d be digging into the separate cash bucket some time in year 2 due to the drop in real value, correct? And if so, would you continue to draw from and deplete the cash bucket even if the real value of the e+b side went back above $80k?
Haha, thanks!
When you dig into the cash bucket depends on the situation. In 1929 pretty immediately because the portfolio dropped so precipitously. In the 1966 cohort a little bit later because the portfolio slogged along for a while in the beginning. 🙂
Also, for simplicity, I assumed you never replenished the cash bucket. It takes away the asset allocation decision as to when and how and how fast to do that. Also: You’d hamper your growth out of the next recovery. Why shift to cash when equities are rallying again. Opportunity Cost!!!
I really enjoyed these last two posts in the series. I love the way you dispatched all of these myths you hear so often with clear research. Thank you.
Thanks! Glad you enjoyed the posts! 🙂
Great post. Even though it lengthens my timeline your series has convinced me to use 33x instead of 25x and exclude from that calculus 529s and try to pay off the house. Effectively that gives me three levels of redundancy on the effort to get to 33x and the chance to surpass it.
Any chance you plan to restart your case study series? 🙂
Thanks! 33x seems super-safe! That will ensure you don’t outlive your money and likely also leave a nice bequest!
Ahh, the case studies! Too much work, so they are put n ice for a while. But I’ll post something if I revive it again and need volunteers! 🙂
Thank you for another entry in your excellent series. It is interesting to see that the Cash Bucket strategy is similar to the glide-path. I particularly enjoyed your conclusions to Jim Collins 7% example. Eating dog food or winning the lottery. Or waiting for Hell to freeze over. What a crack up!
As for annuities, mentioned by Jason@WinningPersonalFinance — I wonder if those insurance companies would be much more likely to go bankrupt in the exact rare cohort that you’re trying to protect yourself from. If 1929 occurred, could they really pay out?
Thanks!
Yes, insurance companies have some credit risk, too. One would think that good companies with high credit ratings have enough reserves. But, of course, we never know 100% for sure!
Good article – and I’m with you on the working longer option, which I have put into practice! I continue to be fascinated by your earlier post on market timing and risk management and the 200-day moving average and have been reading up on that. There is also this article on Philosophical Economics where he suggests combining that with 12-month moving average in UE, which gets rid of the market noise that can cause a false signal:
http://www.philosophicaleconomics.com/2016/02/uetrend/
If UE is above the 12-month moving average, and the S&P 500 at month-end is below the 200-day moving average, you want to be 100% in cash or bonds for the next month. Otherwise, you want to be 100% in stocks.
You had hinted that more was coming on the moving average (which indeed, I’m sure there is!) I’d be curious to see what that strategy does to the 4% rule over the known problem cycles that you discuss above. Since it reduces drawdowns, I’ve got to believe it helps.
Thanks and keep all the good posts coming!
Thanks for the link! I’m still thinking about how to best condense this into a post for the SWR series. I most definitely think that this could be a valuable option for us in the FIRE community! Stay tuned!
Nice attention to detail as always.
I was curious about the fixed rate equivalent scenario. That is, equivalent fixed rate for a firecalc just under 100% scenario. I took my numbers, 35 years, including rental income, social security and my investible assets, used a 75/25 stock/bond split and increased withdrawal until firecalc moved from 100% to 99%. Then used the same term, social security, assets and rental income selecting a fixed rate of return until the ending balance dropped below income needed. The fixed rate was 3.75%
I’m sure everyone’s fixed percentage would be different, however, I found this rather disappointing and instructive…
Wow, 3.75% seems low, considering you also included your rental and SS income. Shows how we should all customize our own personal number! Thanks for sharing!!!
Two forms of flexibility you seem to neglect are the idea of being flexible regarding asset allocation and loans. One possible method would be do have 20% x (CAPE/10). In a CAPE 30 environment you’d have 60% bonds while in a CAPE 10 you’d only have 20%. You could even glide path that 20% constant and thus if in year x, your percent was 10%, it would be 10% x (CAPE/10).
Another obvious possibility would be to go with something like the Permanent Profile or Golden Butterfly (https://portfoliocharts.com/portfolio/golden-butterfly/ ) to limit the impact of the downturns.
Last and probably my least favorite form of flexibility would be to use debt on the down years. Often (but not always and I don’t have an algorithm for this off the top of my head) when the market goes down, interest follows with it. Since your stocks are assets, you could take a LIBOR-linked loan, based upon existing equity assets, during “bad” years and pay interest only on it. Once you hit a recovery (or the guide railed amount), you pay off the loan.
Thank you for all of your careful, well considered research. It’s been much appreciated.
I generally like (no, LOVE) the idea of the asset allocation depending on asset valuation. I wouldn’t pin this strictly to the CAPE only, though. The S/B allocation has to depend on the CAPE and bond yields as well. But it’s a good idea. Will not fly with the radical passive investors like MMM, Jim Collins, etc. but I like it! 🙂
I’m suspicious about the golden butterfly portfolio. Sure it would have helped in past bear markets but I think the whole value and small-cap premium is now arbitraged away. Hasn’t outperformed the index since the 2004/5.
Cheap credit is one option I’d consider. Not everyone will have the stomach for this, though. But if you can get a low-cost HELOC, why not?! Not yet sure what’s the best way to simulate it but it’s on my to-do list! 🙂
THanks for the great suggestions! Cheers!
Thanks for evaluating the idea of converting a lean FIRE into a fat FIRE. This does not seem so appealing for those of us desperate to escape the clutches of our corporate overseers, particularly with the type 2 errors!
Seems like the market climbs a staircase in most years and falls off a cliff in a minority of years. This has led me to think about protecting my mostly-equity portfolio with a collar options strategy. In a nutshell, you sell some of your upside potential (sell a call) and use the proceeds to buy downside protection (buy a put). By doing so, you could for example set up a portfolio that can only gain up to 10% or lose up to 10% – or 8%/-8%, etc. This would help with SORR because you’d only lose your maximum (e.g. 10%) in disaster years like 1929, 2000, or 2008 that represent failures of the 4% rule. Even better, the collar strategy can neutralize the effects of volatility and time decay while also not sidelining a large percentage of the portfolio.
To model this in a spreadsheet, Assume the collar costs 1% of the portfolio each year (my guess at the bid-ask spread losses for a balanced collar). Of the remainder, write a formula that says “if performance > x%, return is x%, otherwise return is annual return” where x% is the width of the collar, e.g. 10%.
It is unclear to me whether a portfolio would last longer with such a floor & ceiling applied every year, at a small annual price, but I’ll bet my lunch money it would last longer in combination with a CAPE-based rule such as hedge-only-if-CAPE-over-20. This might be the right way to execute a 4% retirement and sleep well at night. After all, we’re insuring against only a couple of very bad years per cohort.
This is a really interesting idea. The protection may become expensive in years where many market participants are seeking protection. Timing for option expiry vs market turn-down-and-rebound may require a quarterly purchase, which would incur more overhead. I wonder if those concerns are significant enough to prevent this from working as insurance against SRR. I’d love to see this explored in more detail.
I would probably execute this using LEAPS. For the ETF SPY, there is currently a market for options expiring in December 2020. Also, I would roll this position one more year out each year assuming the absence of a crisis that for whatever reason made holding my current hedge more appealing. You wouldn’t want your hedge expiring right in the middle of a crisis.
The price of the the calls and puts will ride up and down with volatility, but you don’t care because you’re selling one and buying the other for a net cost near zero.
The pricing of calls and puts will certainly be volatile, but they won’t be symmetric so aiming for a net cost of zero may require substantially limiting your upside to protect against downside catastrophes.
Puts are more expensive than calls for short durations (e.g. 30 days) but the pricing converges for LEAPS (e.g. 939 days).
Example: SPY collar with a $245 put and a $300 call (10% upside limit and 10% downside protection).
34d collar: 0.03 call – 0.31 put = -0.28 net
939d collar: 17.21 call – 16.73 put = +0.48 net
*today’s pricing midway between bid and ask.
Thanks for the examples
Very interesting!!! Thanks for researching this!
Thanks for sharing! I like the idea of very long-dated options (LEAPS). The insurance cost seems pretty reasonable!
Exactly! It’s best to buy protection way in advance when it’s cheap when vol is low.
Similarly, toss all your money into something safe, be it CDs, bonds where ever you can get the best return and then use the money produced to purchase as many S&P at the money (or as far out as you like) call options as you with the income produced. You’ll have a XX% participation rate in Mr. Market with zero downside, `cause the income from the CDs pay for the options when they expire out of the money.
A long call strategy is a good way to establish a “floor” where you can’t lose more than X%, and there is no “ceiling” on how much you can make.
However, you would pay for time decay of the call options (lets say 4%/year of the entire levered value) and miss out on dividends (currently ~2%) with this strategy.
So the long call vs. collar decision comes down to a tradeoff: Would you trade away your upside beyond a certain point for dividends and not having to worry about time decay or do you want 100% upside potential for a price?
I pick the collar because I expect slow growth with a high chance of correction in the next 3y. If you think stocks could keep rising 10% a year for the next 3y, the call would be preferrable.
Chris B,
That’s what is so wonderful about the option market. All kinds of “options”! You can limit loss to N%, limit upside to Y%, participate in the market Z%. It all depends on where you think Mr. Market is going and your risk tolerance.
Ironically, I like real estate best.
Interesting idea. But it won’t work. At the money calls are too expensive.
Wow! Great idea! I generally like the collar strategy, even if it has a bit of a cost associated with it: Puts are more expensive than Calls, all things equal. If you can keep this at an annual cost of 100bps, why not!
I would also like the idea of doing this dynamically. Buy protection when it’s cheap but scale down insurance when vol is high and it’s too expensive to insure.
Good suggestion!
Like seeing the actual numbers.
I’ve taken grief for having retirement savings 35x annual spending, but as you said
it’s easy to be flexible when you have an too much money.
Haha, that’s right! 35x seems really secure! That will make for a very relaxed retirement! Good luck!
Another great article!
It was really interesting to read about the cash bucket scenario. I like that you keep an open mind and present your conclusions without bias even when your results go against your initial hypothesis.
So if I understand correctly, an emergency fund during the accumulation phase isn’t worth the opportunity cost so it’s best to be fully invested, but during the drawdown phase, there’s now a good argument to have 2.5 years of spending in cash to protect against sequence of return risk?
I too was intrigued by the cash bucket idea. I had always considered my oversized cash position “emergency fund” as really insurance against long term job loss during the accumulation phase that might require me otherwise to dip into my assets at an inopportune time (essentially a SORR during the the expected accumulation phase) and then it could be insurance against SORR during the expected draw-down phase as outlined above. I figured the criticism of it for the accumulation phase application is that it might be too “pricey” in that you are sacrificing some potential larger returns. But as you can’t predict how quickly in your planned draw-down phase you might need it, I presume you have to build it up (at least in some fashion) before you start the draw-down phase, versus be a first moment change-of-mix move in the draw-down phase. ERN, does the results of your scenario change anything your view of the larger cash position during the accumulation phase and how would you optimize the timing of building up the cash bucket?
Yes, the difference is that in the accumulation phase you should almost embrace SORR: stocks drop and you use dollar cost averaging. But in retirement SORR will really hurt you.
Thanks!
Correct! An emergency fund during the accumulation phase is probably a waste of money. Opportunity Cost.
A cash bucket with a clearly defined phaseout (or glidepath) during ER might be insurance worth considering.
Great post ERN, thanks 🙂
You really did a great job with this series.
There is just something I don’t understand with the cash bucket. I understand that it helps. But when do you decide to withdraw from your cash bucket or from the portfolio ? Do you always use the cash bucket and sell from your portfolio only when the market is doing well and move the realized money into the cash bucket ?
Thanks
From an an answer to an earlier comment: “But the rule is pretty simple: Draw a line of how you’d draw down a $1m portfolio over 50 years (same as mortgage annuitization math). If your equity+bond portfolio drops to 0.8x that line, stop withdrawing from the portfolio and use the cash. Pretty simple stuff.”
Thanks ERN, it’s clearer now 🙂
Sorry to beat a dead horse here, but I’m still unclear about what constitutes a 20% drop in the portfolio value. Wouldn’t this be dependent upon the percentage of the initial principal you desire to end up with at the end of your retirement horizon? If, for example, I want to preserve 100% (in real dollars) of my initial nest-egg, wouldn’t I have to compound the initial amount by each year’s inflation rate, and then use 80% of this amount as the trigger for whether to deploy the cash cushion?
Can someone please elaborate for us “slower” people in the audience? Thanks.
Another good read, Karsten. Thanks.
We’re doing the “big fat cash bucket” (as of 2017) that gives us about 4-5 years of spending in various forms (money market, CDs, boring bonds). Good to see that’s a decent way to boost the survivability in the early years. But now that we’re 5 years in, our withdrawal rate is under 2% thanks to 50%+ growth in the portfolio!
We’re quickly approaching the Myth #7 you mention – having too much money. I figure we can remedy that in many of the same ways that you suggest. Charitable giving, making our kids wealthy, upgrading to first class and balcony rooms/suites on cruises, etc. We’ve already increased our budget by 25% but that hasn’t translated into consistently higher spending (we’re naturally frugal??).
The cost of launching 3 kids into adulthood is probably the biggest psychological hurdle that prevents us from going hog wild with spending today (combined with the gut feeling that we have highly valued equities today that could translate to below average returns in the near- and intermediate-term).
Thanks Justin! Yes, yours is a good problem to have! It raises the question of when are out of the woods and completely safe to never worry about SORR again? Probably at <2%. But only if you are certain that your spending won't go up substantially. For me, that would mean that I reach Medicare age and I have some certainty that they don't mess around with my benefits (too much).
Thanks for stopping by! 🙂
With 3 kids between age 6 and 13, and being in my 30’s, I’m not at all certain that my expenses won’t go up in the future! 🙂 That’s one reason I’m not trying to hard to “spend optimally” by increasing my withdrawals and spending right now. Maybe I get to a 1.5% or 1% withdrawal rate in another 10-15 years and have an even bigger problem of too much money.
One thing I’ve noticed is that I appreciate more comfort as I get older. I can see future expenditures on travel and convenience increasing, along with outsourcing even more stuff around the house (like cleaning, yardwork, maintenance, groceries, laundry, etc) if I really really need to get rid of a ton of money.
One thing I did was to fund a UGTM at age 2, put it in stocks and let it grow. It basically tripled. I then spent it down during college on a per year basis leaving the remainder invested, covering incidentals like year abroad plane trips home vacation clothes electronics etc. The coup de gras was to close out the account with a purchase of a car, so they got out at a very low per year cost to me (20K invested and then spent over 19 years) relying on compounding to do the heavy lifting. They never were part of my retirement cash flow. I also funded the cash SORR insurance bucket. Seemed more rational than paying a insurance company annuity money. Having a cash bucket effectively re-indexes the cohort to which you belong.
Nice! I like this quote: “Having a cash bucket effectively re-indexes the cohort to which you belong.” Very true!!! Thanks for sharing!
“appreciate more comfort as I get older”
Exactly!!! That’s the main reason I believe some of our expenses will not go down as we age! And some new ones will creep up too (health care), so I will not plan on much of a spending decline! 🙂
Always enjoy your posts, ERN. I too would be interested in more details on your modeling of the “cash bucket” scenario.
Also, is this sentence missing a word?
“But in the way, the 4% fans favor because this only worked if you had accumulated a net worth of 40x consumption, not 25x!”
Thanks! Corrected the mangled sentence. 🙂
The cash bucket is modeled as a simple 0/1 flag on when to withdraw from the S/B portfolio and when to withdraw from the cash bucket: Draw a line of how you’d draw down a $1m portfolio over 50 years (same as mortgage annuitization math). If your equity+bond portfolio drops to 0.8x that line, stop withdrawing from the portfolio and use the cash. You’ll never replenish the cash bucket. If it’s empty you’re forced to use the S/B portfolio. Hope this helps!!! 🙂
Thanks for the clarification. That makes sense. I assume you start/stop the cash draw-down each time you cross the 80% line (until the cash runs out)?
Yes! Correct! Normally you cross below 80% and stay there (at least in the bad scenarios like 1929). But it;s set up exactly as you said! 🙂
Has anyone or can someone please calculate CAPE/10 subtracting the anomalies of 2008/09? Those years are obviously skewing the CAPE multiple here in 2018. This would provide us with a more realistic statistic with which we can base or assumptions. Call it a CAPE/8 if you must.
Here you go:
https://dqydj.com/shiller-pe-cape-ratio-calculator/
Thanks for sharing! I did my own calculations about what will happen if we roll out the bad years with the CAPE-10. We’ll likely settle in the high 20s (roughly 27-28). Still high by historical standards…
Also this is a must read / must try. Average historical returns BY CAPE. Scary shit.
https://www.buyupside.com/shillerdatainfo/stockreturncapebacktest.php
Not sure what they calculate there. That site is likely wrong in the calculation. Example: For an average CAPE (16.86) they have 1/5/10/20-year returns of 0.77%, 2.3%/1.3%0.58%. That is not correct.
Thanks again Big ERN for another great post. Concerning this flexibility issue, have you tried applying a rule based on the momentum technique discussed in your Market Timing and Risk Management article?
It’s on my mind: Apply some of the risk management techniques to mitigate SORR in the SWR study! When I get some free time while on the cruise ship! 🙂
Thank you for this post. The whole series has been informative and has helped me challenge my assumptions and biases.
You rock! Thanks for the compliment!!! 🙂
Nice, I’m a good ways away from retirement. I’ll need to go back and read through the other parts at some point.
Thanks! Enjoy!
Interesting stuff, though of course there’s no guarantee that future returns will look anything like the experience of past cohorts. All you can do is inform yourself (using analyses like those presented in this fine series) – but then it comes down to a personal judgement call, plain and simple.
I find the human psychology aspect of this fascinating – at one extreme you’ve got the gung-ho seven percenters and at the other end those who’ll never be comfortable living off withdrawal, no matter how much their investments grow.
It does make me think of a book I read a long time ago called “The Time Paradox” (Philip Zimbardo). An understanding of your own time perspective (I’m pretty balanced between future and present, it turns out), can really help when it comes to understanding (and being comfortable with) your own personal withdrawal rate. An easy read and it does make you think…
Jo
(currently 46 and running at 2.98 percent withdrawal rate)
Thanks!
The “no guarantee that future will look the same” always applies, of course. As long as we are confident that the next recession will fall into one of the two categories 1) demand shock recession a la 1930s or 2) supply shock recession a la 1970s I’m still pretty confident we can learn something from this exercise. 🙂
Great for you: 2.98% is probably very safe!!! Best of luck! 🙂
I was looking at the 7% data. Consider 7% as a severe stress test. The worst SORR years do very poorly, but neighboring years do better. If you think of the SORR money bucket as a form of cohort re-indexing where you live on separate cash flow for a while, a 1966 portfolio could re-index to become part of the 1968 or 1970 cohort..
The money bucket gives you a lot of flexibility in that if you live on say 100K/yr and have 100K tucked away and 50K SS you could live 2 years (50K + 50K) x2, 3 years (50K + 50K) tightening to (50K + 25K) x 2, or tightening immediately for 4 years (50K + 25K) x 4 years. In the mean time no shares of the portfolio need be sold and in fact you can re-balance from bonds to stocks, boosting up purchase of cheap stocks, front loading recovery. This scheme lets you do the right thing while still providing a few hamburgers along the way. It effectively divorces your living expense from the portfolio’s risk, which dominates in the bear market. You avoid the a low WR and taking forever to recover scenario. You move to 1, 2, 3, or 4 years of 0% WR from the portfolio while living off 1 2 3 or 4 years from the cash + SS.
“I was looking at the 7% data. Consider 7% as a severe stress test. The worst SORR years do very poorly, but neighboring years do better”
It depends on the definition of “better” because my experience is that only the absolute best-case scenario tail events (1932, 1974-76, 1982) do well. Everything else looks horrible, especially after 30 years.
Of course they do horrible 7% as a general rule is nuts.
My “flexibility” strategy is to move to part time work as I approach retirement, earning at least 100% of expenses (but probably more like 150%). This stretches out the accumulation phase without stretching the total number of days actually spent working (or perhaps shrinking them, because you allow more time for compounding).
You get a mini retirement 4 days a week and work the other 3. If you are in a long bull market like now, it makes it more probable you will catch a correction during the accumulation phase rather than the retirement phase. During this time your skills stay relevant so you don’t have to worry about about getting a minimum wage job.
Of course this “flexibility” is essentially a slight variant of “one more year” syndrome.
Nice! For anyone who can do this, I would very, very highly recommend it. Takes away much of the scary SORR over the first few years of retirement! Thanks for sharing!
Given folks are typically looking at 20+ years from their 70’s forward (regardless of if you retire in your 30’s or your 60’s), and given that chances are they haven’t taken significant amounts from tax deferred accounts until near age 60 or still have significant amounts in tax deferred accounts, would the required minimum withdrawals starting around age 70 adversely impact their withdrawal rates? I understand they could reinvest some of the money into taxable accounts for the future, but they would effectively be losing control to some extent over their withdrawal rate, particularly if they have a large amount in there, and that could have an adverse impact on their overall nest egg. Perhaps a reason for a Roth conversion ladder? Just wondering if you looked at that.
I definitely recommend converting as much into a Roth (if possible). Definitely max out the 12% federal tax bracket in retirement to do so!!!
About the RMD, I’m not that scared about them. Either your portfolio has wildly over-accumulated over the years and the RMDs “hurt” you, but that’s in the good state of the world when you don’t have to worry about paying a bit extra in taxes.
Or the portfolio is not doing well in which case your RMDs at age 70 are probably going to stay within the $24,000 standard deduction bucket or certainly within the 10 and 12% brackets.
Cheers!
Hi Karsten,
Long time reader, first time I’ve had something to say in a comment!
Love how everything is starting to come together with perspectives and opinions continually being updated with the research and simulations you are doing.
Would you be able to run a historical simulation to see the highest SWR/PWR versus size of cash bucket (yearly expenses) kept at the start of retirement? Assuming the cash bucket isn’t replenished as you have stated above.
As I understand it, the average cash bucket recommended is 3 years worth of expenses.
I’m specifically wondering how much the SWR/PWR increases by taking the worst-case draw-downs out of the equation.
I do not believe you have run this specific scenario before, and I would find it massively beneficial for people aiming for lean-FIRE like myself… thank you very much!
Kind Regards,
Alistair
That’s probably a more involved project that requires a whole Matlab simulation and a separate blog post! Have to think about how to implement that! But thanks for the suggestion!
Hi Karsten,
Hope you have been well. Love all the new blog posts.. thanks for all your effort! I await eagerly for new notifications of posts from you.
Following up on my last post and to give a little more detail, I am in my late 20’s and looking at the possibility of RE around 35, after having FI.
I love how you broke down the whole concept of the Yield Shield from Millennial Revolution recently, but I understand they also use/have used cash cushion of ~3 years as another buffer.
Have you made any progress with an analysis of optimal cash cushion size like I stated in my opening comment? I’m sure if you had a detailed analysis it would be one of the most well received posts on this blog!
Once again thank you for your time and effort,
Kind Regards,
Alistair
Excellent series. Excellent blog! You are on a whole different level. A fine example of Deutsche Gründlichkeit 🙂 Keep up the good work – but first enjoy your trip around the world!
Thanks/Danke for the compliment! Keeps me going! 🙂
Pretty sure the 7% in the study was nominal, not real. Eliminating explicit inflation adjustments allows a higher rate, and turns this into a constant percentage method.
Trinity published results for both nominal and real. 7% initial withdrawal will be melted away by inflation if you skip the CPI adjustments. Or your withdrawals melt down the way I demonstrated. The effect is the same. 🙂
And 7% constant % method would also eventually reduce real withdrawals substantially. So there is no escaping the fact that 7% initial withdrawal is certifiably bad. Unless you start at the bottom of a bear market.
Wouldn’t all of this be easier if we could figure out when we’ve encountered a Type 2 failure? Is there some minimum % of portfolio beyond which there’s no good chance of recovery?
Another way of thinking about this might be: given a reduced portfolio, is there a number * expenses that is 70% likely to recover given time? It seems like this number might also be useful for risk-takers who don’t quite have 30x or 33x saved but are willing to gamble that the market will carry them.
(Replying to get an email)
Good point. I doubt there is such a level. Or it is so low (probably -50% or so) that you’d have to massively cut consumption by the time you get there.
I am rather intrigued how the cash bucket results in this Part compare with your preliminary side hustle 100% replacement results in Part #23. Herein, the headline is a cash bucket of up to about 3 years on the side would be adequate and in part #23 you talk about needing to work for 6.5 years in the first 14 years of retirement for the 1929 cohort and 9.25 years in first 17 years of retirement for 1966 cohort. I think these apparently significant variances are primarily down to differences in how you have set up the two models. I think if you were to revisit Part #23 and change that model to be to go back to work for about 3 years continuously if the level fell to 80% (rather than working/not working oscillating around the 70%/80% levels) I think this would work out just as well as the cash bucket. Is this correct or have I misunderstood something?
Whether you could ever actually achieve a side hustle that pays 100% replacement may, of course, be questionable.
If you go back to work and replace 100% of your consumption budget you’ll need significantly less time. I was playing with scenarios where you replace only 30-50%, hence the longer duration.
Another issue: The cash bucket was calibrated to exactly make ends meet. The retiree with the side hustle didn’t know how long he/she had to work (not knowing future returns) and probably did the side hustle a little too long…
Thanks for the reply. Assuming you could not stretch to a cash buffer of three years on the side I think another way to look at this would be to always start out with a cash buffer (on the side) of at least one years consumption and if things start to go bad (level falls to 80%) you do two “flexibility” things together, namely: start to look for another job (so called “side hustle”) and cut consumption as much as you can bear. Once you have found a job, try to stick it out for three years (if you want to replenish the cash buffer) or two years (to not replenish the cash buffer) and adjust spending (for those two/three years) according to the replacement ratio e.g. if the job pays 100% of consumption then re-set spending to 100% (as before); if the job pays say 75% of consumption then re-set spending to around 75% of initial consumption. This way I think you have at least 1 year to find a job and only ever have to go back to work for a maximum of 3 years. The key I believe is not to draw at all from your stocks for a period of 3 years. Does that seem logical to you?
Well, you’ll have to find about 2.5-3.0 times annual consumption of “flexibility” in the form of lower consumption, work or cash buffer. How people come up with it is up to individual preferences. A job paying 75% of our retirement budget is out of the question for me. I’d rather start with a lower than 4% initial WR.
I agree – and the reality of the assumptions will always, of course, be very personal and/or situational. Nevertheless a 2.5-3.0 times “result” may be somewhat less daunting than the preliminary side hustle 100% replacement results in Part #23. I guess this should be viewed as reminder about the sensitivity of the, so called, SWR approach. Specifically, relatively small changes to the initial conditions and/or assumptions can lead to a significant change in the model outputs. For example, as you said, starting with a lower WR. On the sensitivity topic, have you ever looked at the impact of variability in annual / monthly consumption. From my own observations (over approximately a ten year period and inflation adjusted) max to min on an annual basis is of the order of 2:1 whereas on a monthly basis it is more like 20:1? Thanks in advance for any thoughts you may wish to share.
True: I find that accumulating “only” another 10-15% over the FI target is much easier than the worry about going back to work!
Variable spending? I did the CAPE-based rule (Part 18). That’s something that did very well in the early 2000s (hence its popularity).
Re variable spending – sorry for being unclear, but what I was trying to understand is if you have explored how sensitive the model is, for the same overall average consumption, but with the W/D’s being driven by, say, real world monthly or annual consumption patterns – as opposed to a flat (or even rules driven) consumption pattern. I think it is pretty clear that real world expenditure patterns (vs “smooth” W/D’s) will impact the terminal value. I guess the question I am asking is, for any cohort, how sensitive is the, so called, SWR, to variability in the spending pattern but with the same overall spending.
My own observations are that real world consumption is very variable – see above – and it is not terribly predictable either. My own conclusion was that one years average consumption “on the side” will usually be sufficient to smooth out this issue and mitigate, at least to some extent, the need to make a large unexpected W/D at precisely the wrong time.
Good point. Our expenses are not flat. Reasons: large lump sum expenses like vacations, home repairs, estimated tax payments, etc.
I still model them in the spreadsheet as as one flat stream because I have no idea when those big expenses occur.