
Welcome, everyone, to another installment of the Safe Withdrawal Rate Series! See here for Part 1, but make sure you also check out Part 26: Ten things the “Makers” of the 4% Rule don’t want you to know for a more high-level, less technical intro to my views on Safe Withdrawal Strategies! Today’s topic is something that has come up frequently in reader inquiries, whether through email or in the blog post comments. Let me paraphrase what people normally write:
“Here’s how I can guarantee my withdrawal strategy won’t fail: I simply hold a portfolio with a high enough yield! Now the regular cash flow covers my expenses. Or at least enough of my expenses that I never have to worry much about Sequence Risk, i.e., liquidating principal at depressed prices.”
I’ve seen several of those in the last few weeks and it’s a nice “excuse” to write a blog post about this very important topic. So, what do you think I normally reply? Want to take a guess? It’s one of the two below:
A: Oh, my God, you got me there. This is indeed the solution to once and for all, totally and completely eliminate Sequence Risk! I will immediately take down my Safe Withdrawal series and live happily ever after.
B: Your suggestion sounds really good in theory but there are serious flaws with this method in practice. It will likely be no solution to Sequence Risk. And in the worst case, your “solution” may even exacerbate Sequence Risk!
Anyone? Of course, it’s option B. It sounds like a great idea in theory but it has very serious flaws once you look at the numbers in detail. Let’s take a look…
Chasing higher yields: A quick guide
If you’re familiar with the Safe Withdrawal Rate Series, you’ll notice that I focus mainly on equity and bond portfolios comprised of U.S. large-cap stocks (e.g., S&P 500 index) and 10-year U.S. Treasuries. (But make sure you also check out my free Safe Withdrawal Simulations Google Sheet where you can also simulate returns of portfolios with short-term bonds, gold as well as Fama-French style biases!) So, what I call a 60/40 portfolio would be closely matched by a portfolio holding 60% in an S&P 500 index fund (e.g., iShares Ticker IVV or State Street’s SPY) and 40% in the corresponding U.S. Treasury bond fund, something like the iShares ETF Ticker IEF. But that’s not the entire ETF universe! Here’s a table with a selection of ETFs in different asset classes: bonds (U.S. Treasuries, Aggregate, Corporate) and equities, together with their Expense Ratio and Dividend/Interest yield.
Side Note: The reason why I put the “Yield” in that table in quotation marks is that this is the 12-month rolling (backward-looking!) yield according to Yahoo Finance, so especially for the bond indices, the actual forward-looking yield is even a little bit higher.

That 60/40 portfolio would have a weighted dividend/interest yield of about 2.1% today. If you were to plan a 4% withdrawal rate, you’d be forced to generate an additional 1.9 percentage points, roughly half of your withdrawals, from withdrawing principal. Scary when facing Sequence Risk, right? So, I can understand the temptation to look for a higher yield. To that end, I also consider two additional portfolios. They are the ones mentioned on the fellow FIRE blog Millenial Revolution (MR), specifically, in their post on how to generate higher yields to guard against sequence risk. They call this method the “Yield Shield.” Here they are:
Portfolio 2 (MR baseline portfolio): 30% VTI (the ETF version of the famous VTSAX U.S. Total Stock Market Index), 30% International Stocks (Vanguard Ticker VEU) and 40% in the U.S. Aggregate Bond index and the aggregate bond index a higher yield because it also includes corporate bonds. This portfolio already has a higher yield (2.55%) than the Big ERN 60/40 portfolio: non-U.S. equities have higher yields and the Aggregate Bond index includes a significant portion of corporate bonds in addition to the relatively low-yielding U.S. government bonds.
Portfolio 3 (“Yield Shield” Portfolio): With Portfolio 2 as a starting point, let’s really juice up the yields:
- Out of the U.S. equity portion, move 10 percentage points into REITs with a pretty impressive yield of more than 5% and an additional 5 percentage points into the Vanguard High-Dividend-Yield ETF (Ticker VYM) with an also pretty impressive 3.2% yield!
- Out of the U.S. aggregate bond portfolio, move 10 percentage points into investment-grade corporate bonds (LQD) and 20 percentage points in Preferred Shares with a Dividend yield North of 6%.
Side note: I took the liberty of replacing their proposed Vanguard BND and VTC funds with the iShares AGG and LQD, respectively. They are very similar funds but have a longer return history. Especially, the VTC only starts in 2017 so it would be impossible to simulate how the yield shield portfolio would have performed during the Great Recession of 2007-2009.
Wow, now we’re getting somewhere! A yield of 3.69% in our portfolio! And again, that’s likely a little bit underestimating the true expected yield. Keep this portfolio and maybe a really tiny “cash cushion” to finance the gap between the 4% withdrawal rate and the 3.69% yield for a few years and we’re done and never have to worry about Sequence Risk, right? Wrong! Let’s look at how the three portfolios would have performed over the last decade or so:
- The simulation period is May 2007 to December 2018. This is the longest time horizon for which I can gather returns for all 9 ETFs used in the 3 portfolios.
- The returns come from PortfolioVisualizer.com and they are the monthly total returns, i.e., including dividends. If you like to check the returns for yourself, see this permalink with my inputs and the returns of all underlying ETFs and the three portfolios.
- I calculated how a $1,000,000 portfolio would have performed using the three different ETF allocation. This is assuming a 4% withdrawal rate, i.e., with the first month $3,333.33 withdrawal and subsequently adjusted for inflation.
See the results below. Uhm, bad news for the dividend chasers. The low-yield portfolio (60% IVV and 40% IEF) would have performed the best and ended the simulation period roughly where we started (in real terms). Portfolio 2 would be down about 25% and the Yield Shield portfolio would be down almost 30% by 2018. Clearly, this Yield Shield Portfolio doesn’t eliminate Sequence Risk. It doesn’t even lessen Sequence Risk. The Yield Shield actually exacerbates Sequence Risk! Look at how far the portfolio fell at the bottom of the 2009 bear market trough!

I could just leave it at that and be done for today. But that’s not a thorough and comprehensive exercise. I like to mainly understand why this yield chasing strategy would have failed so badly!
So, let’s look at the potential problems of this method:
Problem #1: Efficient Markets
At first glance, the higher yield strategy makes perfect sense. If you assume that you can edge out a higher yield, then, all else equal, you should be better off, right? Well, the emphasis is on the phrase all else equal. Unfortunately, that “all else equal” assumption doesn’t work so well in the real world. So, the first objection is that if this was so easy then everyone would do it and the advantage of the higher yield is arbitraged away, see below:

Case in point, Vanguard’s high-dividend yield index fund VYM. How did it perform during the simulation period? Not very differently from the VTI (U.S. Total Stock Market Index) or the IVV (S&P 500 Index). See the cumulative return chart below. Not only did the VYM fail to outperform the broader indexes by the gap in the dividend yield, the total return (= price return plus dividends) even underperformed a little bit. Thus, if you had banked on the higher dividend yield you would have lost all of it – and more – in the price return. Bummer!

Side note: I’m not here to bash the dividend investing crowd. I’ve even grown quite a bit more sympathetic to the dividend growth investing approach. I even used some “play money” to built my own little dividend portfolio replicating the “Dividend Aristocrats” ETF (Ticker NOBL). I did that in my M1 Finance account (affiliate link) where I can buy fractional shares and M1 would automatically reinvest my new contributions and dividends to rebalance to the target weights. But even I have to admit that the higher dividend yield is not all alpha. I’m OK if I lose some of the extra yield through a lower price return. Hopefully not all of it!
Problem #2: Confusing Nominal and Real Returns
When computing how much yield you need to pull this off, keep in mind that many retirees assume that their withdrawals will grow (roughly) in line in with inflation. It’s probably fair to assume that equity dividends grow in line with inflation over the long-term (and often much faster than inflation). But the same is not true for bonds and preferred shares. If you buy a bond with a principal value of $100 and a 4% yield then you may generate enough income to sustain your 4% withdrawal rate in the first year. But in subsequent years, your income will be eroded by inflation! So, for bonds, you’d need to target a yield of not just 4% but 4% plus your CPI projection! The same is true for Preferred Shares. Normally, Preferreds are structured as essentially “perpetual bonds” with a notional value of $25 and a certain fixed yield. There is no growth in your dividend income, neither explicitly nor implicitly, so you’d have to target your withdrawal rate plus CPI. Otherwise, you’d erode your purchasing power!
Problem #3: More yield may imply less diversification
That would be the scenario below: Not only is the price return lower when you chase yields but it’s so much lower, that your total return lags the low-yield portfolio! How is that possible? Well, the reason people want to hold bonds in their retirement portfolio is not exclusively to generate income but also to diversify equity risk. Holding higher-yielding bonds may expose you to more downside risk the next time a recession hits. In other words, for every dollar you generate in extra yield you may lose much more than that dollar in the price return.

So, let’s look at the correlation matrix for the nine ETFs in the three portfolios, see the table below. I sorted the nine ETFs by their correlation with the S&P 500. And guess what, the three bond alternatives to the low-yielding IEF all have higher correlations with the equity indexes. Not only that, moving to higher and higher yields (IEF to AGG to LQD to PFF) you increase the equity correlation in exactly that order!

So, it’s no surprise that some of the ETFs proposed for the 40% bond share had a very underwhelming performance during the simulation period, especially during the 2007-2009 period when Sequence Risk hit your portfolio. Look at the cumulative performance below:
- PFF (Preferred shares) with the highest yield among the four ETFs had the worst performance overall and a 50%+ drawdown in 2009, even worse than the S&P 500 equity index. Bad news from a Sequence Risk perspective!!!
- LQD did perform on par with the IEF if you look at the endpoint only. But don’t be fooled! This is the cumulative return chart without withdrawals. Because the gray line spent so much time below the blue line, LQD would have done worse due to Sequence Risk!

Problem #4: Dividends can be cut!
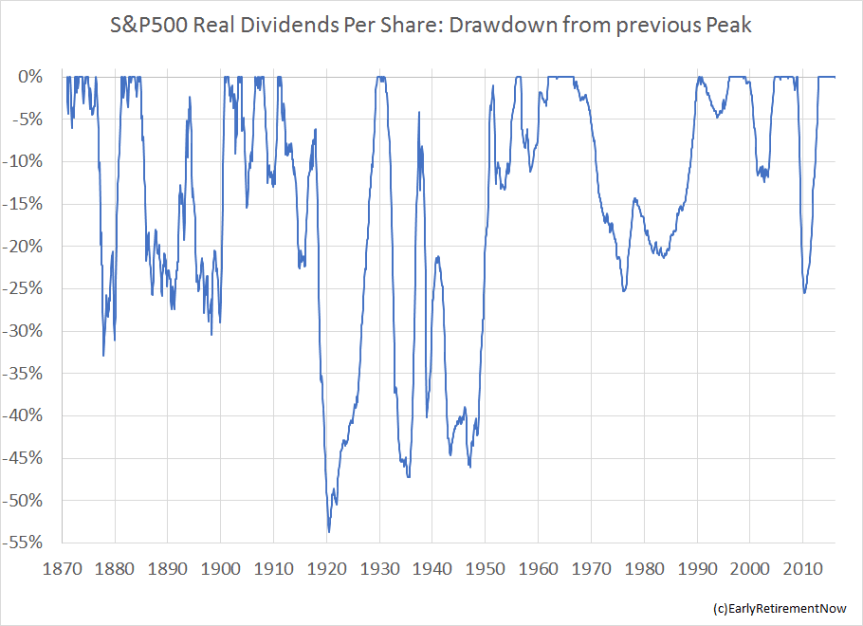
Part of the poor performance of the yield-chasing portfolio is due not only to poor price performance. One ugly little detail that the Yield Shield fans seem to ignore is that even your dividend income will take a hit when the next recession strikes. It certainly did during and after the Great Recession. This is true for the broad market indexes (e.g., the S&P 500) as I have alluded to in a previous post, see the chart with the drawdowns from the peak of real dividends per share:
And it gets even worse; some of the popular dividend boosters – REITs and Preferred Shares – experienced even worse dividend payment streams during and after the Great Recession! Let’s look at the dividend payments per share of the Vanguard REITs ETF (VNQ) and the iShares Preferred ETF (PFF) since 2008 (the peak in per-share income). (Side note: I couldn’t find the USRT dividend stream in Yahoo Finance, so I used the VNQ for this chart!) In the chart below are the per share dividend payments, both in nominal terms and adjusted for inflation. REITs had a sharp drop in dividends (-40%, much worse than the S&P 500!) almost immediately. It took until 2016 to recover to the pre-recession level in inflation-adjusted terms (much longer than the S&P 500).
Preferred Shares kept up their income a little bit better initially but eventually got hit. Really badly! And Preferred Shares look like their dividend income is now down pretty much permanently! More than 40% from their peak in 2008, see below!

Well, the lesson here is that dividends are in no way contractually guaranteed. They can be cut at a moment’s notice. Also, be really careful with preferred shares. They are frequently (mis-)interpreted as a bond alternative, see the Millenial Revolution post. But there’s an important distinction between corporate bonds and preferred stocks! Here is the kind of language you’ll frequently find in a Preferred Stock prospectus (Source: Goldman Sachs Group Inc 6.20% Non-Cumulative Preferred Stock, Series B (GS.PRB) Prospectus, retrieved through PreferredStockChannel.com):
“In the event dividends are not declared on Series B Preferred Stock for payment on any dividend payment date, then those dividends will not be cumulative and will cease to accrue and be payable. If we have not declared a dividend before the dividend payment date for any dividend period, we will have no obligation to pay dividends accrued for that dividend period, whether or not dividends on the Series B Preferred Stock are declared for any future dividend period.”
In other words, the issuer has the option to skip dividend payments. Not only that, there is no obligation to ever make up for that in the future (i.e., the phrase “Non-Cumulative”). This is a stark contrast to a corporate bond where a missed payment would usually be considered a default. So if someone tells you that you can avoid Sequence Risk with Preferred Shares I’d be really, really cautious!
Side note: I don’t want this to sound like I’m bashing Preferred Shares. We hold a small amount in the PFF ETF and a six-figure portfolio of individual Preferred Shares. I also enjoy the impressive yield but I am aware that this is a reward for taking on a risk premium!
Conclusion
Oh, my, I got carried away! I have some more material but we’re already pushing 3,000 words. I’ll do a follow-up soon (see Part 30, published on 3/4/2019). Anyhow, what have I learned over the last few days putting together this post? What can we do about Sequence Risk? Nothing can really solve the problem unless you come up with a market timing algorithm that avoids the occasional equity drawdown altogether. I have studied a few legitimate techniques that alleviate (not solve!) Sequence Risk:
- Guyton-Klinger (see SWR Series Part 9 and Part 10)
- CAPE-based withdrawal rules (see SWR Series Part 18)
- Glidepaths for the equity/bond shares (see SWR Series Part 19 and Part 20)
- A “cash bucket” (see SWR Series Part 25)
But none of these will ever completely shield you from Sequence Risk. And the “Yield Shield” method is even inferior to that. It’s a bit like prescribing Marlboro Reds for enhancing pulmonary health. It ain’t working! In other words, the Yield Shield has the potential to make Sequence Risk even worse, as evidenced in the last recession. Of course, we can’t really tell how this asset allocation will work in the next bear market, but the previous failure of the Yield Shield was probably not just a fluke. As long as you believe that in future recessions dividends will be cut, preferred shares will get into hot water, inflation erodes some of your fixed-income yields, etc. – all pretty reasonable assumptions – then there’s a pretty good chance that this strategy will fail again! I have consistently recommended to my readers to stay away from this strategy. But if you want to be the guinea pig and try this in real-life, best of luck in the next bear market!
Also, make sure you check out the two follow-up posts:
- The Yield Illusion Follow-Up (SWR Series Part 30)
- The Yield Illusion (or Delusion?): Another Follow-Up! (SWR Series Part 31)
Thanks for stopping by today! Please leave your comments and suggestions below! Also, make sure you check out the other parts of the series, see here for a guide to the different parts so far!
Picture Credit: pixabay.com
Who care about sequence risk! I put all my eggs in CenturyLink (CTL). The dividend yield is great at 15%. Who cares that the payout ratio is 120%…I love me some yield! In all seriousness, thanks for putting numbers beind the myth of yield as the answer to everything. I have used a CAPE-based SWR (1.5/0.5) since pulling the plug in 2015 and am happy with it. This SWR Series is a gem!
Haha! I came across CTL when I looked at the dispersion of dividend yields:
https://earlyretirementnow.com/2018/05/30/idea-for-a-new-etf/
What an insane dividend yield! But better stay away from that one with this payout ratio!
Thanks for stopping by! 🙂
CTL just announced dividend cut by 50% ..
https://www.thestreet.com/investing/centurylink-drops-after-slashing-its-dividend-in-half-14866642
Thanks for the link! Yes, this is the danger of the high dividend yield. It is highest right before the dividend cut. 🙂
No Problem Big ERN, Thanks for your effort to help improve the Financial education for the FIRE community.
I would love to see your opinion on Adding Alternative Assets to help reduce the Sequence of Return risk .. for example GOLD has outperform stock and bond during the 1970s.
Simulation show 20% Gold has significant improvement Safe Withrdawal rate for multiple portfolios
Check below
https://portfoliocharts.com/portfolio/golden-butterfly/
You can check that out yourself! There is a way to add Gold to the Google Sheet, see Part 28.
Quite amazingly, it worked as a hedge during the stress periods (1929, 1970s, GFC).
That said, I don’t recommend that golden butterfly portfolio. It might work for traditional retirees with a 20-30y horizon, but not for early retirees. You’d need more equities to sustain the portfolio over 50+ years! 🙂
Thanks BigERN for your kind reply, I agree with you the Golden Butterfly is over weight bond and Gold and will likely to have lower return over the long run. I have used your Spreadsheet to simulate
My current assets allocation is 70% Stock, 15% Gold and 15% Cash which has 3.24% SWR.
Nice!
Historically, longer duration bonds had better success hedging equity risk than cash. Because bonds not only don’t lose during recessions but gain substantially due to the duration effect. It didn’t work in the 1970s due to an inflation shock, so there cash was better. Are you expecting a 1970s repeat?
“Nice! Historically, longer duration bonds had better success hedging equity risk than cash”
That is correct, I am based in Europe, and the issue we are facing here is the negative yield on European Governent Bonds (Thank to ECB, BOE and SNB) .i guess having 0 nominal interest is better than having nominal negative interest. Moving to USD or other currencies add significant Currency risk.
“It didn’t work in the 1970s due to an inflation shock, so there cash was better.”
Good question, I have noticed Gold has outperformed cash and Bond during the 1970s (Hyperinflation) also Gold did excpetionally well in the 2000s (Post DotCom Bubble).
” Are you expecting a 1970s repeat?”
No, However I noticed ALL the low volatility portfolios contains Gold, Cash or Bond and Stock .. I think it is not a coincident
https://portfoliocharts.com/portfolio/portfolio-finder/
Good point! I have played with gold in the simulations and it does look like a good hedge in every single crisis scenario. I never got myself to actually buy gold in my real portfolio. But, hey, maybe to offend the YS clowns I might look into buying gold, the ultimate crisis hedge in the form of a zero-yield asset! 🙂
And a day later on Feb 14…CTL cut its (in)famous dividend in half sending shares down 13%. Perfect evidence to your Point #4 (dividends can be cut). I am of course not invested in CTL.
Ouch! I saw that too! Nice reminder that chasing yields increases the risk of dividend cut traps like that one! 🙂
Great article. There is no magic bullet to eliminate risk. I do have one question that I would like your opinion on.
Has there ever been any study related to the 4% rule and investing the portfolio in individual municipal bonds? I have played with them for years- and my average yield today of my muni portfolio is around 4.25% (aggregate portfolio of about 25 different bonds).
I am obviously carrying the risk that a single issue could default in payment (that hasn’t happened to me yet). I have been cautious to try and by the better rated bonds to mitigate this risk. Obviously the ability of the authority to “tax” the citizens to cover the payments taxing provides some safety here as well for the investor. Additionally, many are “insured” issues.
So, while I know I’m limiting my upside (ie principal growth), my steady cash has been a big plus. For example, on $1m I’m getting over $40,000 TAX FREE a year. I try to only buy issues from my State as well so they usually are state tax free too.
Based upon an investors tax bracket, my tax free yield of 4.25% is equivalent to a 5.5 to 6.0% in real return of a taxable issue.
So, just wondering your knowledge of any study in this area, or your opinion of it as a strategy?
Sincerely,
Ron
Great quesion! I hold Muni bonds, too. You could also look into some of the closed end funds of (Nuveen: NMZ, NVG, NZF for example) with yields North of 5%. But it’s not sufficient as a stand-alone strategy. I do this only to hold the margin cash for my option trading strategy.
Specfically, to withdraw 4% and account for inflation you’d need 4%+2%=6%. Not 4.25%. Your after-tax return has to generate that return target. Not your pre-tax equivalent.
Amazing article, as always.
first reaction: it’s the end of the world as we know it 🙂
Second reaction: wait… it’s ungenerous to blame value stocks (high dividend = value) during their worse period ever: https://www.mackenzieinvestments.com/en/assets/documents/marketingmaterials/ii-value-stocks-are-overdue-for-a-comeback-en.pdf
Anyway, food for thought. Actually, it’s an indigestion for thought!
I’m moving a bit toward High Yield because I think that Value investing is more resilient during a crisis than Growth investing. I think Tesla can lose 95% while coca Cola can’t. Value investing (in my opinion) is closer to bonds than to stocks.
But I’m just a practitioner, not an economist, and my hypothesis are not backed by actual data, while you showed us how VTI and VYM performed during last 12 years… so I guess I’m wrong!
Haha, well, once everyone throws in the towel and believes that value is dead, that’s the time it will do well again. But also note the comment I made above about value/growth not perfectly correlationg with high/low dividend yield…
Thanks, Mr RIP! Well, the comeback for value stocks has been overdue for a while now. I’m skeptical that it will happen soon. I think the value premium a la Fama-French has become too popular/popularized to deliver the kind of excess return we say in the first 80 years.
That said, there isn’t a perfect correlation between value and dividend yield. Value vs. growth is defined through book value. There are lots of value stocks with very low dividend yield and lots of growth stocks with a high yield. So, maybe dividends can still deliver in the future when we’re doing this independently from value. Just a thought. 🙂
“there isn’t a perfect correlation between value and dividend yield. Value vs. growth is defined through book value. There are lots of value stocks with very low dividend yield and lots of growth stocks with a high yield”
Ok, I don’t know anymore what I think I know.
Socrates was right.
Thank you for your answer, which – as always – made me learn something more. In this field I’m learning that “learning” means rejecting something I thought it was true.
Awesome! Thanks for your kind words! You rock!!!
I’d like to see the performance from 2008 to 2019. Did the dividend portfolio caught up to the S&P 500 index? Looking forward to part 2.
Thanks, Joe! I did the cumulative performance chart from 2007 and the VYM performed roughly in line with the SP5. Not a big difference when you start in 2008 instead.
But someone pointed out that the SDY (the State Street dividend ETF, different composition from the VYM) did much better. Definitely something to look into. I will reserach this more for the follow-up. 🙂
Great article, but I do think you are not being entirely fair. The stock crash of 2008/9 caused a considerable drop in equity & bond values. The higher yield stocks (particularly) are not general great growth stocks, so recovery is slow, and even slower if capital is also removed. The Bull run since 2009 has been significant so its hardly surprising that a non high yield and more growth focused approach has faired the best.
That said, the general principles and ideas are interesting give pause to think
Thanks!
But I don’t agree that this is unfair. A recession is followed by a growth period. What else? Are you saying that after the next recession we won’t see another growth period with a bull market?
What an excellent addition to your series, especially the link to Portfolio Visualizer. So I tried BRK.A vs IVV, since Warren Buffett has never paid a dividend. It did beat IVV over the time frame available, which was from 2001.
However, like Mr. RIP, I do wonder if the time frame is ignoring the reversion to the mean and that value shares may have a “comeback”. The reason I wonder this is based on a book by Jeremy Siegel, “The Future for Investors: Why the Tried and True Triumphs Over the Bold and New”. He had his students do a ton of research of holding the original individual stocks of the DOW going back to the 1950s, including those that bankrupted. This beat the DOW index. He makes quite a case for value, but going back in time much longer. Does it no longer hold?
Hi Susan. I think that, even were the high-dividend shares to revert to the mean, the main point is that sequence risk was not avoided; shares would have been liquidated by its owner during the down period -purchased high, sold low; the epitome of sequence of returns risk (especially since dividends may well have been cut. Interesting question that you pose, though, re ultimate mean reversion of these types investments (especially for those who are beyond the early years of their retirement).
Good point, but as they say “past performance does not necessarily predict future results”. The point is to make sure that we are looking at 20 years or more data, as is done for general safe withdrawal analysis.
Yeah, very good point!
But again: the VYM portion of the Yield Shield portfolio is actually the most innocent. It’s the crazy assumption of replacing IEF with PFF that will sink your portfolio! 🙂
Thanks, Susan!
I would say the biggest disadvantage of the Yield Shield is not coming from replacing IVV with VYM. It’s coming from a) international vs. US stocks (responsible for half the loss) and messing aroud with the fixed income side, i.e., replacing a true diversiffier like US Treasury Bonds (negative correlation w/ stocks) with riskier bonds and preferreds (back-door equity exposure).
So, I don’t want to understand my post as bashing dividend stocks. Also, as I have mentioned in a comment above, dividend yield chasing is not 100% the same as value investing.
Great article, I haven’t seen #3 and #4 talked about much in the past but are important considerations to take into account.
One more I’d add to the list of cons is taxes, especially for REITs, non-municipal bonds, and international funds where dividends/interest are for the most part treated as ordinary income rather than at long term capital gains rates. If you’re eligible for the 0% ltcg bracket the additional 10-12% cut each year for ordinary income adds up pretty quickly…
The tax treatment is a major concern, too. This post was getting too long already, so I doidn;t mention this. Very good point! The proponents would argue that they’d hold those in tax-deferred accounts, though.
Glad to hear you’re slowly coming over to the dark side with your experimental dividend portfolio. Obviously I would be curious to hear more about that, but I’m guessing we’re not likely to see a post about it since that’s not really your bailiwick.
Have you looked at data for the aristocrats dividends/share over time? It’d be interesting to see that line overlaid against the S&P and VNQ series. According to Wikipedia (https://en.wikipedia.org/wiki/S%26P_500_Dividend_Aristocrats) 19 out of the 52 companies that held claim to aristocrat status in 2008 lost it between 2009 and 2010. Of course that means that 33 of the companies continued to raise, offsetting the cuts. Has anyone taken the time to dig into the aggregate amount that was cut? Maybe this is coming in part two? 😛
Personally I prefer the late David Fish’s concept of the dividend Champions, Contenders and Challengers (http://www.dripinvesting.org/Tools/Tools.asp) to the aristocrats. I find the prospect of a longer potential growth runway for the contenders and challengers more promising.
I’m embarrassed by how many dividend focused bloggers regularly demonstrate a total misunderstanding of how dividends work. Hopefully this post will help some of them realize that yield is neither a source of alpha nor of risk-free return.
I think this misunderstanding makes REITs (as well as MLPs and BDCs although they’re less popular) particularly dangerous for this crowd, which your final graph illustrates very well. Of course that recession was precipitated by a real estate meltdown, so it wasn’t exactly VNQs finest moment…
Thanks! Glad to hear from the dividend investment master.
I should say again that the substitution IVV -> VYM is probably the least bad thing they did in the Yield Shield. It has pretty much no impact on the final outcome.
A lot of the underperformance came from the international stocks and the crazy risky fixed income portion.
But since we’re talking about dividend stocks, I put together several pies in M1:
1: a small portion (4%) replicating the NOBL ETF. I wonder about that too: what happens right around the time a company will be dropped from the NOBL. It will probably get hammered right before the ETF sells it. Hasn’t hurt the performance of NOBL that much so far, though.
2: A large portion (75%) of 50 dividend payers in the SP5 with some additional quality controls: dividend growth, beta, risk, payout ratio, etc.
3: A small portion (20%) of 100 equal-weighted stocks in the S&P500,
4: A 1% portion with BRK.B. I always wanted to hold BRK.B. Just 1 share so I can go to the shareholder meeting one of these years. 🙂
But I will certainly look into the Champions, Contenders and Challengers, too. Maybe add a new pie. 🙂
Changing both the yield and the asset mix make for a difficult comparison. How much of the difference in performance of the 3 portfolios comes from the change in US equity exposure? Some non-US markets have done poorly since the the great unpleasantness (financial crisis). What if you keep the Big ERN 60/40 asset mix but apply the yield enhancements to it (more REITs,more VYM, more corp bonds, ….) to achieve a higher yield?
That’s an excellent question! I will deal with that when I do a follow-up!
And you’re right, a big portion comes from the international portfolio.
Great post as always! ERN continues to demonstrate that there is no Panacea 😒
Having said that, IF one is lucky enough to afford to live off the yield from a careful selection of 30 “Safe” stocks ( based on Ebitdacoverage, corporate bond rating, etc – MCD comes to mind) selected exclusively from the Dividend Champions/Aristocrats list, i would suggest that an ALL stock portfolio (with a sufficient cash reserve) could do the trick!
Very good point! I was thinking along the same lines: instead of 60/40, why not use a 100% equity portfolio with a lower equity beta and high yield?
It’s hard to “simulate,” though what the 30 stocks would have been that an investor without perfect foresight about what was ahead of us in 2008/9 would have picked. Hopefully not too many Lehman Bro’s, Bear Stearns, etc.! 🙂
I was reading the MR article about Yield Shield yesterday because I’ve been thinking about this. My primary concern was that the dividend income was fixed at X% and didn’t increase with inflation. To the credit of MR, they do say this isn’t a long-term solution. I believe they only plan to implement this for the first 3-5 years of retirement.
Thanks Steve!
The “temporary” part is almost as scary as the rest of the strategy. When do they want to shift back to normal 60/40? If you had done that you’d have had an even worse expereince. The PFF & USRT got hammered but if you had shifted out of them after3-5 years you would have missed the nice recovery after the blowup. So, I’d say the “temporary” is not a solution either…
I don’t see any reason to be using 30-40% bonds to hedge sequence risk. 90% equities, 10% gold or TIPS is sufficient. Don’t reach for yield with bonds — just use dividend equities, and stick to good ones at that. Your yield may not hit 4% yield, but it will be higher than the SP500. Try plugging this into Portfolio Visualizer:
90% SPY + 10% IAU
vs
90% SDY (SP500 Dividend Aristocrats) + 10% IAU (Gold)
1 million starting
w/d rate of 3333/month adj for inflation (about 4%)
rebalance semiannually
2006 (start date for SDY) to present these are your results:
SPY + IAU = end balance of 1,691,051 ; CAGR of 4.10% ; Worst Yr -33.09%; Max Drawdown -45.66%
vs
SDY +IAU = end balance of $1,802,696 ; CAGR of 4.61% ; Worst Yr -20.08% ; Max Drawdown -42.91%
vs
Vanguard 500 Index Investor = end balance of $1,580,606 ; CAGR of 3.56% ; Worst Yr -37.02% ; Max Drawdown -50.97%
If you really want to look at sequence risk, run it 2008 to present.
SPY+IAU = 1,372,775 final balance, 2.9 CAGR.
SDY+IAU = 1,697,774 final balance, 4.89 CAGR.
And again, SDY was better in every other category as well (drawdown, sharpe, sortino, etc).
You can replace IAU with a TIPS ETF (like TIP) and get lower returns but similar outperformance with less of a drawdown than with SPY.
As for diversification, SDY has 111 stocks in the ETF right now and while 23% is in financials, Utilities + Consuer Non-Cyclicals are over 28%.
Bottom line is that using quality dividend equities has outperformed with lower risk.
The assumptions that gold will continue to rise and bond yields will continue to fall as they generally did since 2006 (boosting the value of existing bonds) are a bit harder to swallow than the assumption that this period of time, with its big ups and downs, is representative of stock market risks and opportunities in the future.
Copper outperformed during this period of time too, but chasing commodity prices is probably a worse strategy than chasing yield.
Instead of SDY, why not get 10%+ yields from CEFs (some of which is return OF capital from the sale of investments that often are themselves return of capital).
Good point. CEFs are sometimes offereing very high yields. But they also have really big liquidity problems. They trade with really large discounts below their NAV always around the wrong time when equities are down. You better hope you don’t have to liquidate any principal around that time.
My goal includes 90%+ preservation of capital and CEFs are a poor vehicle for that goal. If you’re not sold on gold (totally legit) replace that 10% with anything else. The point is that good quality dividend paying stocks (SDY) outperformed with much less of a drawdown than the SP500 over the past 12 years. Gold, TIPS, or Bonds are all options for your cushion. I am less a fan of bonds largely b/c I am increasingly concerned that they no longer provide a hedge.
Funny thing is that if you run a factor model on SDY you’ll find that it behaved like a portfolio with the following weights:
82% Equity Market Factor
39% 10y benchmark bonds
-21% short-term bonds
40% Fama French Value tilt
So, it’s a leveraged play with bonds in disguise. And Value stocks. If you believe that bonds no longer provide a hedge (kind of scary if you look at the spread between 3M Tbills and 10y Treasurys) then the outperformance of this ETF may also be limited going forward.
But again, I’m generally sympathetic to dividend investing if there’s a quality screen (as in SDY or NOBL, etc.), so no need to bark at this tree here! 🙂
Very nice find! I hadn’t considered the SDY! It proves what I had said earlier in the comments: the substitution IVV vs. VYM is probably the most innocent assumption. PFF and USRT and VEU were the ones sinking this strategy.
I also generally like the idea of a small portion of gold as a tail hedge.
Unfortuantely, I found that the fail-safe for 90% stocks 10% gold is still lower than for 60% stocks, 40% bonds, according to my Google Sheet. But you’re on the right path. Starting from 60/40 and going to 55/35/10 (stocks/bonds/gold) indeed enhances the SWR. That might be an idea for a future blog post! 🙂
Dear Big Ern, if your next post is about how a gold holding increases SWR, as the Emperor says, your conversion to the dark side will be complete! But for some in the FIRE movement, the heresy that gold is a real investment and their might be legitimate reasons for holding a portion of your portfolio in gold will never be expected, regardless of what the data show!
Already looking forward to SWR Series Part 30!
Thanks, Andrew!
Personally, I don’t think gold is an investment on a stand-alone basis. See here:
https://earlyretirementnow.com/2018/03/28/inflation-risk-for-early-retirees-part-4-hedging/
Especially this chart:
https://earlyretirementnow.com/wp-content/uploads/2018/03/inflationseriespart4-chart01.png
The returns are just too low because it’s a useless thing lying around and not producing income.
That said, it seems to have the ability to hedge really bad economic outcomes. So, maybe hold gold through futures (on margin) so you don’t water down the productive asset holdings and you get purely the “beta” from gold.
Maybe that’s something for a future post. 🙂
Try this in portfolio visualizer to really let it sink in:
1 million starting
3333 w/d each month
adj for inflation
rebal semiannually
60% SPY + 40% BND
v.
100% SDY
v.
70% SDY + 30% BND
2008 to present.
Conclusion? SDY > SPY is obvious. 70% SDY + 30% BND = higher returns with less volatility than 60% SPY + 40% BND.
I don’t know how we could replicate this in the ERN SWR toolbox, as SDY uses simple but specific criteria for selecting its holdings, but the clear advantage of dividend champs may account for part of the value stocks
advantage.
Well, we can’t simulate the SDY back to 1926 and certainly not 1871. So, we don’t know how they would have performed during other bear markets.
Again, I’m generally sympathetic to equity dividend ETFs, but also keep in mind that none of the SDY outperformenace is statistically significant. But as I mentioned in the other comment (about the Factor Model) I like the beta exposures. So, even if there’s no alpha in SDY it seems to be a good vehicle for retirement portfolios.
Maybe I should write more on that in the followup! 🙂
I wonder how much of the difference between Portfolio 1 and Portfolios 2 and 3 is only because international under-performance in the past decade.
Very good point. Working on that as part of the follow-up post.
A little over half of the underperfromence is due to intl stocks. the other half is due to the bad bond portfolio. 🙂
Do you still encourage using international stocks as part of an equity portfolio or no? I actually realized that all the SWR series probably just used the S&P 500. Perhaps basing allocation decisions on a single decade is a little questionable
Also in the accumulation phase, is using munis like MUB / TFI a good idea for those in high tax brackets (32, 35% federal? Also usually about a fifth of the portfolio is from CA so an additional 9-10% CA taxes can be excluded for that fifth) They yield higher than other comparable length bonds on an after tax basis, but I wonder what the relative correlation and risk is
Well, I’m on the fence with international stocks. As I’ve written in this post:
https://earlyretirementnow.com/2017/08/23/how-useful-is-international-diversification/
“International diversification doesn’t work when I need it the most. And it works best when I need it the least. Thanks for nothing, man!”
International stocks wildly underperformed during the recovery that followed the Great Recession. But then again, they wildly outperformed the US index after the 2001 bear market. Sometimes it works, sometimes it doesn’t. A lot also depends on curreny moves because the most basic (and lowest expense ratio) non-US ETFs are not currency-hedged.
In the accumulation phase I wouldn’t hold MUB. I would hold no bonds in a taxable portfolio and very little in the tax-advantaged accounts while accumulating.
I agree that the data shows that international equities don’t seem to add much value if you are interested in diversifying your portfolio and protecting it from sequence risk. Its possible it may help but definitely not a silver bullet. That being said they do appear to be valued better with a much lower cape ratio than US equities and I would be astounded if they don’t mean revert to some degree over the next 10-30 years providing a period of significant outperformance than just holding US equities. The ex-US equity funds are also paying a close to 3% dividend yield currently. Ive been increasing my allocation significantly from just 4% of my net worth to close to 25%. Hopefully this market timing will benefit me 10-30 years in the future:)
That’s very true. Non-US stocks have much lower CAPEs. The concern is that they could be cheaper for a reason: slower growth, political uncertainty in the EU, etc.
But I can also imagine a repeat of the post-2001 era. After the next recession non-US stocks have a better recovery again. I might shift some money abroad when we have our next bear market again! 🙂
I see dividends as a sign of a company in decline. I wish there was an ETF of non-dividend payers we could compare against the declining “aristocrats”. Internal reinvestment would be the solution to sequence risk if there ever was one.
I am also still intrigued by the question of whether options could protect against SORR, or at least justify higher equities allocations. I might have to try various algos like buying protective puts for X% of the investment’s price to prevent a drawdown below Y%.
Compare SDY (SP500 Dividend Aristocrats) to SPY (all of SP500) and you’ll find the Div Aristocrats make up 111 of the ~500 stocks in the SP500 and outperform the overall index. Mathematically, I think that is only possible if the dividend aristocrats are outperforming the non-dividend paying stocks in the index.
Thanks, Chris!
Protective puts are an interesting idea. I would be concerned they are too expensive. Throwing the baby out with the bathwater. But maybe do this tactically, i.e., only when implied vol is really low (e.g. Jan 2018).
Well that’s depressing if you are not an American. I am a Canadian and I would have a hard time not using international equities since my country is only 3-4% of the world market.
Are you suggesting that as a Canadian that one should just buy the US S& P 500 or else they are doomed to poor returns? I should just give up now.
Haha, don’t give up! If your expenses are in CAD you should probably be OK, the CAD has depreciated against the USD, so a lot of the difference in the VEU vs. US Stocks comes from currency moves.
But for non-US investors there is a great rationale to have a pretty good portion of their portfolio invested in US stocks. Not 100%. But likely around 50%!
Playing more with Portfolio Visualizer – there is significant sensitivity in the starting date and in your selection of IVV as the bond fund.
I think you wanted to say there is no free lunch, but it reads like cherry picking data just to discredit the MR approach.
To your drawdown scare for Prefferred Shares – these shares are overwhelmingly issued by financial companies… clearly during GFC the financial companies were the hardest hit. Comparing Drawdowns of Preferred Shares of Financial Companies to common stock of financial companies you realize that common stock was drawed down by 68%, compared to 54% for preferreds.
Finally, I have a question: do you only buy cumulative preferreds?
The time period is not selective. It happens to be the longest horizon where we have data. And it includes the last time Sequence Risk was a problem.
And: pickand *a* time period is always better than doing no simulations at all and just claiming this is going to work.
About the preferreds: I personaly don’t care too much about cumulative vs. non-cumulative. I’m fine with having all non-cumulative Preferreds. But I do screen them to make sure that I have “floating rate” preferreds to hedge against future rate hikes. I don’t want to have a perpetual preferred at a fixed rate when in 10 years we could have double digit interest rates. 🙂
Isn’t there a theoretical argument in favor of yields and dividends *because* of efficient markets? Namely, because they’re less tax efficient, I’d expect the big investors to discount them slightly. But as a small individual investor, most of my funds are in tax-advantaged accounts, so I don’t care about the tax treatment and I can pick up that discount.
That was my thinking for buying REITS in my IRA anyway. So far it hasn’t worked out, but that’s just because the big US tech stocks are crushing everything else so hard in comparison.
I’ve thought about this too. Our lower tax bracket means we should theoretically have an advantage (aside from the observation that so many billionaires/offshore corps avoid taxes). However, the comparable risk-free rate of return for a large institution is the 10 year treasury, while for a middle class person it is their mortgage rate which is on average a couple percent higher. Thus, institutions probably face a wider “spread” than middle class investors between their risk free rate and expected after-tax at-risk returns.
This has implications per Modern Portfolio Theory. E.g. My risk free rate is 4.8% and I expect my alternative investment, an at-risk portfolio, to yield 7% after zero taxes in my Roth IRA. An institution’s risk-free rate – at this exact same time – is the 10 year treasury yield of 2.65%. Their at-risk expected return is the same 7%, minus whatever taxes. Thus, middle class investors might be more tempted to take the risk-free option than an institution, and would require more incentive than an institution to put their money at risk for a smaller (2.2% vs. about 4.35%) reward or “spread”.
Then again, the banking industry is all about leverage – taking out loans on their credit to buy less creditworthy investments and pocketing the difference. So who knows?
Well, if you still hold a mortgage, you’d definitely not want to hold bonds with a yield of 2.7% for US govies, see here:
https://earlyretirementnow.com/2016/11/02/why-would-anyone-have-a-mortgage-and-a-bond-portfolio/
So, we bought a house without a mortgage, exactly for tht reason. I guess people who are still saving for FIRE who have a mortgage have that high “risk-free rate” but they will likely not be the marginal investor. That would be the large institutional investors.
“Big investors” are all in tax-advantaged accounts. They aren’t paying taxes either. Just the biggest 300 pension funds — none of whom pay taxes — hold $18 trillion.
Very good point. Didn’t see your reply when I answered this earlier. 🙂
Thanks! I thought about that too, but the large institutional investors (endowments, pension funds, souveriegn welath funds, hedge funds) don’t care about tax efficeny. As long as they are the marginal investors, I’d think that this is not an issue.
This is extraordinary. I have always been drawn like a moth to flame to the idea of creating a portfolio that simply “outputs” more than the SWR. It always comes back to the same answer that assembling a portfolio that simply has the best backtested, risk adjusted performance works best.
That’s not what I’m proposing. But I’m glad you enjoyed the post. 🙂
I would love to see you analyze the Kitces bond tent as a hedge against sequence or return risk. https://www.kitces.com/blog/managing-portfolio-size-effect-with-bond-tent-in-retirement-red-zone/
On the topic of “preferred shares not really being bonds”, you may have seen the news today about Santander’s AT1, another “it’s equity but everyone pretends it is a bond”
https://www.bloomberg.com/opinion/articles/2019-02-13/santander-s-coco-creates-all-kinds-of-trouble
Oops, turns out it is equity after all.
Ouch! But it’s within the agreement to screw the investor. Just like banks may sit out several dividend payments on their preferreds in the next recession! 🙂
Thanks for the reference!!!
I did the analysis of glidepath in part 19 and 20 of this series.
It turns out that if you work with actual equity/bond returns (rather than Monte Carlo as in Kitces/Pfau), then the Kitces/Pfau proposed bond tent performs the worst of all glidepaths. That bond tent performs even worse than a static asset allocation. Over 30 and 60 years.
See the section “Why do I get different results than Michael Kitces and Wade Pfau?” in SWR part 20 about more details.
Hey, thanks so much! Sorry, I’m new to the site and probably should have done some searching before posting that! Much appreciated, and I look forward to the read.
No problem! It’s a lot to read when you first find it! 🙂
Glad you wrote this and the results line up with my intuition. I think the FIRE blogs in general (not just the one this article is calling out) are a bit happy go lucky on issues where the money saved is close to realistic FI and they tell readers in a happy go lucky way “no need to worry:- you can just rely on [yield shield]” without it really being supported by data. Examples: 1) yield shield 2) 4% rule being advocated for 30 year olds to FIRE 3) no need to worry at all about healthcare due to obamacare 4) acting like tax is 0 for everyone in retirement (even small amounts can matter). Good chance this will all work out for the bloggers who are earning income blogging and often having net additions to their portfolios, but not necessarily a good thing to rely on for their readers Glad someone presents the numbers.
Yes, that’s exactly what I’m thinking. Some bloggers have a “why don’t they eat cake” attitude. Which they can have because they generate enough cash flow from their blog! But some ordinary folks like us may not have the benefit o that. That’s a very good point! Thanks for weighing in!!! 🙂
Great, thorough post! The adage of living off your dividends/interest had some validity a generation ago when dividend yields were rarely below 3% and 10-year treasuries were usually 5% or more. Unfortunately what worked 30 years ago doesn’t work today. As you note, trying to to make it work means taking on a lot of risk and it’s better to trust your safe withdrawal rate and not worry if you sometimes tap into your principal.
Excellent point. Remember, only 20 years ago you could buy 30-year TIPS with a 3+% real (!!!) return. just with that you’d make the 4% rule work over 30 years and have lots of money left over.
Today’s low rates are a real chellenge to retirees!
Hello Karsten,
Another of the methods that you have studied for alleviating sequence of withdrawal risk is the cash bucket as highlighted in “The Ultimate Guide to Safe Withdrawal Rates – Part 25: More Flexibility Myths”. You might want to cite this in the conclusion section of this article, along with Guyton-Klinger, Cape-Based Withdrawal, and Glidepaths. For what it is worth, the cash bucket appeals to me at this time due to its simplicity, but I am still a few years out from retirement and have not finalized my strategy.
It is so helpful how you always recap your articles with links to the most relevant prior study in the series. And I always feel a bit of a rush when I awaken to an email in my Inbox informing me of another new post from you. Keep on publishing, and thanks!
Eric
I had this same thought — I thought the cash bucket strategy was a surprisingly solid mitigation in Part 25. It’s worth referencing in this article as well.
Added the reference as requested. 🙂
Yes, good point! Even though I was a bit of a skeptic! But the cash bucket would have done a pretty OK job at least partially hedging against Sequence Risk! I added that to the post.
Thanks for the compliment, Eric! 🙂
I am currently holding a cash bucket as mitigation against SRR, so was pleased to see you reference this is as a legitimate partial mitigation strategy. Is this something you are considering for a future post, as I would love to have your analysis on the effectiveness of a cash bucket as mitigation?
Well, I have pointed to the limiations the cash bucket in Part 12:
https://earlyretirementnow.com/2017/03/29/the-ultimate-guide-to-safe-withdrawal-rates-part-12-cash-cushion/
But if you do the cash cushion as described in Part 25 you can probably navigate even pretty bad bear markets if you have around 27.5x annual expenses and do a 25x traditional portfolio plus a 2.5x cash bucket:
https://earlyretirementnow.com/2018/05/23/the-ultimate-guide-to-safe-withdrawal-rates-part-25-more-flexibility-myths/
(See Section “Cash Bucket”)
I might revisit the topic of the cash bucket in the future but right now I haven’t planned anything. 🙂
Great post! Would appreciate “part 2” comparing ERN 60/40 vs Aristocrats (SDY) for the past 10? 20 years?
Thanks! Working on it! 🙂
I disagree. Living off dividends does reduce sequence of return risk…if you live of the dividends of VTSAX.
It does. But it’s another way of saying you’ll have a withdrawal rate of 2%. That is my strategy-live off yield from a broadly diversified portfolio that is not skewed to chase yield. However everything written about SWR supports very low withdrawals as safe. One just needs a lot of money to do this and it isn’t applicable to 99% of people.
Very well said! Didn’t see this reply until after I replied. 🙂
Thanks!!!
VTSAX yield is still below 2%. And you run the risk of cutting dividends in a recession. If you’re willing to live on a SWR of less than 2% then you don’t have to worry about Sequence Risk that much. But that’s throwing out the baby with the bathwater! 🙂
Thanks for writing this post Karsten. I think this just goes to show that the market is efficient in that such a simple strategy of going for a high yield portfolio can’t outperform the market.
1. Replacing treasuries with preferred shares is heinous and makes sense that it would not work but the fact that international shares sunk the portfolio as well shocks me. I need your help!
I am Australian and a lot of my fellow aussies are overweight Australian shares. I tried to be “passive” and not bet on any one stock market. Therefore my ETF portfolio is approx 50% US Total market and 50% VEU.
Does this mean I am doing it wrong? Do all the SWR analysis e.g. 3.25% only work for portofolio with US equities only?
2. On the dividend stratgey, my main strategy is total return focused where I put regular contributions towards are my passive ETF portfolio and Big ERN option trading strategy (TM) but I was thinking about an experimental strategy. What I need is for you to be my voice of reason. Tell me it won’t work out.
https://carpedividendum.com/2019/02/14/equity-builder/
I am not the writer of that blog and I don’t agree with all his ideas but I was researching the same product to do something similar.
My plan would be:
1) Regular savings contribitions to ETF passive portfolio
2) Option trading strategy
3) Use ETFs as collateral for the Equity Builder product (which has no margin calls) to buy VHY (Vanguard Australian High Yield) which pay higher dividends than the interest. Use dividends to pay off loan + some small principal repayments.
Risk of 3) is rising interest rates, dividend cuts, change in LVR requirements but essentially that is the same as a mortgage. So am I wrong to be so tempted and think this is almost free?
Maybe you can dissect that blog?
Although the audience might be too narrow as I would just use cheaper IB margin loans if us Aussies had any access to cheap margin.
Thanks, Bob!
Wow, a lot to unpack!
Not all is lost for non-US investors. Keep in mind that the 2010-2018 episode was unique. US recovered very strongly, but the rest of the world lagged behind. The recovery post-2001 was the opposite.
A lot of the underperformance was due to FX moves. If you’re consuming in AUD you’re less impacted by the weak performance.
About the 3 step plan, I’d certainly recommend 1+2. 3 sounds very intriguing. Especially for people starting out the FIRE savings plan it may not be a bad idea to have some leverage. If the interest is low, go for it! 🙂
Bob Jane,
I’m also Australian and I don’t think paying 5.05% interest to NAB’s Equity Builder (https://www.nabmarginlending.com.au/NABEquityBuilder#rates) is a good move. Personally, I would focus more on increasing my savings rate and investing the money in ETFs.
Hi mate,
I think you’re right.
Let me preface my answer with this though. My main strategy is increasing savings rate, invest in passive ETFs (global market cap weighted), and option selling.
I am sort of just bouncing ideas for extra things to do. The interest on NAB equity builder is less than the gross dividends paid by Vanguard’s high yield. There are of course risks which include NAB raising rates and/or dividends being cut (or changes to franking credits) however, I was thinking of this a tertiary part of my portfolio where the existing passive ETFs are used as a “deposit” instead of out laying cash.
I welcome any constructive feedback because I do think this is too good to be true and likely more risky than I envision hence any good arguments to knock some sense into me before I do something stupid would be much appreciated.
Very good point!
I use a different strategy. I use a portfolio consisting of low risk and high risk and diversity using the efficient frontier. The most efficient portfolio is the tangent portfolio, so that’s my low risk portfolio. It contains 3 years of WR. I presently have a 60/40 high risk portfolio and it’s AA places me on the efficient frontier. The problem with SOR is it forces violation of the rule of buy low sell high. Your high risk asset drops in half and then you are forced to sell some to buy hamburgers. You’d do better to not sell and let it recover, but you still need hamburgers.
Enter the low risk portfolio. If return for the year is negative say 2000 2001 2002 2008 or 2018, you remove 1 WR from low risk and remove no money from high risk. You re-balance high risk from the bonds in the high risk account. On the way up you were re-balancing, selling off some stock which had appreciated to buy bonds to balance the AA. Now in the crash you sell off some bonds to buy stocks which are now low. In the meantime your hamburger money is coming from the low risk portfolio.
SOR is really an early retirement phenom. By the time you’re half way done, typically the SOR doesn’t have enough time to make a difference in portfolio failure so in the first half of retirement is when you need the insurance low risk provides. If low risk runs out of money but covers the SOR in the first half, it did it’s job. A tangent portfolio of total stocks/total bonds pays better than bonds alone but it’s mostly bonds so it behaves like a bond. So in times when returns are positive you take hamburger money from the high risk and let the low risk compound. In times when returns are negative you take hamburger money from the low risk, and let high risk recover. Since returns are negative only <20% of the time and especially dangerous in the first half of retirement you don't need a huge low risk portfolio to cover the major danger period of the high risk portfolio. 3-5 WR in the low risk is sufficient for a 30 year retirement. Since it contains stocks it has some tendency to keep up with inflation and the dividends are reinvested. I believe dividends do provide some diversity but they are only useful if they are reinvested. Your hamburger money should come from assets not your diversity. I think "yield shield" is a bunch of mumbo jumbo.
I've back tested this portfolio at a 4.5% WR (to stress it) on the sequence of return for the past 20 and 30 years. It beats 60/40. I used 20 years since the dot com bust was very close to the beginning of the sequence and therefore most dangerous to portfolio longevity and it included 2008 as well. Application is mechanical and no harder to perform that yearly re-balancing. You simply determine if YTD on Dec 31 is + or – to decide from where to pull money, and then proceed with re-balancing both low risk and high risk to their proper AA's using the bonds in each sub portfolio to add or subtract, on Jan 1 after removing the WR. Depending on the SOR low risk WILL likely run out of money eventually but as I said by then you will likely be far into retirement and SOR will not be your headache anymore. By then it will be old age. If by some fluke low risk starts making money in excess of the original 3-5 WR inflation adjusted you can transfer the excess to high risk for a little extra kick. I'm a fan of slowly growing the AA to a bit more risk after age 70 or 75 at 1% per year so at some point you can dollar cost average low risk out of existence.
In the 20 year sequence beginning 1998, the 2000, 2001 and 2002 WR's were all accommodated by low risk and the remainder was enough to compound up to accommodate 2/3 of the 2008 WR before the low risk portfolio was out of money, so the fund did it's job. The end portfolio totals for the same 20 years of WR from a static 60/40 vs a dynamic low risk high risk approach (using 60/40 as the high risk and the 16/84 tangent as the low risk) showed the dynamic strategy beat by 1.2%. So same starting portfolio, same withdrawal, same 60/40 high risk but a dynamic withdrawal using a buy low sell high strategy, yielded free money into the system from improved diversity and a kind of systemically mechanical counter sequential, sequence of risk management strategy. In the case of a downturn relatively speaking, the "low portfolio" is high and is the one to be sold.
I also like a little gold and gold miners since in a downturn gold tends to soar and you have something therefore to sell high and buy more stocks when they are cheap. You can buy some more gold at a later date when stocks are high gold is cheap once again.
The system works, but likely can be better optimized for a higher yield.
Nice! Thanks for sharing. My concern with this strategy is that if you call 60/40 your high-risk portfolio and you keep another several years worth of money in probably something like 40/60 or 35/65, don’t you have a slightly too low expected return to make it through 50+ years?
I used 60/40 to do the analysis and determine the trends, since a lot is known about 60/40. I don’t necessarily recommend it as an optimized solution. I have read probably something like 70/30 or 75/25 might be better but the jury is out. That is why I think dynamically gliding up is a good idea. In a 30 year retirement SOR risk dominates to about year 15 so counter SOR strategy should also dominate. In the second 15 years SOR doesn’t much matter since it takes a long time for a mistake to manifest so you’ll likely be dead so in the beginning start relatively low risk and glide to a higher risk. So say start at 60/40 and glide to 75/25 @1% per year increase. The little low risk tangent portfolio acts as a circuit breaker and is a counter weight to poor SOR. If the SOR is good you can simply put the excess low risk money into the high risk pool, or just live on it till it runs out and give the high risk portfolio a chance to grow without WR fro a while.
What I think is the most likely optimization is to break up the retirement into epochs and targets. So 40-65 = one epoch and RMD to death = another epoch and catastrophic events = another epoch and to fund each epoch in parallel and sequentially. I am retired but pre RMD and pre SS. I am in what I call my Roth conversion epoch where I took some post tax money and some tax loss harvest and turned it into cash to live on while I empty the majority of my TIRA into a Roth, but I will leave some TIRA in bonds to RMD. It will basically be an increasing annuity that grows, but does not quickly force me into the next tax bracket for about 12 years. SS the TIRA RMD and some post tax money will constitute my WR. The Roth money will fund disaster. If I get say cancer and my wife gets Alzheimers there is a spare million growing and already taxed awaiting the need. If you have a spouse you should plan for 2 disasters since no matter what it’s coming. I saved for the Roth conversion starting at about age 50 when I quit funding IRA’s and started aggressively funding post tax and tax loss harvesting along the way so I could afford to Roth convert at a low tax rate, so that’s the pre-Roth conversion epoch. Post tax money and tax loss harvest is almost as good as a Roth if the post tax portfolio is tax efficient.
My point is just viewing your portfolio as a big blob of dough (and single risk/reward pair like 60/40) and not targeting what that blob is needed to fund in the future is not a particularly efficient investing strategy. This is not a different strategy than funding both a retirement portfolio and a college fund and maybe a housing fund, it’s just not often included as part of typical retirement planning narrative. Instead retirement is broken down to 4th grade math “pick a number save 25x pull out 4% get a beer”. What’s the risk of that 4th grade math narrative actually working for 50 years with a reasonable certainty of success? Monte Carlo that sucka with 3 initial years of bad SOR and your hair will turn white! If you sequence it into epochs each with it’s own risk analysis and counter risk strategies you are better able to force a positive Bayesian outcome. The economy can always trump your plan but you have considerable control over SOR.
Interesting strategy. I don’t think it’s too different from the “active glidepath” approach I used in Parts 19-20!
Hi, excellent post, as all the posts in the SWR series!
I think one possible benefit of the Yield Shield portfolio is ignored, which lies in the withdrawals / portfolio balancing. Yield adepts reason that one benefit of the yield shield is ‘to avoid selling equities in a downturn’, which you don’t respect in your simulation. (You’re not saying this explicitly but I’m assuming that you’re keeping the portfolios balanced in their different assets during the simulation.)
Generally, I think yield adepts would always “eat the yield first”, and only sell if they need to top up to cover expenses; this already means that they would eat more into the high-yielding assets than the rest (at least at the beginning of retirement when yields still over major parts of real expenses). In addition, if they need to sell during a downturn, they would sell the “yield-assets” first to protect the “growth assets” – hat’s one of the reasons to have the yield shield in the first place. This means that the portfolio balance would change over time, and especially during a downturn. This could be what alleviates some of the effects of SRR. In fact, it looks a bit similar to your stock/bond glidepath!
I most certainly don’t ignore this. First, with a weighted portfolio yield of 3.79% and an initial SWR of 4%, there is nothing left if you eat the dividend income. You have to sell some principal. You’d sell the assets that are up (or down the least, likely the yield assets) and you’d likely leave the most depressed assets alone or even rebalance into them (i.e., sell bonds and buy more equities if they are down significantly).
So, No, there is no magical rebalancing method that can suddenly safe the Yield Shield from doom in a bear market.
Another excellent post. Many comments that followed it are intriguing also.
About preferreds, you rightly focus on the risk that dividends usually can be cut. A related risk is that the principal is subordinate to notes and bonds, such that the preferred will lose to the debt in a bankruptcy. Both reasons account for the poor performance of preferreds in the Great Recession.
But the biggest reason that the preferred funds got slammed in the Great Recession is that many of our major banks almost failed then. The preferred funds such as PFF and PGX are heavily weighted toward bank-issued preferred stocks. Once it became clear that the banks would survive, and civilization with it, these funds made huge comebacks.
When I (later) bought PFF and PGX, I did so in the belief that Dodd-Frank reforms would prevent failures of our “too big to fail” banks. I still believe that. So I don’t expect those positions will get whacked again as they were circa 2008. I suppose this is another way of saying that, while I expect severe recessions, I don’t expect to lose sleep again worrying that Bank of America and Citigroup might fail.
Very true! And smart move with the preferreds. Exactly my rationale for looking into preferreds.
I hope you’re right about the next recession being more benign on the banking sector. I can still think of scenarios where banks will again get into hot water even if the epicenter of the next recesssion will be very different from the previous one.
Karsten,
I have enjoyed all of your posts, but I found the two most recent among the most interesting to me. I’ve been suspicious of the “live off the yield” crowd for another reason. They ignore the effect of stock buybacks. Unless a company is buying back its stock to counter the effects of equity-based compensation, buybacks should be the equivalent of a dividend, and they keep setting new records. Assuming you are in the early retirement crowd, I think it is fair to say you’ll need to save and withdraw from taxable accounts as well as tax deferred.
If you are accumulating in taxable accounts, buybacks should increase your share value, but tax is deferred until you sell. If you are withdrawing, the capital gains are taxed at (roughly) the same rate as dividends, with the added advantage of basis recovery.
So the yield-chasing investor winds up with a non-diversified portfolio of utilities, REITs, preferred stocks, and a few other companies that cling to an outmoded way of returning income to shareholders. Personally, I like a key ingredient in my portfolio to be ITOT, VTI, or something else that captures the entire market.
I can see the appeal of not having one’s ownership stake in equities diluted any. But if you sell to the extent of share buybacks (less any dilution from equity-based comp) you should be able to achieve that. Perhaps that’s just another way of saying you set a lower withdrawal rate to weather SRR, but it would still be higher that the current yield.
Looking forward to your next post! Much more to talk about here!
Very good points! Especially while accumulating and still working and being taxed at high marginal rates one should certainly avoid dividends. Hence my proposal for a pair of S&P 500 ETFs:
https://earlyretirementnow.com/2018/05/30/idea-for-a-new-etf/
Keep the low-dividend ETF in the taxable account and the high-div gund in the tax-deferred account.
The SWR series has been compelling reading. I find myself going back to many of your historical posts to refresh my memory and remind myself that my assumptions are still reasonable.
At the risk of significantly over-simplifying SWR, my high level take-a-way is that given historically high valuations in the market today (which in turn likely presents a higher sequence risk in the near term – especially if one retires right now), a 3.25% SWR assumption seems reasonable if one keeps their investments simple (ie. 60/40 portfolio). This SWR implies 31 times expenses but it feels like this approach would go a long way to reducing the risk of running out of money over a long retirement – especially if one excludes additional income streams such as social security..
I appreciate the incredible number of variables that can impact SWRs both from an investing perspective and from a drawdown perspective (ie. being tax efficent, etc.). This is likely not a completely fair question but am I missing something by hanging my hat on a 3.25% SWR assumption?
Again, I love the SWR series!
3.25% is a good starting point. But depending on your personal situation, you might as well be far above that. Maybe even above 4% or 5% if you’re expecting large benefits from pensions and/or Social Security in the future. It all depends on your personal situation. Check out the case studies I did to see how much variability you get!
https://earlyretirementnow.com/2018/01/17/ten-lessons-from-ten-safe-withdrawal-rate-case-studies/
Ouch. Well…the good news is that when the price drops like that, the yield goes back up! Problem solved.
Haha, very good point! Now we only need a rich uncle to replenish the portfolio and we can roll again with that higher yield! 🙂
A good reminder though that retiring at nosebleed valuations carries higher risk (as you’ve covered well with your discussion of CAPE). In December 2008 the S&P 500 yield was, I think, about 3.2%. Today it’s under 2% — even though higher-yielding REITs make up more of the index today than in 2008. Yield can be another way to think about valuation. A million dollars in SDY in April 2007 at 65/shr makes for a much less comfortable retirement than a million dollars in SDY in December 2007 at 55/shr — especially given the lower dividends SDY pays in 2009 and 2010. It’s a good lesson that a certain variety of market timing pays off: avoid overpaying for stocks and don’t rely on a high SWR when yield is low / prices are high. Of course, that’s covered really well in earlier parts of this series (thanks!) — yield (and yield on cost) provide another angle on valuation, as well as a way to make strategic purchases and to signal times when one might want to wait before investing new money.
Very true. I guess the trick is to weed out the low-quality, disasters-in-disguise stocks from the high-yielding stocks. Probably they are still in the VYM, but they don’t make it into the SDY. What you’re left with in the SDY are the better quality, low-beta stocks. Not even all with a very high dividend yield by the way. Lots of the SPY constituents have lower yields than the S&P500! But at least it’s steady dividends! 🙂
Miitigating sequence risk is not difficult. Buy cheap companies with durable businesses. Don’t worry about dividends. You can sell if you need it. And save on tax.
ETFs align buying activity without price discovery. When companies join indexes the price jumps.
Buy only the best company in an industry, when the price is reasonable. Know what is reasonable. And ignore labels from financial industry such as small value. You need great businesses of any size at reasonable prices.
In theory that’s simple. In practice not so. What are the companies you recommend we should buy right now? Maybe we can do a horserace and see if that beats the VTI or SPY! 🙂
Have you ever considered adding at article to your series about covered call writing for yield. This is my method for mitigating sequence risk. I’m not and never will be an indexer. I’m a big proponent of stock picking and the 35% of my portfolio that is allocated to equities consists of 35 individual, dividend
-paying stocks with an overall yield of 2.7%. Calls are written on 100% of these names. Since athegy began in 2005, the overall portfolio yield (from both dividends and call-writing) has averaged 8.4%.
Sure, stocks get called away when options are occasionally assigned, but overall this has been a very sound strategy.
I love the quality of the content on your blog and there is no one in the investment universe that wrote such a comprehensive series on withdrawal rates like you have. Thanks for all your articles.
I am planning to retire early in 5 years from now. I have 50% of my portfolio in my employers Fidelity Target Retirement Fund and the other 50% is in my Roth IRA in a single closed end fund – ADX (Adams Diversified Fund). I can withdraw 2% from the 401K when I convert it to an IRA when I retire around 55 and use the IRS SEEP withdrawal to get access to my money without paying a penalty. So with ADX paying 6%, the average rate of withdrawal from my 401K and IRA is 4%.
ADX has been in existence since 1929 and has a guaranteed 6% distribution per year and never cut it or reduced it. It uses no leverage nor Return of Capital like a lot of other closed end funds. The yield on finance sites shows as 1.42% however they have a special distribution at the end of the year and recently it has been over 6% – for e.g. in 2017 they gave 9.8%. It has beaten the S&P 500 over a 1 year, 3 year and 5 year period and the 10 yr and 15 yr return is very close. All this for the past 90 years while paying a minimum 6% distribution. I understand the argument that the share price goes lower by the amount of the dividend the next day. I do not care really since the number of shares I own is not reduced and I plan on never selling this fund to raise capital.
I will appreciate if Dr. ERN or any readers of this blog can please tell me if anything is wrong with this strategy. If you need info on ADX – it is at https://www.adamsfunds.com/funds/diversified-equity/at-a-glance/
Sam
I don’t like target date funds for early retirees. Way too much bond exposure. And equity exposure should INCREASE (!) again in retirement (see parts 19, 20), while in most TDFs the equity exposure stays low or goes even further down.
About the ADX fund, I backtested the fund since the 1990s against SPY and it seems to lag the simple large-cap equity index fund:
https://www.portfoliovisualizer.com/backtest-portfolio?s=y&timePeriod=2&startYear=1985&firstMonth=1&endYear=2019&lastMonth=12&calendarAligned=true&endDate=02%2F19%2F2019&initialAmount=10000&annualOperation=0&annualAdjustment=0&inflationAdjusted=true&annualPercentage=0.0&frequency=4&rebalanceType=4&absoluteDeviation=5.0&relativeDeviation=25.0&showYield=false&reinvestDividends=true&symbol1=ADX&allocation1_1=100&symbol2=SPY&allocation2_2=100
It’s another indicator that dividends/distributions alone don’t mean anything.
Thanks!
Screening on floating rates makes sense. Take a look at SPFF holdings – easy to screen from there.
Thanks! I used these two links to screen for the preferreds I like:
https://www.dividendinvestor.com/preferred-stocks-qualified-distributions/
https://www.preferredstockchannel.com/
(no affiliate relationships)
Over the last 3 years a variable RMD withdrawal strategy has outperformed the 4% rule by a fairly wide margin and done it with 100% dividend income in one case and just selling ETF shares in the other:
https://seekingalpha.com/article/4235197-variable-withdrawal-portfolios-dgi10-tr7-continue-outpace-4-percent-rule
No method is entirely risk free and some take a more “watchful” eye on the investments than others. The above is an example of one that takes a knowledgable investor and the other that pretty much runs on auto-pilot.
Dave
Was this because you withdraw less than under the 4% Rule? Or was this because of the asset allocation doing better? So, did your asset allocation beat the 60/40? Or did your withdrawal Rule beat the 4% Rule? Or both?
If it’s the asset allocation, was this because you’re taking on different betas? Anyone who had higher than 60% equity beta probably did better than 60/40 over the last 3 years. That alone may explain the outperformance of the DGI10. Did your 100% dividend stock portfolio outperform a 100% S&P500 index portfolio?
How would this strategy have done in a real “sequence Risk” scenario, like 2008/9. You should be able to run this through PortfolioVisualizer and do a proper backtest.
So, long story short, I’m skeptical if someone tells me strategy XYZ does better than something completely passive. Especially over a 3-year horizon.
But don’t get me wrong: You should keep this going and keep a live track record of a portfolio with real money and then see how your strategies do over the next 10 years and especially during the next recession and bear market. 🙂
Wouldn’t SOR be significantly reduced if one were invested strictly for income in a portfolio of high quality individual stock that haven’t cut their dividend in decades such as the “kings and aristocrats?” Seems to me that investor would never need to sell shares as long as the income met expenses and so could ignore portfolio value .
Yes, for sure. If we believe that those styles deliver “alpha.” But I’m not so sure that by the time the vast majority of people have heard about those styles that the alpha will persist.
Also, don’t forget that the average yield of the dividend aristocrats is only marginally higher than the S&P:
NOBL: 2.25%
IVV: 2.04%
I wouldn’t want to live off only 2.25%
Use an equal weighted, diversified portfolio of REIT, Div stocks ( ETF ) and Total world index ( ETF ), and once in a great while ( under rare circumstanmces ), migrate into duration assets in order to protect capital against sequence of returns risk and behavioral “loss aversion ( Part 2 link below * ). The REIT and Total World may operate in a somewhat uncorrelated fashion versus domestic dividend paying companies with cash flow and earnings generated fro diverse sources.
Over a 30 year sample, a 2% quarterly / 8% annual withdrawal rate was sustained with the use of this strategy, with asset balance growing greater than the rate of inflation over rolling 15 year periods ( Part 5 * ). Some are skeptical at the notion of shifting into duration assets, but is it worth experiencing sleepless nights while exposed to equity assets during the ferocity of a weak economic / negative market trend ?
* https://tinyurl.com/yygwgyyu
have you ever substituted qqq for all or part of the stock index part of this? it’s hard for me to find a scenario in the past 20 years where the q’s don’t beat a vtsax type investment with a 5 year or more horizon. the return from ’07 to ’18 is almost 3x the sp500 from the chart i just pulled. we have plenty of preferred shares too and accept the risk in return for 7+% yields. nice article and series.
You’re 100% right that the QQQ with a sub-1% dividend yield would have performed much better than the IVV/SPY during 2008/9.
But in 2000-2003 the QQQ would have been a complete catastrophe! 🙂
oh, i was really talking about 5 year periods minimum. who sells after 3 years? i think these are the new winners is all. no general electric or oil drillers or mining.
What I mean by 2000-2003 is that starting in 2000 and living through the 2000-2003 episode your portfolio would have never recovered from the drop and would have vastly underperformed the S&P500 all the way through 2019.
Karsten, on the topic of international equities leading to portfolio underperformance. What do you think of this article by Vanguard?
https://www.vanguard.com/pdf/ISGGEB.pdf
It appears international diversification is better for non-US investors than US?
Well, it’s not so much underperformance. It’s vol reduction. And non-US investors definitley benefit more from diversification. Completely agree, as I outlined in this post:
https://earlyretirementnow.com/2017/08/23/how-useful-is-international-diversification/
“What I’m not saying about diversification:
[…]
This post is written from the perspective of a U.S.-based investor. When the U.S. economy struggles the whole world will feel the effects. In contrast, smaller countries can have recessions and market crashes without much of an impact on the rest of the world. So if you live outside the U.S., you’d greatly benefit from investing outside your own country!”
ERN, glad to see that you added “a “cash bucket”” as a possible mitigation/alleviation.
Do you feel it might be better to describe this as “consumption flexibility” as we previously discussed in the comments to your Part 25. Specifically, I am thinking of “consumption flexibility” as a suitable combination of: reduced spending; paid work; and/or cash on the side.
Flexibility! I’m all for it. I will use it if I have to. But it’s not really “solution” to the Sequence Risk problem. It merely shifts the failure of the 4% Rule, running out when you still have x% lifetime left to reducing your average consumption during retirement by x% (or whatever that number may be). It’s really a reshuffling or redifinition of failure.
ERN, I’m daring you and your audience to find a year X to 2019 where a Yield Chasing portfolio underperforms substantially (more than 5%) a 60/40 portfolio. Most of the time it outperforms.
Feel free to write an article on why your current post is wrong. But you will have to give me credit for it.
American
https://www.portfoliovisualizer.com/backtest-asset-class-allocation?s=y&mode=2&startYear=1999&endYear=2019&initialAmount=1000000&annualOperation=2&annualAdjustment=40000&inflationAdjusted=true&annualPercentage=0.0&frequency=4&rebalanceType=1&absoluteDeviation=5.0&relativeDeviation=25.0&portfolio1=Custom&portfolio2=Custom&portfolio3=Custom&TotalStockMarket1=60&TotalStockMarket2=45&TotalBond1=40&TotalBond2=20&LongCorpBond2=20&REIT2=15
Non American:
https://www.portfoliovisualizer.com/backtest-asset-class-allocation?s=y&mode=2&startYear=1999&endYear=2019&initialAmount=1000000&annualOperation=2&annualAdjustment=40000&inflationAdjusted=true&annualPercentage=0.0&frequency=4&rebalanceType=1&absoluteDeviation=5.0&relativeDeviation=25.0&portfolio1=Custom&portfolio2=Custom&portfolio3=Custom&TotalStockMarket1=30&TotalStockMarket2=15&IntlStockMarket1=30&IntlStockMarket2=30&TotalBond1=40&TotalBond2=20&LongCorpBond2=20&REIT2=15
I don’t have to. You are shifting the goal post. Show me an example where, as advertised, the Yield Shield “protects you from a recession,” i.e., the yield shield materially increases your SWR. The abject failure of the Yield Shield is due to two parts:
Fixed income: Replacing 10Y Treasury bonds with anything higher-yielding (corporate, high-yield, preferreds) will for sure lower your fail-safe SWR, i.e., the sustainable SWR at the pre-recession market peak. This method will fail every single time. EVERY. SINGLE. TIME. It’s because more yield in bonds due to more credit risk will backfire during a recession when credit spreads skyrocket.
Equities: Replacing US broad index with either international stocks or REITs occasionally works (1982, 2000), and occasionally backfires disastrously (1990, 2008). I don’t have to show that it fails every single time. You have to show me that it works better every single time to make the YS work as advertised.
So, if I want to refute the claim “Yield Shield will protect you from every recession” then it’s enough for me to show that it fails occasionally. And again, the fixed income portion is destined to fail in every recession. It is not my duty to show that every feature of the Yield Shield fails in every single recession. Are we in agreement on this? If not, I suggest you keep listening to those other bloggers who are experts at “messing sh*t up”
I’ll take your LACK OF AN ANSWER TO THE DARE as a SURRENDER then. Let it be known to all your audience that YOU ARE WRONG and you provide NO EVIDENCE to refute this claim.
I answered your question. Since you’re immune to logic I don’t think we need to discuss this any further.
You can babble all you want but a dare is a dare and you did not over come it.
The established knowledge is that yields are the bulk of market gains and you have come short arguing against it.
You don’t even know elementary finance. According to you, BRK-B would have never created any returns.
Let it be known to your audience that an American “Yield Chasing” portfolio (from year X to 2019) outperforms an American 60/40 portfolio BY MORE THAN 5% from years 1972, 1973, 1974, 1975, 1976, 1977, 1978, 1979, 1980, 1981, 1982, 1983, 1984, 1985, 1986, 1987, 1988, 1989, 1990, 1991, 1992, 1993, 1994, 1995, 1996, 1997, 1998, 1999, 2000, 2001, 2001, 2003, 2004, 2005, 2006, 2008, 2009, and 2010. AND YOU CANNOT COME UP WITH A SINGLE YEAR where it underperforms, by more than 5%, a 60/40 portfolio.
Your whole argument is WRONG and it is PREPOSTEROUS that you try defend it.
https://www.portfoliovisualizer.com/backtest-asset-class-allocation?s=y&mode=2&startYear=1972&endYear=2019&initialAmount=1000000&annualOperation=2&annualAdjustment=40000&inflationAdjusted=true&annualPercentage=0.0&frequency=4&rebalanceType=1&absoluteDeviation=5.0&relativeDeviation=25.0&portfolio1=Custom&portfolio2=Custom&portfolio3=Custom&TotalStockMarket1=60&TotalStockMarket2=45&TotalBond1=40&TotalBond2=20&LongCorpBond2=20&REIT2=15
I don’t have to do that. I showed that the YS failed in 2008. I don’t have to show that it fails in every year. Most of the years you list are not even the market peaks.
I can also show you that the fixed income portion of the YS portfolio (outside of preferreds, where we don’t have return data before 2007) underperforms during market downturns.
I certainly know that international stocks sometimes overperform. I wrote a post on that in 2017:
https://earlyretirementnow.com/2017/08/23/how-useful-is-international-diversification/
I never said that the U.S. market always outperforms the non-US market.
Giblets -Given that the title of this article is “The Yield Illusion: How Can a High-Dividend Portfolio Exacerbate Sequence Risk? (SWR Series Part 29)”, how does your yield-chasing portfolio’s year-by-year performance disprove this? Where in your argument do you analyze and compare its SWR to that of 60/40? And why are you so thin skinned that you resort to insults?
You like dares (Most of us left that behind a long time ago). How dare you interrupt the reasoned discussions within this blog with insults and arrogance.
Thanks for those very well-reasoned words. You’re right! The discussion here was very civilized and reasoned until some strange characters started showing up!