
It’s time for a new post in the Safe Withdrawal Rate Series. It’s been a while, I know! This is a post I’ve been mulling over for a long time and a recent suggestion from a reader made me revisit my notes again. Why not calculate sustainable withdrawal based on how accountants or actuaries work. No simulations necessary! Neither historical nor Monte Carlo simulations! And here’s the kicker: you run this SWR calculation with all the data you’re going to assemble to use my Google SWR Sheet already. No extra work necessary! So, what do we have to do? Very simple:
- Take stock of all of your asset and liabilities today
- Take stock of all of your future expected cash flows: both positive (Social Security, Pensions, etc.) and negative (health expenses, kids’ college expenses, etc.).
This is essentially the information that you’d already need to know when doing a Safe Withdrawal Rate analysis, specifically, the inputs for the Safe Withdrawal Google Sheet, see Part 28 of this series!
So, how do you calculate a safe withdrawal rate without simulating anything? Very simple, use Net Present Value (NPV) calculations to transform all future cash flows (Social Security, Pensions, annuities, etc.) into today’s values, so you will end up with an adjusted net worth that takes into account not just your current assets and liabilities but also all of the future flows. And again, those future flows can be positive (Social Security, pensions) or negative (setting aside money for health expenses, nursing homes, etc.)
Once we have this “adjusted net worth” we can simply do a “reverse NPV calculation” to determine what retirement budget will exactly match our net worth. And that’s a sustainable retirement budget the way an actuary or an accountant would likely compute it.
Before everybody gets too excited, though, let me state the obvious: I would not recommend relying exclusively on this one approach and you’ll need to rely on simulations after all – more on the disadvantages below. But I certainly like the simplicity and some of the information we can gather from this approach!
Let’s take a look…
A case study
It’s best to convey the mechanics of this approach by going through a simple numerical example. So, let’s look at the following case study. This is a completely fictional early retirement couple:
- A married couple, the husband is 58, the wife is 55 years old.
- They have a current retirement portfolio value of $1,500,000. Purely financial assets, not including their home equity.
- Their horizon is 40 years.
- Social Security: He will claim benefits at age 70 (month 145): $2,500/month (in today’s dollars) and she claims at age 62 (month 85): $700/month in today’s dollars.
- Assume that the husband passes away in month 360 after which the wife receives spousal benefits starting in month 361.
- The couple still has a mortgage with monthly payments of $1,800 for the first 8 years (96 months) of their retirement. And needless to say, this is in current dollars and will not be adjusted for inflation.
- The husband will receive a corporate pension starting at age 65 (month 85): $300/month, not CPI-adjusted.
- The wife receives a corporate pension starting at age 65 (month 121): $500/month, also not CPI-adjusted.
- To account for higher health expenses in old age, the couple likes to set aside an extra $2,000 per month (in today’s dollars) starting in year 20.
- 35 years into retirement, the surviving wife will sell the home, valued at $300k in today’s dollars, and moves into a nursing home. They set aside an additional $8,000 per month (in today’s dollars) for the nursing home.
- The wife has a deferred annuity to pay $400/month, starting in month 109. This is not adjusted for inflation!
- The husband has an immediate annuity, paying $300/month
- They like to leave a modest bequest ($300k in today’s dollars) to their kids.
So, let’s enter some of that information into the Google Sheet I prepared:
—> EarlyRetirementNow Actuarial SWR Toolbox <—-
As always: you cannot edit this version. It’s the clean version posted on the web and I can’t give anyone access to mess with the formulas.

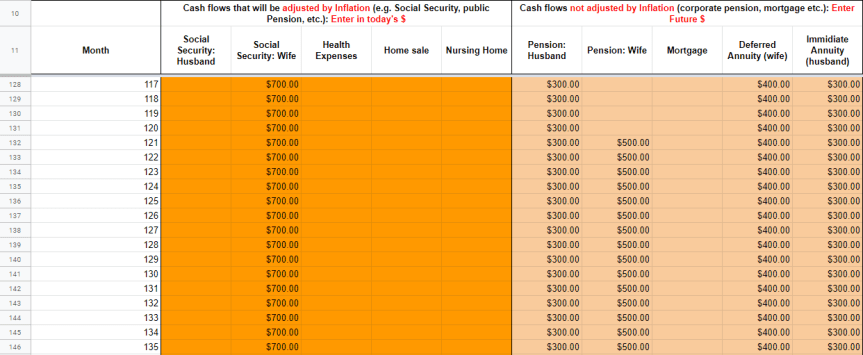
So, how do we enter all the future cash flows into the sheet? Very simple: this is the same setup as in the big SWR Google Sheet, see my SWR Series Part 28. Go to the tab “Cash Flow Assist” and enter all the relevant data. Notice that just in my other Google Sheet, there’s a distinction between “real, inflation-adjusted” cash flows and “nominal, not-CPI–adjusted” cash flows. I reserved space for 5 cash flow columns each. You don’t have to use all of them or you can add more of them by adding columns if you run out of space. Though, please make sure that you erase all the existing data in those columns if you’re using this sheet for your own calculations! 🙂
Real Cash Flows:
- Social Security Husband: Enter $2,500 between months 145 (filing) and 360 (assumed death).
- Social Security Wife: Enter $700 between months 85 and 360 and $2,500 afterward when the wife gets survivor benefits.
- Health Expenses: Starting in month 241, enter -$2,000, i.e., a negative number to account for the drag from additional health expenses later in retirement.
- Home Sale: A cash flow of +$300,000 in month 360
- Nursing Home: a negative cash flow of $2,000 every month starting on month 361.
Nominal Cash Flows:
- Pension Husband: Between month 85 and 360: Enter $300 for the husband’s pension. Notice that we assume that the wife will receive no more benefits
- Pension Wife: Starting in month 121, enter $500
- Mortgage: For the first 96 months, enter -$1,800
- Deferred Annuity for the wife: Starting in month TBA, enter
- Immediate annuity for the husband: Enter $300 between months 1 and 360.
Next, we head to the main tab and enter the main parameters. Only five of them:
- The expected inflation rate: 2.00%
- The (nominal) discount rate used in the NPV calculations: 4.00%. This is arguably the most important parameter, so bear with me on this one. We will check how different discount rates will impact your retirement budget.
- The horizon: 480 months
- The (financial) portfolio today: $1,500,000
- The bequest motive, i.e., how much money should be left over at the end of month 480. This is the money to be used as a cash reserve in case the last-surviving spouse lives beyond age 95 and/or money to leave to the kids.

And that’s all we need! The Google Sheet will compute the rest for you! No finance, no simulations, no asset allocation, no other fancy finance lingo!
So, let’s look at the results, see the screenshot below
- The top of this table is our household balance sheet with a column for assets and liabilities (ignore the column on the right for now).
- The Sheet automatically assigns the net present values from the 10 columns in the other tab into assets and liabilities. For example, the discounted value of the husband’s Social Security is about $361k (=asset). Or the discounted value of the future nursing home expenses represents a $232k liability.
- The row “equity” is calculated to “balance” the balance sheet, i.e., to make the sum of assets equal to the sum of liabilities. Hence, the “equity” portion is simply the sum of all the assets minus the sum of the non-equity liabilities. (and, yes, the equity is listed in the liabilities column. It’s not a mistake, it’s intentional. The way accountants always do this! And it makes sense in this context because the equity will be used to for outflows from the portfolio, i.e., your retirement budget, so it should be a liability!)
- If we subtract from our equity the discounted value of the bequest, just under $138k, we arrive at a pot of $1,750,891 that can be used for our retirement budget. (side note: one could also declare the bequest target as a liability on the balance sheet. Then the “equity” portion is what’s left for consumption. But I always consider the bequest a less explicit liability, more of a voluntary thing)
- How do we transform this fixed pot of money, into a retirement budget? Very simple, we calculate the present value of $1 of real consumption (i.e., $1 in the first month, then adjusted for 2% p.a. inflation going forward for another 479 months), which is $334.03 in this example. So, we simply have to divide $1,750,891 by 334.03 to get our monthly retirement budget of $5,242, or $62,900 per year.
- Quite intriguingly, the annual budget as a percentage of today’s portfolio is not too far away from the 4% Rule!

Technical note, for the spreadsheet wonks: All of the calculations boil down to using the Excel SUMPRODUCT formula, see the rows 5-8 in the “Cash Flow Assist” tab. For example, for the “real inflation-adjusted” series we calculate a SUMPRODUCT over 4 column vectors: 1) the series of cash flows, 2) the CPI index, 3) the discount factor and 4) an indicator variable that’s 1 if we’re within the retirement horizon and 0 beyond the retirement horizon. And for the nominal (current dollar) series we use only 3 column vectors, i.e., we skip the CPI-multiplier. It’s really that trivial!!!
Also, for every position in our balance sheet, we can calculate the impact it would have on the annual consumption target. That’s the column on the right (“Annual Cons.”), which is, in effect, the attribution of annual consumption coming from the different sources of wealth. For example:
- $53,887 comes from the financial portfolio,
- $12,979 from the husband’s Social Security,
- There’s an $8,335 drag due to the nursing home budget, etc.
- Even though the house is worth $300k today, you can factor in only about half of that in today’s net worth (about $152k). The rest is the opportunity cost of having the money tied up between now and finally selling it in retirement!
- All of these calculations are really simple: just divide the level entry in the balance sheet by the $334.03 factor to get the monthly attribution. Multiply by 12 to get the annual contribution.
Just a few words of caution: There are a few ways one could mess up this calculation. For example…
- Avoid double-counting! Notice that I included the mortgage as a negative cash flow on the balance sheet. Make sure you don’t subtract the mortgage a second time your current portfolio value!
- We will not count the primary residence in today’s $1,500,000 portfolio value. That’s because the home does not pay us any investment returns and it would be double-counting because we also count the (discounted) sale of the house as an asset.
I really like this approach because it’s so simple and intuitive. Especially the attribution is really informative. Lots of people always ask me questions like:
- What’s the value of my pension? Answer: see the NPV calculations!
- Should I count my primary residence in today’s Net Worth: Answer: No, because it’s not generating financial market returns. But completely ignoring would be too conservative. You can and should factor in a future home sale. In this particular example, about half of today’s home value can be factored into the balance sheet!
- I have a nominal (not CPI-adjusted) corporate pension. How much money should I set aside to “make this a real, CPI-adjusted pension”. Answer: look at the difference between a pension with and without COLA.
What’s not to like about this approach then? There are at least two problems with this approach.
Problem 1: The Discount Rate
How sensitive are my results with respect to the discount rate? Let’s look at a range of different discount rates and see how the annual retirement budget changes in response to the different rates.
- 2%: the current interest rate on intermediate government bonds (e.g. 10-years). Actually, it’s even a little bit below as we speak, but let’s round that up.
- 4%: my initial baseline. Clearly a higher yield than a pure safe government bond portfolio. Even higher than most investment-grade corporate bonds. So, to justify a 4% discount rate we’d need some higher-return assets in our portfolio, e.g., equities and/or real estate!
- 6%: If I were to assign an 8% expected nominal return to equities and 2% nominal to bonds, then a 2/3 stock & 1/3 bond portfolio would give you exactly a 6% expected return.
- 8%: With a more equity-heavy portfolio and maybe pushing up the equity return a little more, one could get to maybe, maybe 8%. Recall, the very long-term equity real return was about 6.7% p.a., so plus 2% inflation would get you to above 8%.
- I don’t advise going any higher than 8%. I know that some clueless people out there point to much higher historical averages (see my post from earlier this year How To “Lie” With Personal Finance for examples), but here on the ERN blog, we don’t fall for that!
So, what’s the range of retirement budgets for the 2-8% discount rates? Please see the chart below. Wow, that’s a huge range: $44k to $104k per year! If we were to go from a 4% discount rate to 3%, we’d reduce the retirement budget by over 15%! Go all the way down to 2% and we’re at about $44k. 30% less than the budget with the 4% discount rate, ouch!!!

But here’s the good news; I can also pump up our retirement budget if I set the discount rate high enough. This actuarial calculation reminds me of that old economist’s joke:
A mathematician, a quantum physicist and an economist are asked: What is 2+2? Here are their answers:
Mathematician: “4”
Physicist: “Somewhere between 3.99 and 4.01” (Heisenberg!!!)
Economist: (closes the door, closes the blinds, whispers into the ear of interviewer) “What do you want it to be?”
So, we can really make the retirement budget anything we want. Then, what should we pick as a suitable discount rate? So, here’s the bad news: even if you’re an accountant and/or actuary and you absolutely despise finance you can’t escape the realities of financial markets. You still need to set a discount rate based on financial market assumptions. Getting this parameter wrong will render the entire calculation worthless because small changes in the discount rate will have a tremendous impact on the sustainable retirement budget. We face a really serious GIGO (garbage in, garbage out) problem here!
So, what are the best practices in setting your discount rate? Just to be sure, actuaries do have some guidance:
“Setting the discount rate involves constructing yield curves from the raw trading data. As an overview, this involves calculating the yields-to-maturity using traded Government Securities. Different traded bonds will have different YTM, depending on the term of each bond and therefore yields would be different for each term. They would then need to be smoothed, interpolated and extrapolated to produce the full yield curve. The discount rate chosen from the derived yield curve will be based on the expected duration of the asset / liability.” Source: Numerica Consulting
So, actuaries recommend you first determine the duration of your cash flows. Notice this is not the 40-year retirement horizon, but the weighted average of the times when we realize the cash flows, so probably somewhere around smack-in-the-middle at around 20 years. Then simply look up the bond interest rate at that 20-year horizon. Using government bonds (U.S. Treasuries) will put us right around 2%. Whoah, with a 2% discount rate we can withdraw only a tiny $43,931 per year, which is only 2.93% of our $1,500,000 portfolio today! Even stingy old Big ERN never recommends a Safe Withdrawal Rate that low. Even with investment-grade corporate bonds, we’ll have a hard time getting to a 4% withdrawal rate. I looked up the average yield-to-maturity of the IGLB ETF (iShares Long-duration Corporate) and it’s about 3.60% right now. That would imply a retirement budget of $59k annually. Less than 4% of the current portfolio!
Side note: My blogging buddy Actuary on FIRE did a case study on a pension evaluation, actuary-style and back then (two years ago) he used a 4% discount rate when the overall interest rate level was about 0.5 percentage points higher. So, probably, 3.5-3.6% today is not too far off from what an actuary might use!
OK, so, that wasn’t really helpful. But again, we’re not bound by what actuaries recommend. It’s not like the American Academy of Actuaries will send their SWAT team to your house if you do your NPV calculations in violations of their best practices. So, we can certainly tie our discount rate closer to the expected portfolio returns. My suggestions for picking a discount rate: To account for Sequence of Return Risk we have to set our discount rate significantly lower than our average expected portfolio return, especially when dealing with highly volatile stock portfolios and esepcially after we’ve seen a bull market in its eleventh year!
So, in other words, if your entire portfolio consists of relatively safe investments, say, government bonds, TIPS, I Bonds, investment-grade corporate bonds, etc., then sure, use the quoted average portfolio yield as your discount rate. But as soon as you add equities, be very careful about going overboard with your discount rate. What may seem like a “safe” consumption budget today may not be so safe a year from now. This brings us the second problem with the NPV method…
Problem 2: Return Volatility and Sequence Risk
The second problem with the NPV approach is that the “safe withdrawal retirement budget” may not be so safe at all. There is no guarantee that if you recalculate the whole shebang again next year that you’ll end up with the same safe budget again. It might be higher, it might be lower.
Also, just for the record, the fact that a withdrawal strategy updates sustainable rates from time to time is not a deal-breaker at all. For example, I really like CAPE-based withdrawal strategies and, by definition, the rates computed that way will vary over time. So it’s not so much IF we have to change our retirement budget, but more a matter of HOW MUCH we have to change our budget over time and for HOW LONG we might have to tighten the belt if our portfolio underperforms.
So, let’s assume our sample retirement couple followed the advice of the actuary and starts withdrawing $5,242 per month from their $1.5m portfolio for a year. First, let’s ask ourselves under what circumstances would we NOT have to change our real CPI-adjusted retirement budget after 12 months? The answer is pretty simple: if the realized portfolio returns came in at exactly the discount rate, i.e., 0.3274% every month or 4.00% compounded annualized, then there’s no reason to change course.
I just did a quick calculation to confirm this: First, assume a 4% annual return for the first 12 months. This will get you a $1,476,775 in month 13, which I discount by 4% to bring it back into today’s dollars (about $1.42m). Then calculate all the remaining NPVs of cash flows the same as before but only for months 13-480. (technical note: this is all done from a month 1 NPV point of view. I could have also calculated this from the month 13 perspective with the same results)
Lo and behold, even though the net worth is now different, the consumption target is the same (in today’s dollars) as before because the PV of the $1 over months 13-480 is also slightly lower than over months 1-480.

So, the good news is that if your portfolio return exactly tracks your discount rate, then recomputing this actuarial SWR over time will always come back to the original safe withdrawal amount. Nice!
But that begs the question: What if my portfolio underperforms the 4% return target? That’s the next table! Assume that the return over the first 12 months was a cumulative -20%. Not even the worst bear market, but just a garden-variety bear market. Just look at the table on the right (and this is all the Google Sheet posted online!!!):

Well, not much of a shocker here: the portfolio is down substantially and your actuarial safe withdrawal amount after year one also has to be cut substantially. There isn’t quite a 1-for-1 relationship, though: the portfolio underperformed by 24 percentage points relative and the consumption target then drops by “only” 19.88% (inflation-adjusted). But it’s pretty darn close!
So, the “safe” withdrawal amount that your friendly accountant or actuary will calculate for you is safe but only as long as your portfolio doesn’t drop. Well, thanks for nothing! It’s like car insurance that’s only good as long as you don’t have an accident.
Of course, one can always argue that expected returns will rise after a large drop in the stock market. That’s because the next bull market will be right around the corner, hopefully! So, if we raise our discount rate in light of the drop to, say, 5% we still have to reduce the retirement budget by 10.8% relative to the baseline.

What is the “correct” new discount factor? Not sure! I’m also not sure if your actuary/accountant would know. In fact, if your actuary/accountant doesn’t understand equity valuations and exclusively looks at the bond yields as a reference for the discount rate, then he/she might make matters even worse; if the next recession and bear market work out the same as the past few then the Federal Reserve will likely lower (short-term) interest rates, go back to quantitative easing to drive down long-term interest rates, etc. which will lower the discount rate and that will lower the consumption budget even further and the drop in your real consumption will be even worse than the 19.88%. So much for a safe withdrawal amount!
Just as an aside, I really like CAPE-based withdrawal rule (see Part 18) as I mentioned here in the SWR Series before; you also lower your withdrawal amounts in response to a bear market, but you still raise the withdrawal rate, and you do so in a systematic and rational and intuitive way because expected returns are also higher at the bottom of a recession.
Back to the basics: The ERN SWR Google Sheet
So, what kind of safe withdrawal budget could this retired couple have sustained when looking at historical data? Very simple, I copy and paste the cash flow data into the SWR Google Sheet (see Part 28 for details). Also, assume that this couple has a portfolio with 70% Stocks and 30% Bonds (10-year U.S. Treasuries) and a 20% final net worth target ($300k=$1.5m*0.2). The historical fail-safe withdrawal amounts for the following at-risk cohorts would have been as follows:
- 1929: $67,543 (=4.50% of the initial $1.5m portfolio)
- 1960s: $67,627 (4.51%)
- 1972/73: $68,066 (4.54%)
Much higher than what a 2.0-3.5% discount rate in this actuarial exercise would have generated. In fact, we can reverse-engineer the discount rate for the NPV calculation that exactly matches the historical fail-safe withdrawal amount: With a 4.47% discount rate, we get to a $67,542 fail-safe retirement budget (close enough for government work).
But how would I have known that a 70/30 portfolio would require a 4.47% discount rate to be fail-safe in historical simulations? 4.47% is significantly lower than the average return of a 70/30 portfolio historically: 5.8% above inflation, so that would imply a roughly 7.8% nominal expected return. To account for Sequence Risk, we’d have to cut that down to 4.47%. So, again: one would never want to do a SWR analysis purely based on this actuarial calculation unless you actually have only low-risk assets (TIPS, I Bonds) in your portfolio and you’re prepared for a very, very lean retirement budget in light of today’s low bond yields. For most retirees, especially those in the FI/FIRE community with sizable stock allocations, simulations should be the centerpiece of retirement planning and these NPV calculations here would be a nice way of presenting the data afterward. Not more, not less.
Summary
I present this approach, not as an alternative to my simulation-based approach, but mostly as an add-on. I would never, ever use this NPV/actuarial approach on a stand-alone basis. It’s garbage in, garbage out: All of your results pretty much hinge on one single input: The discount rate!
Also, this approach gives me no guidance for my asset allocation. Quite the opposite, you might feel compelled to go for the highest risk asset allocation because it has the highest expected return and thus the highest discount rate which will likely generate the highest consumption target. But historical and Monte Carlo simulations show that you should keep a non-trivial share in safety assets, even if the expected return is somewhat lower. So, as much as you might dislike the simulation-based approach it still has to be an important component of our analysis. Maybe tag on this actuarial calculations afterward to gather some additional insights. For that, I’d definitely endorse this approach!
I like it, Big ERN. I think coming at it from multiple angle helps confirm the simulation results and leads to a deeper understanding of the underlying assets via the discount rate. Well-done!
Thanks, Aubrey! Glad this was helpful! 🙂
As I rapidly near having to put all this into practice, I am still trying to adjust for the tax consequences of having a large portion of my portfolio in tax deferred [401(k) and Traditional IRA] accounts. Working with that is the question of Roth Conversions and the intendent (financial) pain in scheduled conversion plans.
I’m sure it’s been covered in the past, but I owe myself some time to search it out.
The Roth conversion planning is tough. Look at the case study from a few weeks ago and my suggestion for the Roth conversions in this post:
https://earlyretirementnow.com/2019/11/20/how-much-can-we-earn-in-retirement-without-paying-federal-income-taxes/
But this may not be applicable for everyone.
FYI – typo on the mortgage value in this line [ “The couple still has a mortgage with monthly payments of $1,8000 for the first 8 years (96 months) of their retirement. And needless to say, this is in current dollars and will not be adjusted for inflation.” ]
Gotcha! Thanks for pointing that out! You got sharp eyes! 🙂
Beautiful! Actuaries getting a big shout-out I love it!
You can’t imagine how much of my working life has been spent discussing discount rate methodology with colleagues and clients… I’ve also spent so much of my energy purging any kind of equity risk premium from pension discount rates – based on the view that the equity risk premium needs to be earned, and advance credit can not be taken for the ERP. However now that the shoe is on the other foot and I’m staring at my own personal cashflows I’m itching to put in some equity allowance!
Ciao!
Thanks, AOF! And, whew, I’m glad we’re on the same page on this one! 🙂
I do love the simplicity of the calculation, but life is messy. It’s full of unexpected expenses and investments rarely do what they’re supposed to. People rarely spend what they think they’re going to. There isn’t a calculation for the uncertainty of life. I prefer something that takes into account (at least) uncertain returns if not uncertain spending. Interesting article though.
This will always be an approximate solution because expenses will fluctuate.
You may run this exercise and do a Monte Carlo Simulation over expenses if you like.
Love these academic exercises. Personally I just calculated a 3% SWR and called it a day. Of course I have an additional asset in terms of a $1M house; so worst case I can sell it and move to a cheaper COL area.
Future expenses are so unpredictable that models can’t predict. Eg: No one who retired 20 years ago predicted smart phone in their budget; but I am sure every one of those folks is now using it. We might even have life extension options in the next 30 years which could be astronomically expensive. On the other hand, if I save for it and it does not materialize then I would have died with too much money. And that is as disappointing as not seeing some of my sci-fi dreams come true 🙁
Wow 3% is really low! You’ll do great!
I’m not at all worried about small potatoes like electronic gizmos like you mentioned. I don’t need to know WHAT exactly will be available in 20 years in that space. But I budget a certain amount for it and will buy whatever is the standard gizmo that a middle-class household will buy at that time.
But you make a really good point on the still unknown medical advances that could break the bank. One more reason to budget for a sizable cushion. 🙂
Another great but overly complicated post to read. You have to be a math wizard to follow
Oh, no, and I didn’t even publish any of the formulas!
One problem is, that you we all are able to do such sophisticated calculations in the age of 65. But maybe not any more in the age von 78. We might be ill and the brain might bei much slower. Adjusting Portfolios and monthly retirement rates might overtax many people in this situation. That´s why we need a simple way to calculate and the “safe” withdrawl. And “easy” is similar to “low” in this case. This seems the only way not to run out of money on the long term. If everything works better than expected our heirs will be lucky.
I´m writing this from Germany, Europe where we have zero interest on government bonds. A 3% yearly withdrawl with a simple rebalanced 70/30 Portfolio might be safe – hopefully!
Very good point!
I would probably set aside some money in old-age to hire someone i trust to do this for me. 🙂
Yeah, tough life in the EMU with interest rates so low. History will show how this will impact SWRs.
Viele Gruesse und Frohe Weihnachten!!!
I did 2 things when I retired. I created a real budget to track my actual monthly cash flow. From an accurate understanding of my monthly cash flow, I was able to construct a sheet to understand from where the cash will flow from on a monthly basis. I also worked to understand the likelihood that model would survive over time. From a understanding of my real budget, I was able to construct an actual cost of 20 years of retirement starting age 70. Age 70 is when SS my wife’s SS and RMD kicks in, I was also able to understand the tax structure I would have to operate under and I needed to somehow self fund a disaster fund or self insurance fund to belay the cost of getting old and dying. That model will take me from ages 70 to 90. I call this epoch 1
Next I created a model for the cost of my life between my retirement age and age 70. It’s during the post retirement – pre 70 phase you can make structural changes to your accounts that will optimize life post 70. So money came out of pre tax into Roth, and money came out of brokerage into cash to fund my life and to fund the Roth conversion and tax optimization, and to optimize the probability of successfully funding the amount I would need for a 20 ear retirement. I call this epoch 2 and covers ages 65 to 70 in my case. That epoch has been changed this year by passage of the Secure Act which allows Roth conversion to age 72. This allows for a more gradual Roth conversion and a lower overall tax bill. It also pushes out epoch 1 from 70 – 90 to 72 – 90 or 72 to 92. The point being the models need some specific flexibility in each epoch and in the combination of epochs. In other words it’s not one size fits all , it’s one size fits one. The plan needs to be granular to your specific situation and cover your specific probable outcomes
Next I created a model to understand how to most efficiently fund epoch’s 1 and 2. For me that meant I stopped funding pre-tax accounts at about age 50 because I realized I was going to need money to fund epoch 2. This meant I aggressively piled money into a brokerage and aggressively tax managed that brokerage using harvesting techniques. This resulted in turning my brokerage effectively into a Roth account since I had stored up tax loss, almost as a separate asset class. When it came time to spend the brokerage I was able to spend that money tax free because of the loss I had harvested. So funding became epoch 3.
I did more planning beyond the scope of the discussion but the above adequately makes the point. You start the plan in epoch 1 and work backward, not in epoch 3 and work forward. If you do it that way you will know how much you need to accumulate to fund each epoch. I bet I’m one of the few on here that can tell you what my retirement will cost. I view my portfolio merely as a product I use to fund my required cash flow. It is not a measure of my wealth, it’s a measure of my future purchasing power, which is the point of your article. By understanding the cost you can plan for contingencies that may occur along the way, things that are common and things that absolutely WILL occur, like death and the costs associated with death. If you are married you have 2 deaths to plan. Death may not occur in an instant, it may occur over a decade or two depending on whats going to kill you. The widow maker will make your wife a widow overnight. Alzheimer disease may take more than a decade to make her a widow.
This kind of analysis leads to a macro understanding of the likely cost structure of your life and your wife’s life based on the probabilities until your death. The probabilities are Bayesian and change as events happen. So in 2019 it’s law that RMD starts at age 70. On Jan 1 2020 it’s law RMD starts at age 72. This changes the probabilities. It’s not good or bad, it’s just a risk to be managed and minimized. Once you have this kind of macro structure of working backwards you have a really good idea of what you have to work with, and it’n on that idea that you can do micro optimization, and that’s where tools like Monte Carlo shine because those tools create risk metrics on a given scenario that can be compared to the risk metrics on a different scenario. So “what if” I use a BH3 portfolio vs “what if I use a 60/40 2 stock portfolio. “What if” I pull out 4.5% vs 3.5%. What if I hit bad SOR or inflation. By optimizing the macro in a Bayesian way and then using the micro to fine tune the probabilities you come up with a good understanding of the most likely future outcomes and the contingencies you need to cover the variation in the future.
These are extremely important articles in that they touch what’s under the hood.
Love it! Thanks for weighing in, Gasem. As always,
We think very much alike! There are many intertemporal planning problems where it’s most efficient to start in the future and roll it back. I had the case study a few weeks ago (https://earlyretirementnow.com/2019/11/20/how-much-can-we-earn-in-retirement-without-paying-federal-income-taxes/) where I did that to gauge the size of the Roth conversions today to minimize the taxes in the future!
Hi Big ERN,
Thanks for another useful article. Seeing this NPV point of view is a useful adjunct to the SWR Google Sheet (Part 28 of SWR Series). This was a what several of us wanted to understand and this article fit that need.
In addition, as GASEM points out above, the SECURE act modifying the IRA and Roth IRA rules will be signed into law today by President Trump since it is included as part of the Budget deal that must be signed by midnight today 20 Dec. It is interesting that more open and public debate and discussion did not occur in Congress or in the press before that happened. Specifically, the law includes the change that the inherited IRAs (non-spousal), Traditional or Roth, will now only last 10 years at most after the death of the owner instead of being STRETCHed over the life of our children for example. This will require us to modify our plans for these accounts and the need to convert from Traditional to Roth IRA. For example, making an inherited Roth IRA more valuable as compared to a Traditional IRA (or 401K) and thus more valuable the partial Roth conversions approach that you, Big ERN, laid out in your recent https://earlyretirementnow.com/2019/11/20/how-much-can-we-earn-in-retirement-without-paying-federal-income-taxes/ post. The good thing about the SECURE act is that we now have another 1.5 years (till age 72) before RMDs start since the RMDs amount diminish the amount we can convert to Roth without paying higher taxes.
So, the need for us to perform macro and micro optimization and the efforts you and others make to producing good finance tools to use for this purpose make your articles valuable to me.
Thanks, Tex-Mex! 🙂
Yes, good point on the Secure Act. I have to admit that the Secure Act is a net negative for us personally. RMDs will not be an issue for us at ages 70.5-72 anyway, but the Estate planning issues will likely be negative for us.
Hi Big ERN, Some of your readers may want details on all that the SECURE act entails. Kitces has a good guest post on it: https://www.kitces.com/blog/secure-act-2019-stretch-ira-rmd-effective-date-mep-auto-enrollment/
The post is very good and the comments are also valuable (illustrative of some issues and tactics to overcome them.) So just like here with your blog, Karsten. 🙂 Joyous holiday season to all.
Thanks for the link!
Haven’t thought about it too carefully. For us personally, we don’t benefit from the 1.5-year extension of the RMD rules. We would have withdrawn money between age 70 and 72 either way. But the elimination of the stretch IRA is a minus for us from an estate planning view.
I like the idea of reverse-engineering the discount rate that produces the fail-safe withdrawal rate in the simulation. That could be a useful benchmark to have in mind when planning one’s asset allocation.
Also, minor correction, with 8% stock ER and 2% bond ER, 60/40 would be 5.6%. 2/3 stock and 1/3 bond gets you to exactly 6%.
Gotcha! Thanks for pointing out that error! 🙂
Hello,
I’m kind of a spreadsheet “wonk” and enjoyed working through this exercise, thank you for publishing your file and your analysis. If I may, I have two questions:
1) I’m struggling with interpreting “% of today’s portfolio” and “% of today’s Net Worth”. You site the “% of today’s portfolio” in your initial example as being “not too far away from the 4% Rule” but it looks like the “% of today’s portfolio” calculation includes the other sources of income rather than from the portfolio alone. When I run my numbers (which includes higher SS and pension amounts than your example) I get a “% of today’s portfolio” of over 7.1% (much higher than 4%) and a “% of today’s Net Worth” of close to 3.6% (sounds about right). Could you please explain the disconnect here?
2) Why are separate inputs for health expense and nursing home included but not other potential changes in expenses? With one spouse deceased and the remaining one in nursing care, I would think that most other expenses would be gone at that point. Seems like double dipping to include this added expense without recognizing the corresponding reductions elsewhere.
Best Regards
If you expect a large enough income from Social Security, Pensions, Enheritance, etc. in the future you can see a large SWR as expressed in % of today’s portfolio. That’s as expected.
2: You’ll be surprised how insanely expensive a nursing home can be. When I say $8,000 nursing home expenses I mean the $8,000 ABOVE the monthly base budget. So, even if you reduce all other expenses to zero you’d pay your base budget PLUS $8k to live in the nursning home.
Also, you are free to set any number you like for yourself. This is just an example! 🙂
Thank you for your reply. 2) Understand I can set numbers to match my situation, was just curious as to your thinking, thank you for your explanation.
Love the spreadsheet, thank you for sharing!
Best Regards
I am not an actuarial, an accountant, a financial planner, or a math whiz, but I was able to carefully step through the spreadsheet and your explanations to come out with a realistic and actionable plan. Honestly, I don’t understand most of the detail in your models but reading your blog has massively increased my knowledge and strengthened my ‘retirement courage.’ Thank you.
Awesome! Glad you found this helpful! Thans, Laura!!! Merry Christmas!
Thanks for writing. Worth reading. Liked the inputs. Keep Posting.
Thanks!
Another gem in the SWR series. These have been a very informative as think through my own situation, so thank you!
One question – actually more like an observation. In the scenario where the market returns drop 20%, I did not expect the annual consumption target to be as low as it was even after increasing the future discount rate to 5%. I would have expected consumption to get closer to the base case amount.
Just a thought, but if we assume a 20% decrease in year one (which is totally realistic and likely understated), should the future discount rate be higher than 5%? Perhaps the 20% market decrease followed by the 5% discount rate assumption is too conservative? What do you think?
To keep the consumption target the same after the 20% drop you’d need a 6.15% discount rate.
Again: there’s no clear guidance on how far the discount rate has to increase. You could say that after a 20% drop in the equity market you’d lower the CAPE from 30 to 24 and thus the increase the expected real equity return from 1/30 to 1/24, which would be an increase by 0.83%. Not the necessary 2.15% increase.
Thanks for this amazing piece of information. It has been really helpful to me
I like the model of using NPV to calculate the safe withdrawal rate – we’re discussing adding to the NewRetirement Planner. I also like the idea of using NPV to let people see the value of benefits like SS and Medicare on their “balance sheet”
Nice work!
Thanks! Yeah, it’s a nice tool and might be easier to display and compare than net worth time series charts. But again, it’s only an add-on and can never be a stand-alone analysis! 🙂
One question regarding what inflation rate to use…. you are using 2%. That is what I am using in my model…. I have gone to some financial planners and they are using 4%… we will be 60 when we retire in one year… I think the 4% inflation rate they are using is too high…what are your thoughts on that?
The Fed has a 2% inflation target and I will use that number in my simulations. I’ve heard people go up to 2.5% which seems a bit high but it’s defensible too if you face a lot of health expenses or you’re a renter. But 4% seems crazy high.
My thinking of 2.5% (or even 3%) average is that with a 2% target, average will necessarily be higher, since Fed will act to lower if higher than target and not act if at 2% or expected to get there without action. So, inflation would necessarily spend some time above 2% based on that policy action model, since it is unlikely they can hold it at a consistent 2% over multiple markets cycles.
Do you disagree? If so, why?
Thanks.
It’s possible that for the next few years, CPI and PCE will stay stubbornly above 2%, just like in the 2010s (when this article was written) inflation stayed stubbornly below 2%. It will average out.
Ken Steiner, retired actuary and author of “How Much Can I Afford to Spend in Retirement” website, advises that the discount rate should equal the discount rate implied in the purchase of a current immediate annuity by a 65-year old (sex has little effect in the final calculation) using the Society of Actuaries MP-2018 mortality improvement scale. Currently this discount rate has just been reduced from 4.0% to 3.5% and is updated annually and it approximately represents the investment rate at which a retiree could settle most of their retirement spending liabilities using conservative investment assumptions.
You can certainly do that. But again, there are problems with that approach:
1: the initial WR is way too low. Much lower than what a 60/40 portfolio would have survived in even the worst possible scenario.
2: If you do have stocks in your portfolio, after a drop in the stock market (and the likely drop in interest rates, thanks to the Fed) you get a double-whammy: your portfolio is down and your actuary lowers the annuity interest rate and even firther lowers the withdrawal amount after that.
Again, all this would have been a great approach back 20 years ago when interest rates were still high. But in today’s environment with rates so low, this actuarial approach just gives you way too low of a WR.
Agreed. However, Steiner acknowledges that the actuarial approach is “self-correcting” – higher initial spending budgets early in retirement will produce counter-balancing lower spending budgets in future years (due to the inherent actuarial withdrawals occurring every year). Because of this ambiguity in setting a suitable discount rate, I assume this is why the actuarial approach (which you have so eloquently elaborated on in this post) should only be used as another “data point” in verifying safe withdrawal rates by simulation (Steiner admits to this idea also).
I don’t know “Steiner” and I can’t tell you what Steiener will do if your portfolio is down by 20%. But as I said in the article: The risk here is that after an equity drop that coincides with an interest rate drop (Fed policy) this actuary might actually exacerbate the portfolio drop because your discount rate drops and will lower your withdrawal amount even more. That’s the opposite of self-correcting.
You may not know of “Steiner” but if you are going to be writing about actuarial work then you should since he was writing about the actuarial method long before your blog was started. Apparently though, he is aware of your actuarial work and critiques it here (“Big ERN” Discovers the Basic Actuarial Balance Equation – see https://howmuchcaniaffordtospendinretirement.blogspot.com/2020/01/big-ern-discovers-basic-actuarial.html). In it, he reaffirms “What he (Karsten) fails to note is that the actuarial valuation process is a self-correcting process. If you are too optimistic with your assumptions early in your retirement, your actuarially determined real spending budget will decrease in the future as experience less favorable than your assumptions emerges….”
I think he misrepresented some of my work. I might write a response to his post.
I sent a few email back and forth with Ken. Also, we did some side-by-side comparisons of the 2008-2020 period. I was pleassantly surprised that his proposed discount rate would create withdrawal amounts over time that are not very far away from what my methodology. I still like mine because it’s market-based and gives you less volatile withdrawal amounts.
So, I don’t think that his approach is in any way a contradiction to mine.
In my mind regardless of actual asset allocation you should use the low bond discount rate for that part of your portfolio needed to pay future essential expenses (after social security and other income). The part of the portfolio left over beyond that (i.e. discretionary) that can have a higher discount rate matched to its expected return.
That sounds like a good plan: have two discount rates, one for essentials and one for discretionary.
Very very nice work.
Before encountering your SWR series, this was actually more or less how I calculated my future retirement budget (mine was sure less sophisticated though).
Only after reading the SWR series I understood how wrong the approach was – due to the exact same 2 problems you presented here.
Over time I ditched my method and adopted to the SWR Toolbox from part 28.
It will be interesting to use this new tool now that I feel more insightful and after understanding, as you mentioned, that it should mainly be used for data presentation and not for simulations alternative.
Yup, that’s the way I plan to use this tool, too! 🙂
Nice post. Using $2.1M port value, my annual consumption results were from $79.8K (@2.0% disc. rate), to $150K (@ 8% disc rate).
Question: if viable discount rate values range from 8% (risk seeking, aggressive gambling), down to 2% (ultra conservative, paranoid of risk), wouldn’t 5% be the middle of the road number?
Or is there an equation that translates portfolio asset allocation to discount rate?
I currently have a 23% (Stocks), 11% (Bonds), and 66% (Cash) allocation, which still allows me to fund my $65K budget for the next 35 years at 2.2% discount rate. Monte Carlo sims also confirm this.
My allocation may be crazy, but it seems to work.
It’s not that I am risk averse (indeed, most of the nest egg was accumulated through very aggressive investing back in the 90’s). I gambled, won, then cashed out. I haven’t seen the need to go back to the table.
I have been early retired for 15 years now, and having a hard time spending more than $70K year.
If the simulations, and actuaries work out, then what risks do you see in a 22/11/66
Answered my own question…
My foolish assumption was that Cash / Bonds would always have a positive real return, however slight.
Historical data seems to be all over the map with regards to -/+ real returns, and there seems to be a real possibility of negative returns.
After running some simulations with 0%, and negative returns for both cash, and bond for next 10 years, and also thereafter, I could run into some trouble.
I am now hoping for stocks to really go on sale, or least a correction. Trying to allocate up in equities in the middle of retirement, and at record high prices will be challenging, but there really seems to be no other alternative for positive real returns.
Again: you already won the game, so there’s no need to keep gambling. If you can get by using a 2% discount rate, maybe just go on like now, and keep a little bit of equity exposure for the upside and for your heirs. 🙂
There’s no simple answer to that. 5% seems WAYYY too high for the portfolio with 77% fixed income exposure.
If I were you I’d use a discount rate very close to the weighted average interest rate in your cash/bond portfolio. Certainly not more than 1 percentage point above that.
But if you get a 79.8k annual withdrawal at 2% discount then you should be OK if your budget is $70k.
Thank you for your reply, and all the great work you have done on this site. I think it’s some of the best work I have seen on the subject.
After being early retired for 15 years now, the question is no longer “Can I retire?, or “What is my (maximum) SWR?
The unknown I am trying to solve for is risk level (disc. rate?), or “What is safest (least volatile) allocation to support given known withdrawal rate?”
My situation is very close to your case study on Becky…..
Given that Social Security, 401K/IRA RMDistributions are known, (and to a lesser degree) tax rates, and inflation are known/ predictable, what would be my minimum level of equity allocation?
Using your Case Study Becky, you state that increasing her allocation to 80% equities adds tail risk and actually reduces her SWR from 6.59% ($89.2K) 6.12% ($83.1).
100% Stock allocation drops it further to 5.42% ($73.3K), which is about equal to changing her allocation to 23%/11%/66%, SWR= 5.43% ($73.5k).
Or, if she just had a $1.3M pile of cash, her SWR would drop down to 3.82% ($51.7K).
It is this apparently nonlinear relationship I wish to explore further.
From what source is your Cash database (column H on StockBond Returns) derived?
I would just enter the cash flows into my SWR Google Sheet (see Part 28), and then play with different asset allocations to see what works best.
Cash returns are 1Y Treasury Bill yields before 1934 and then 3M after that from the Federal Reserve intrest database (table H15).
Similar to a thread on bogleheads called “Time Value of Money”
https://www.bogleheads.org/forum/viewtopic.php?t=274243
It also includes a discussion of the discount rate for things like Social Security and, overall, is a PMT based withdrawal method. The percentage to withdraw and the discount rate are based on a rough guess of expected real returns. For stock, lots of choices including 1/CAPE, or data from multiple companies like Blackrock or Research Affiliates. For bonds, current SEC rate of your fund, adjusted for inflation or even just the current 10 year TIPs rate can be used. Precision isn’t necessary.
I should add, it’s recalculated each year.
Yes, it’s a very related approach. But there too, everything depends on the discount rate. If you work with purely expected equity returns, you should be prepared for significant spending cuts if the market drops. That’s why it’s normally best to apply a haircut to the equity expected return, then the drop in your retirement will be cushioned if returns are lower than expected. And if they are in line with expectations or even above you can always ratchet up the budget. 🙂
Another very good post. Very glad to see you delve a bit into the problems with various DRs and especially how adhering to bond rates when low (like now) can be as misleading as much as introducing too much equity risk premia into a higher DR. If you look at many pension plans (with their chronic funding issues) you will find most have been using total portfolio return assumptions as their DR and we see now where that has got them with funding. As several leading experts (Gold, Waring, Ryan) have pointed out, the essence of this approach would be to create time-segmented asset/liability matching so that all forward liabilities are funded absolutely by an asset. In the purest sense this would really only be possible with zero coupon bonds so already we have to relax the approach a bit. I think you have framed it well that the NPV approach COMBINED with other approaches creates a more robust context for deriving a SWR. In any event, I do believe one should never use a DR pushed too high into equity-level returns.
That asset-liability matching is certainly really useful for pension funds. Especially since they can also make some actuarial assumptions about the # of survivors going forward.
That’s much harder for a pension fund of 1 (or 2), i.e., personal retirement plans (See SWR Series 32).
And yes, lots of pension plans, esepcially the public ones have totally unrealistic DR assumptions, sometimes 7%+!!! Scary!
Hi ERN – First, thanks so much for all your hard work on this site it has made a huge difference for my FI planning!
I think I’ve discovered an issue on the Actuarial SWR Toolbox spreadsheet where the PV of the supplemental cashflow doesn’t calculate to month 1. It calculates for the series of payments but does not account for the delayed start of the respective payments, thus the PV is too high. I believe you had this issue on the SWR toolbox on the PV calculation for the CAPE method and you implemented a simple fix.
Apologies if this is just an error on my side.
Thanks
My mistake – Please ignore the above.
OK, whew, thanks for confirming!
No, there’s no such error in the sheet.
This calculation depends on the social security payments. Do you know if the ss.gov benefits calculator is giving its benefit estimates in today’s dollars, or is it in future dollars based on your retirement date?
The amounts are in today’s dollars.