
One of the most requested topics for our Safe Withdrawal Rate Series (see here to start at Part 1 of our series) has been how to optimally model a dynamic stock/bond allocation in retirement. Of course, as a mostly passive investor, I prefer to not get too much into actively and tactically timing the equity share. But strategically and deterministically shifting between stocks and bonds along a “glidepath” in retirement might be something to consider!
This topic also ties very nicely into the discussion I had with Jonathan and Brad in the ChooseFI podcast episode on Sequence of Return Risk. In the podcast, I hinted at some of my ongoing research on designing glidepaths that could potentially alleviate, albeit not eliminate, Sequence Risk. I also hinted at the benefits of glidepaths in Part 13 (a simple glidepath captures all the benefits of the much more cumbersome “Prime Harvesting” method) and Part 16 (a glidepath seems like a good and robust way of dealing with a Jack Bogle 4% equity return scenario for the next 10 years).
The idea behind a glidepath is that if we start with a relatively low equity weight and then move up the equity allocation over time we effectively take our withdrawals mostly out of the bond portion of the portfolio during the first few years. If the equity market were to go down during this time, we’d avoid selling our equities at rock bottom prices. That should help with Sequence of Return Risk!

So, will a glidepath eliminate or at least alleviate Sequence Risk? How much exactly can we benefit from this glidepath approach? For that, we’d have to run some simulations…
Background on glidepaths
Target date funds use a time-varying asset allocation depending on the participant’s age. The idea is that young investors can and should take on more risk and hold a higher portfolio share in equities. Then, as retirement approaches, investors shift more into bonds to reduce risk. In fact, you don’t even have to do this shift yourself; Vanguard or whoever your provider may be will do it for you! Here’s Vanguard’s take on the glidepath, see chart below. The equity share (domestic plus international) in their target date funds starts at around 90%, drops to around 50% at the traditional retirement age of 65 and then further drops to 30% by age 72.

But recent research has shown that Vanguard (and many other providers of target date funds) actually got it wrong, at least for the post-retirement glidepath. The glidepath of equity weights should ideally start to increase (!) again once you retire. Michael Kitces wrote about this topic (on his blog here and here and in an SSRN working paper joint with Wade Pfau) and proposed to keep the minimum equity share at or around the retirement date before starting to raise the equity weight again during retirement.

The rationale is that the rising equity glidepath in retirement would be insurance against sequence of return risk. After all, the number one reason retirees run out of money is bad returns during the first few years of retirement. A low equity allocation shields you from short-term equity volatility, but longer-term you will need the high equity share to make it through 40, 50 or even 60 years of retirement. So, a dynamic stock/bond share would thread the needle to achieve both long-term sustainability and short-term protection.
Of course, as with all of the traditional retirement research, it has limited use for the early retirement community. My experience has been that a lot of the research targeted at the traditional retirement crowd, calibrated to capital depletion over a 30-year horizon, is less applicable to the FIRE crowd. For example, Safe Withdrawal Rates have to be lower over a 60-year horizon than over a 30-year horizon. And, equally important, equity weights have to be higher over a 60-year horizon to ensure long-term sustainability. Case in point, the 30% equity weight at the retirement start and 60% in the long-term as indicated in the Kitces chart above would be way too low for early retirees!
So, when unhappy with the whole Kit(ces) and Caboodle of hand-me-down research, what am I supposed to do? If you want something done and done right, you just have to do it yourself! That’s where the Big ERN simulation engine comes in handy!
Simulation assumptions:
- Monthly data from January 1871 to July 2017.
- A 60-year retirement horizon.
- Retirement dates from January 1871 to December 2015 (with extrapolations using conservative return forecasts for bonds and stocks beyond July 2017).
- Final value targets of 0% (Capital Depletion), 50% of the initial real value and 100% of the initial portfolio (in real terms).
For each of the 1,700+ cohorts, we calculate the safe withdrawal rate, i.e., the initial withdrawal percentage that exactly achieves the final target value after 60 years, assuming withdrawal amounts are adjusted for CPI-inflation regardless of the portfolio performance. As usual, we calculate the SWRs for the 21 different static Stock/Bond allocations (0% to 100% stocks in 5% increments). But we also simulate a total of 24 different glidepaths, comprised of the different combinations of glidepath parameters:
- Two different end points: 80% and 100%. Why not lower end points? As we will see later, the long 60-year retirement horizon necessitates a much higher (long-term) equity weight than the often-quoted 60% or even 50%.
- Three different starting points: 20, 40 and 60 percentage points below the end point.
- Two different slopes. Notice that I had to increase the slopes for the glidepaths that cover more ground, otherwise, the transition would take way too long:
- 0.2% and 0.3% per month for the glide paths starting 20 percentage points below the max,
- 0.3% and 0.4% for the paths starting 40 percentage points below the final target,
- 0.4% and 0.5% per month for the paths that start 60 percentage points below the final target.
- Two different assumptions for the glidepaths: Passive vs. Active
- Passive means that we stubbornly increase the equity weight every month by the slope parameter.
- Active means that we increase the equity share only when equities are “underwater,” i.e. when the S&P500 index is below its all-time high. We want to avoid shifting out of bonds too early, i.e., before the market peak and then having insufficient bond holdings when equities take a dive.

The “active” glidepaths, of course, are dependent on the retirement cohort. The transition from, say 60% to 100% equities would take a little bit longer depending on how equities perform during that time, see a sample of active glidepaths for the January 1965 to January 1980 cohorts below:

Results:
Let’s start with the failure rates of our preferred safe withdrawal rate, 3.50%. In the chart below, I plot the failure rates of three static equity weights, 60%, 80%, 100%, as well as the various glidepaths. Those with a final equity weight of 80% at the top and with a final equity weight of 100% at the bottom. First, let’s do this for all 1,700+ monthly retirement cohorts regardless of equity valuations (“All CAPE”):

Some patterns emerge from this chart:
- There will be at least a few glidepaths with lower failure rates than the static allocations. It seems that the 80% to 100% and 60% to 100% glidepaths deliver consistently lowest failure rates, regardless of the final value target!
- Who would have thought that the maximum long-term equity weight delivers the lowest risk? This goes back to the superior equity long-term expected returns; once you make it through the shaky first 5-10 years exposed to sequence risk you want to max out the equity weight!
- The very long transitions over 60 percentage points (20 to 80% and 40 to 100%) tend to be pretty consistently inferior to the other glidepaths. The 20 to 80% glidepaths are even inferior to the static 80% and 100% allocations! Apparently, the initial stock weight was too low and/or the transition took way too long (even with the accelerated slopes of 0.4% and 0.5%!)
Do glidepaths become more useful when the Shiller CAPE is high?
As we have pointed out numerous times before (for example, in Part 3 of the series), the Shiller CAPE is strongly correlated with safe withdrawal rates. Plain and simple: Sequence of Return Risk is elevated when the CAPE ratio is high! Is that also reflected in the glidepath performance? You bet, see chart below:

- First, notice that the failure probabilities of the static rules are now much higher due to the higher CAPE ratio. Even a capital depletion target fails with about 17%, 7% and 12% probabilities for the static equity weights of 60%, 80%, and 100%, respectively.
- Most glidepaths pretty consistently beat the static equity weights. The consistently best performers are the 60 to 100% glidepaths and the active glidepaths perform slightly better than the passive ones. The failure rates are less than half those in the static allocation simulations!
- The 20 to 80% and 40 to 100% glidepaths are still inferior to the other glidepaths. And the 20 to 80% glidepaths are inferior to the even the static asset allocations.
More on the distribution of SWRs: Failsafe and other SWR percentiles
A lot of very risk-averse retirees like to set their SWR to the failsafe SWR in historical simulations. That seems very conservative, but I can see where they are coming from. If your strategy would have handled the Great Depression, the nasty 1970s/early 1980s, and the volatile 2000s you can probably also use it in 2017 without too much worry!
In the table below, I calculate the failsafe SWR, i.e., the minimum historical safe withdrawal rate (60-year horizon, 0% final value), as well as some other percentages (1st percentile, 5th, 10th and 25th). So, for example for the 80% fixed equity allocation, the absolute lowest historical SWR would have been 3.14%. A 3.43% initial SWR would have failed 1% of the time, 3.59% would have failed 5% of the time, 3.86% would have failed 10% of the time and 4.48% would have failed 25% of the time. I don’t think planning for a 25% or even 10% failure probability is very prudent – personally, I try to target a failure probability in the single digits, e.g., 5% – but I display the numbers just in case someone wonders.
The left portion of the table is for all possible retirement start dates (about 1,700 of them, monthly data from 1871 to 2015). The right part of the table is for those months when the Shiller CAPE ratio is above 20. In the top portion of the table, I also marked with green boxes the maximum value among the static asset allocation rules in each column. Notice how the maximum in each column is at between 75 and 100%! To make it through a 60-year retirement, you can’t have a 60% or even 50% equity share. That only works for 30-year horizons! Also notice that with a CAPE>20 all numbers in the far right column are <4%, so the 4% had a failure rate of over 25% regardless of the equity glidepath!

In any case, 60 to 100% glidepaths generate the consistently best SWRs. For the über-conservative FIRE planners who are looking for the failsafe 60-year SWR conditional on our current 20+ CAPE environment, a fixed 75% stock allocation would allow a withdrawal rate of only 3.25% and that’s already the max over the static allocation paths! The 60 to 100% glidepaths would have allowed between 3.42 and 3.47%. That’s an improvement of between 0.17% and 0.22%. It doesn’t sound like much but it’s an improvement of between 5 and 7% of annual withdrawals. Not bad for doing a simple glidepath allocation.
Likewise, if I’m OK with a 5% failure probability conditional on a CAPE>20, then the static stock allocation of 80% would give me an SWR of 3.47%. The glidepaths would have allowed between 3.57% and 3.63%. Only an additional 0.16%, but that’s about 5% more consumption every year!
So, we won’t get all the way to 4%, but we bridge about one-third of the way, simply by playing with the asset allocation over time.
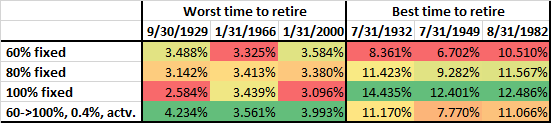
A small caveat, though; the calculations raise the question: do we get something for free? Is this some sort of a money-making arbitrage machine? Of course not! A glidepath will deliver a higher safe withdrawal rate if you have an equity drawdown early on in retirement. But the opposite is true as well. That 60 to 100% glidepath that performed so well during the major Sequence of Return Risk disasters will also underperform if stocks rally during the first few years of retirement. Let’s look at the table below that displays the SWRs of the 60%, 80% and 100% static equity weight and the 60 to 100% glidepath with a 0.4% monthly slope conditional on equity performance. As we already know, it beats the static equity allocation rules significantly when retiring at the market peaks (=worst time to retire). But the glidepath also falls significantly behind the 100% equity allocation if you were to retire at one of the three market bottoms (=best time to retire). It handily beats the constant 60% allocation and is slightly inferior to the 80% constant equity allocation. But I wouldn’t really care too much about falling behind in that case. You still get phenomenal SWR, just a little bit worse than the even more phenomenal SWRs of the 100% equity allocation.
Conclusion
Early retirees need the power of equity expected returns to make the nest egg last for many decades. Even more so than the traditional retiree at age 65! But that exposes us to Sequence of Return Risk. An equity glidepath can alleviate some of the negative effects of Sequence of Return Risk. But it shouldn’t come as a surprise that you will never completely eliminate the risk. For a given withdrawal rate, say 3.5%, we can only reduce the failure rate while leaving some residual risk. And likewise, the 4% rule would still not be safe for today’s early retirees even with an equity glidepath.
Moreover, an equity glidepath is like an insurance policy. A hedge against a tail event! On average it will cost you money, but if and when you need it the most it will likely pay off. Exactly when the static stock/bond allocation paths had their worst sustainable safe withdrawal rates you get slightly better results but you also give up some of the upside if the equity market “decides” to rally some more right after your retirement. But that’s a good problem to have!
While I appreciate your analysis and statistical approach (I am a an engineer), I do think single digit failure rates are very conservative estimates for retirement planning. Not many things in life are that certain. My whole professional career has been in the oil and gas business so measurement of risk and reward are ingrained in my logic. It may seem unreasonable from a risk standpoint to suggest that someone should have 30x their current spending with a 80% equity portfolio to retire. There are many adjustments that can be made and if planning well they can avert ultimate portfolio collapse. One of the things that higher net worth may allow is reloading the portfolio with second homes, land etc. which is really not explicitly contemplated in your commentary (probably beyond the scope of the article).
Additionally, most research has shown that in the case of typical retirement (30 to 40 years) the later years are when we approach the spending pattern of our early retirement years (the “smile”). When one looks at the assets on hand, liquidity of other assets etc. the analysis while academically rigorous seems overly conservative.
Thanks for the work and I do appreciate your graphical communicative skills, it reminds me of our probablistic models in my former career.
I’m loving this series. Maybe you talk about this elsewhere, but is there a good strategy for getting to a 60/40 allocation at the start of your retirement? I’m not going to just wake up with that allocation, and right now my strategy is 100% equities to get there as fast as possible (or fail trying). I imagine the tax consequences of re-allocating the day before you retire are pretty bad as well.
Ha, that’s a tough one. Not just 60/40 but also mortgage-free.
One route would be to move to a cheaper location, pocket the extra cash from the home sale and put that in bonds.
Another route: cold-turkey move a substantial portion of your 401k from stocks to bonds where you have no taxable capital gains from the portfolio shift!
Thanks for the reply!
Just trying to follow the 401k strategy: if I put the 40% bond allocation in my 401k, then during the glidepath portion of retirement, I would: shift .3%-.4% of that over monthly to equities in my 401k, and sell an equivalent amount of equities from my taxable accounts to cover my living expenses?
One consequence of this I don’t quite understand would be the taxes at the end when I withdraw from my 401k. If the account is substantially bonds for a 5-10 years, assuming the stock market hasn’t fallen, then the balance wouldn’t be as big in the end (which is 30 years for me)…
Do you explain the benefits of a cash buffer over a bond glidepath in any of your articles?
How much you shift depends on the particular monthly equity and bond returns. So, withdraw from the taxable account (all equities, I presume) and shift the S/B allocation to target the new shifting equity weight.
After you’re done with this you should be at 100% equities in your 401k. Some of which you picked up during the downturn. All withdrawals from there are taxed as ordinary income.
I haven’t compared the cash buffer with the glidepath yet. Good suggestion! They have similar features!
First, let me say I’m a huge fan and find your research absolutely stellar. However, I find a few of the claims you are making to be potentially misleading. This one in particular to me is worth highlighting: “…retiring at the market peaks (=worst time to retire)”.
While the market peaks around 1999 and 2008 certainly fit this to a tee, these are really exceptions not rules. There are literally hundreds and hundreds of other times when retiring near all time highs would have been the BEST time to retire (take 1982 as a classic example, the S&P hit an all time high and continued to make new all time highs for another 17 years!). That all time high was one of the absolute best times to retire, not the worst. We made all time for over a decade, each one of them was a perfectly great time to retire and to build wealth beyond most people’s wildest dreams.
1982 was a market BOTTOM not a market peak. And yes, it was a good time to retire exactly because it was a market bottom not a market peak. So I don’t think my claim is misleading at all.
You’re misunderstanding what I’m saying , sorry I don’t think I worded it quite right. What I meant to say was from 1982 all the way through to 1999 the market went on to hit all time high after all time high. Hundreds and hundereds of them. Even a day like Black Monday looks like a blip on the radar in the grand scheme of things.
At nearly any one of those hundreds and hundreds of ATH’s the claim could have been made that “retiring at market peaks is the absolute worst time to retire.” Well no, actually almost all of these ATH’s represented some of the best times to retire in the history of our country, and you’d probably know better than me the appox.time when that stopped being true (obviously some amount of time before 1999).
Point being that All time High’s in the market can be phenomenal times to retire, but it really depends on how extended from the base the market is (by the time we hit 1999 we were WAAAYYY extended, and the market went on to consolidate its gains for the next ~15-20 years depending on how you want to measure it, of course with a second even bigger bear market in between).
The main point is that its way more complicated than to simply make a blanket statement that “retiring at market peaks are the worst time to retire.” They can actually be great times to retire.
We are both right. When I say “market peak” I mean the peak right before the next bear market. A time series peak that we assigned after the fact (after we confirmed a new bear market occurred subsequently).
You seem to broaden the definition to each TEMPORARY peak before then. I agree that a fresh ATH as in the early 1980s or even 2012/13 is a good time to retire despite the fresh ATH. But you do realize that we’ve now reached a CAPE of 30+?! Very different from the beaten down market in the early 1980 with the CAPE in the single digits.
I agree, but you only know the peak in hindsight. What you know today only happens on the left side of the chart. So when people say, “we are at an all time high in the market” it always refers to the left side of the chart. And when we hit these all time highs its always “we’re at a peak”.
There are many, many metrics used to determine trend strength. CAPE is only a decent timing tool in hindsight. In real time, it tells you little to nothing about where the market is headed. Probabilistic forecasting would not call for using CAPE as it is an historically unreliable indicitor of market health and trend strength
Name me your top three metrics that looks cheaper today than 1989. Just you top three!
Hence my new table in the SWR Google sheet, see part 28. At the real-time ATH, the way you compute it the risk of low SWRs is higher.
Your way of thinking is a bit like musical chairs. Everything is good as long as the music plays. When it stops – and nobody knows when it stops – people will have a less than satisfactory retirement.
But again, don’t get me wrong: I’m also generally optimistic on equities. I have essentially 100% equities in my portfolio and even a Bogle style scenario is not the end of the world if you are not too aggressive with your withdrawals. See part 16 of the SWR series.
Oh and just for posterity’s sake (not that this is truly important) but 1982 was not a bottom in the market. 1982 was the very end part of a consolidation period in the market that had lasted nearly two decades, with many lower-lows touched within that consolidation box in the years prior to ’82 than were ever touched in 1982.
At the back end of 1982 the S&P took off and continued a nearly multi-decade run of all time highs that would finally culminate in the dot-com crash.
So I was not wrong in what I said. A new all time high in the stock market was in fact hit in late 1982, and the market never truly looked back from there, hitting many, many new all time highs for a period lasting around 17 years.
Again, it’s about semantics but by my definition it was a bottom and the start of the 1982-2000 bull market. July 1982 by month end numbers. (With two small interruptions in 1987 and 1991)
One last thought then I’m off my (much too) high horse. That thought is this:
1982 only looks like a bottom because we can now see the chart to the right of it. We know what happened. Now it LOOKS like the bottom. But at that point in time it wasn’t the bottom at all, it was the absolute top of the mountain. With many, many people saying “danger, danger”. But history shows that these peaks with devastating drops are exceptions, not the rule. Recency bias may very well be blinding us from seeing bigger historical truths. That when we break out of a 15 year consolidation box (as we just finally did in 2013), that the market can gain more than we’ve ever imagined. Its happened twice before in our history. History strongly suggests that we are currently in the midst of the third run,with many,many more all time highs yet to come.
If you’re still listening, thanks! I truly enjoy this blog a lot but I strongly disagree that we will look back in hindsight and see today as a bad time to retire. I believe we are in the equalivalent of 1989, with 10-12 more long years of gains to come
If you compare 1989 with today then I suggest you look at the valuations. The PE or the CAPE or any other valuation metric is a lot less attractive today. Today looks more like 1999 than 1989.
Most of the video in the link I posted below is spent addressing valuations and why historically valuation multiples have made for very poor stock market forecasting. Valuations conversation starts at around the 12 minute mark. Its well worth watching.
Here is Robert Shiller making the case for the potential for many more years of gains and explaining why CAPE ratio is not a reliable indicator in bull markets as well. Video is about two weeks old or so.
That tagline on the video is incredibly misleading by the way LMAO. Not sure where they came up with that…
If you are interested in some of the statistical evidence behind the claims I’m making they are laid out pretty well here: https://www.youtube.com/watch?v=0bkNfLLIuyU&t=1738s
This is a great series! Really great content. Thinking through a rising equity glidepath, it seems that you will often be selling bonds to buy stocks. But sometimes you may sell stocks to buy bonds, even as your target equity allocation rises. For example, if you are at 80% equity / 20% bonds, your new target allocation the following month may be 80.3% equity / 19.7% bonds. But if stocks go up that month, you may initially have an allocation of, say, 80.5% equity and 19.5% bonds, and to implement the glidepath you’d sell some stocks and buy bonds to get yourself back down to 80.3% equities.
I wonder what your sense is of a “relaxed” glidepath, where you sell bonds to buy stocks but you don’t sell stocks to buy bonds? Doing so would result in less churn, and perhaps more efficient from a tax perspective. But I wonder if it would it have inferior performance.
I’m not too worried about churn. If you implement this with mutual funds you can exchange them in retirement accounts without any fees to r tax implications.
What you propose sounds like Prime Harvesting SWR Series Part 13. It may sometimes help, sometimes it hurts. Recall that in the SWR Part 13 I showed that a simple glidepath sometimes beats the more complicated Prime Harvesting approach.
Thanks so much for all of the great thoughts here. This is inspiring, and I love the idea of a glidepath from 60% to 100%.
Would you consider having additional factors shape your slope?
1. Interest rates: Perhaps having a rule for every quarter point rise in interest rates on the 10-year bond yield, then add 1% to the Bond Portfolio. So instead of adding 3% to stocks at the end of the year (moving 60% stocks to 63% after Year 1), you would only add 2% to stocks if there was a rate increase. This of course would be hard to measure to be fully optimal, but directionally makes sense perhaps?
2. CAPE Index: I love the simple split performed by you on CAPE > 20 or not. Do we not want to go deeper than that for risk of overfitting? My thought was maybe add a percent to stock’s share every time the cape goes down by 3+ points. Again, hard to model but intuitive makes sense, right? Essentially a big dip in equity prices or a large rise in the 10-year run of earnings would cause the CAPE to drop 3+ points, so that may indicate a good time to have more money in stocks, all things equal.
Thanks so much!
Good questions!
I haven’t really played around too much with the bond interest rate signal. I will look into that. I feel that some tactical signal where you look at the spread between CAPE yield (=1/CAPE) and the 10Y yield could be used as an additional timing signal along the glidepath.
The CAPE cutoff is just purely for demonstrating that results depend on the CAPE regime. I’m not dead-set on 20 as the “right” cutoff but it seemd like a good starting point.
Note that when using the CAPE as a SWR timing tool (see SWR part 18) where you use a rule such as SWR=1.5% + 0.5 / CAPE, you do actually continuously change the SWR in response to changes in the CAPE. I’m definitely in favor of that.
Best,
K.
Firstly, I just want to say how much I love your blog, especially the safe withdrawal rate series. It has really changed my life and the way I think about early retirement.
I’m trying to reconcile a discrepancy I found in your tables, but I’m having a tough time and I was hoping you could help me understand what I am doing wrong.
In the fail safe table above, it says that the min (fail safe) SWR for 100% equities fixed through retirement is 2.58% for all CAPE regimes. It also seems to show that 75% equities fixed is better than 100% equities fixed when looking at the min column.
In part 2 of the series on Capital Preservation vs. Capital Depletion, however, the Success Probabilities for different Withdrawal Rates table seems to show that the success rate for a final asset target of 0 and 100% equities over 60 years and a withdrawal rate of 3% has a 100% success rate. It also seems to show that 100% equities is typically better than 75% equities.
I think I am misunderstanding something, but shouldn’t the chart above have a min (fail safe) SWR of *at least* 3% given that in part 2, 3% has a 100% success rate? Shouldn’t the 75% min be lower than the 100% min? Do these tables contradict each other?
Is the 100% success rate rounded up from something like 99.9% perhaps? Are the two cells I mentioned actually testing different scenarios somehow? Thanks for your help while I try to wrap my head around all this.
You’re right: It’s a rounding error. There are 4 months in 1929 where the SWR drops below 3% when using 100% equities, 60y horizon and 0% final value. 4 out of 1700 is small enough to not register in that table.
Thanks for the quick reply! That all makes sense then 🙂 But I’m also wondering about the discrepancy between 100% equities fixed being better than 75-70% equities fixed. It seems that 100% equities fixed is the best option in part 2, but not the best in the table above for both the failsafe column and 1% column. Do you know what might be causing that?
There are two very different criteria.
100% equities maximizes the success rate of the 4% rule, but might create some very nasty outliers around 1929.
If you had started in 1929 a lower equity share would have been better but at the expense of an overall larger failure rate of the 4% Rule.
So, this as expected! 🙂
Oh I see! Thanks you again!
Can you explain the decision rules behind the active glidepath a bit more clearly? Exactly how and when do you decide to increase the equity allocation? For example:
You increase on the last day of the month if the index did not hit an all-time high anytime during the month?
You increase in the first day of the month if the index is not at an all-time high on that day?
Also, are you increasing the target allocation by x% and rebalancing to that target each month? Or are you just adding x% to whatever the current allocation is at that time?
It’s easier than that. The portfolio is rebalanced to the target every month anyways. Whether the new target is w_old or w_old+x%.
The all-time-high is defined only through the time series of month-end numbers. It would be too messy to do this at a daily frequency! 🙂
Big ERN – now that you’re in early retirement, I’m curious to hear what glide path strategy you’re using? And did you transition to this glide path 2-5 years before retirement, or “cold turkey” when you retired? Also, have you developed any additional thoughts on what to adjust the 60/40 glide path to after you’ve reached 100% equities at 100 months? Meaning, any analytics around what equities/bonds ratio to bring back down to? I read through every single comment on this post (GOLDMINE of info by the way), but only saw 1 related response from you: “Thanks for the comment. The 100% equity portfolio is a hedge against the rare cases where for the first ten or so years equities took a nosedive. If your portfolio is down by 50% and equities are cheap again, then 100% may be the less risky path forward.
But hey, if you get lucky and you avoid sequence of return risk and your portfolio is not impaired 10-20 years into your retirement, most definitely go ahead and keep 70% equities if it makes you sleep better.”
Personally, I don’t have a glide path (yet). Our personal allocation:
55% equities
35% options trading (https://earlyretirementnow.com/2019/03/27/passive-income-through-option-writing-part-3/)
10% Real Estate
The 45% non-equities portion feels like enough of a hedge against an equity drawdown that I feel we need no further glidepath to hedge the 55% equities.
But it’s not for everyone. I don’t recomment the options strategy to a very large audience. If you want to be passive like ChooseFI, Jim Collins, and much the FIRE community you probably benefit from a glidepath.
Following up with the first part of Ian’s question. I see some mention by both you and Kitce regarding starting a glide path before retirement to help guard against retirement date risk. I’m 4-5 years out (44 now) but looking at dropping to 60% equity and then adjust back to 80-90% starting now using my 401k to reduce tax implications while still having high earnings. If I do 60-> 80% at 0.2% starting now, then I’m only 5 years into retirement when I’m finished with the glide path. Any thoughts what would be an optimal strategy given a strong desire to have a set retirement date (<50}?
Some background… My wife and I also have deferred compensation that we will receive for 5 years upon leaving (covers non discretionary spending) and both have non-cola pension plans that we could take without penalty at 59 1/2 that can help smooth out any large stock mkt disruptions later into retirement. We will be in a similar asset level as you are currently and with discretionary spending on par with nondiscretionary (FatFire) so we would have flexibility to cut back if things really got bad. We will be spending heavily from equities from 55 to 59 1/2 and from 50-55 if we maximize Roth conversions.
One way would be an “active” glidepath” as I describe it here. Then you only glide if equities underperform to stretch the GP over a longer interval.
That makes sense. One more request for advice given another conundrum that has been troubling me after reading your excellent “Why would anyone have a mortgage and a bond portfolio?” article…..how do we optimally move to the glide path given our situation?
Option 1 eliminate the mortgage (2.75% with no tax benefit given standard deduction) and then still switch to 40% bonds (recent inheritance received with no tax implication for moving out of equities since tax basis is from 2019…in fact we would harvest the recent losses)
Option 2 leave the mortgage as is and move 40% to bonds in 401k
Option 3 (move to 40% bonds + 280K additional into bonds while keeping 280k mortgage).
The first would appear to be the safest from a Sequence of Return risk but the second and third options guarantees more liquidity to move back into equity over time. The second option would not be a true 40% into bonds since the mortgage cancels out part of the bond stake (280k mortgage (reverse bond) and first 280k bonds largely cancel each other out…very small negative carry (-0.5%). Option 3 would be a true 40% into bonds but also leaves us with a house payment. We plan to sell the house in 6 years and largely reinvest money at that point while we travel for 3-4 years as nomads. Either way the house will be sold.
While I’m largely against market timing, given the high CAPE environment, recent inversion on 10 and 2 year and strong desire to retire within 5 years, I’m leaning towards Option 1 as the safest hedge against sequence of returns and retirement date risk. I don’t see interest rates rising in the short term in the current economic climate to justify holding bonds for liquidity. This approach would leave us with the lowest monthly obligations (nondiscretionary spending would be about 10% of income), we would use mortgage payment money to invest with no mortgage to pay and we will have about 1/3 of net worth in real estate and 2/3rds in investments (60/40 ratio).
At 4% I normally recommend paying down the mortgage by the time you retire. At 2.75%? I’d probably take my chances.
Especially if you sell the house right after retirement!
Hi Big ERN, great post.
I am trying to wrap my head round this and so would like to confirm my understanding and ask a few questions:
1. From what I understand, the actions one would take involve
a) Accumulation phase – gradually shift from eg 80/20 to 60/40.
b) Retirement phase 1 – gradually shift from eg 60/40 back to 80/20.
c) Retirement phase 2 – maintain 80/20.
If retired during a market crash, then I sell bonds and don’t touch stocks but allow them to rally.
2. Is there a scenario where I might have to sell some stocks?
3. What do I do with my stock dividends – do I reinvest them?
Thanks.
Great questions.
The glidepath determines what you sell, what you keep and what you rebalance (if pplicable).
Because the bond weight is declining in retirement you’ll likely sell mostly bonds. There’s no guarantee that you will never sell equities even during the rising equity glidepath. If equities go up you might, but then you’re not worried about selling them.
Dividends: money is fungible. If what you sell in bonds is not enough to cover the withdrawal you may have to touch the dividends. Or you may reinvest the dividends and even sell more bonds to invest in stocks (if the equity drop is really big!). All depends on the exact situation.
Hi!
What would be your advice for the accumulation phase of early retirement ? Should one be 100% equities or implement a gradual shift to hedge against retirement date risk ? If so, could you give a formula or rule of thumb of when should one start to shift ?
Thanks
I heard that question multiple times. I always answer:
If you have a set and fixed retirement date, slowly shift into bonds maybe 3-5 years before that date.
If you have no fixed date but like to get to FIRE as quickly as possible, and you have flexibility with the date: Sure, do 100% equities.
Thank you very much
Thanks for the through analysis on glidepath. I have a follow up question on how to interpret the result. Does SWR=expected portoflio value at end of 60 years?
I don’t spend much and my withdraw rate is only 2% (may take out up 3% on a good year, but my living cost is 2%). My understanding is that glidepath trade-off potential return early on to increase safety. Since my withdraw rate is so low, Does optimize for sequence of return also mean a higher expected portfolio value at end of 60 years?
There is a mathematical and monotone relationship between the SWR and the final portfolio value for a fixed WR. So, if your strategy affords you a higher SWR then for a given unchanged WR that strategy would translate into a higher final value.
Hi, I would like some advice.
I recently FIRED right before the crash(Ouch! i know!) with a 60 equities: 40 bonds portfolio. I was intending to do a post retirement glide path of 0.3% passive back to 90% equities over the next ~10 yrs. Given that valuations of equities have now fallen, do you recommend a faster steeper glide path into equities, say 5% p.a?
And yes, ERN, i really love your research, thank you so much for doing all these!
Excellent question. I would stick with the original plan. There’s no way to know how long this mess can last.
Remember, if you do a glidepath with 0.3% steps you’re already a) withdrawing only from bonds and b) even shifting money to stocks from bonds, the way bonds+stocks have perfromed recently.
So, you shoult be good to go with 60/40. You are likely totally fine and won’t need to lower your withdrawals! Best of luck! 🙂
Hi ERN, thank you for the reply. Do you recommend having a Cape based SWR ratio on top of having this glide path? I’m a little confused if I should be doing both methods or simply having to choose between one. Thank you.
Haven’t done the joint simulations (yet), i.e., CAPE-SWR plus GP.
Another interesting route would be not a pre-set GP but also a valuation-based GP based on CAPE yields vs. bond yields. So, it wouldn’t be a glidepath but a joint SWR and AssetAllocation model.
On my to-do list. 🙂
Wow, that would be awesome! Looking forward to those results. Have a great day ERN!
CAPE-SWR plus GP is the he way I’m going and will be FIRE by the end of 2020 would love to see the numbers, too!
To prepare for sequence of return risk (seeing also the high CAPE ratio) moved to 20/80 from 80/20 at the beginning of the year during the usual rebalancing (all kudos to Wade and Ern).
All further income thru 2020 incl. severance package are / will be invested in 100% equity only and starting the first year after FIRE in 2021 will transition over 5 years back to my final 80/20 asset allocation due to complete by the end of 2025. So glad planned ahead in time and thanks for this great series together with the knowledge from Wade’s Retirement Researcher course feel well prepared nevertheless this unpredictable Convid-19 crisis maybe another one time opportunity …
Wow, that was a lucky hand with the 20/80. If you move back to 80/20 you should do really well no matter what the market throws at you.
Best of luck! 🙂
Cross Fingers! Just follow my ISP and as my random yearly rebalance date choose my b-day @ the end of the month in January! Glad I did now …
Hi ERN. Do you have similar charts for retirement periods shorter than 60 years, in particular, the SWR heat maps?
I calculated some of the results for a 30-year horizon in SWR Series Part 20. Is that what you were looking for?
I stopped working in March with a 60/40 allocation and a plan to move towards 100% equity at 0.3%/month. This wouldn’t have been possible without your amazing SWR series. It was hugely informative in the formation of my plan, but also gave me to confidence to execute it. Thank you so much.
I was just re-reading some of your old posts talking about how bonds aren’t good for diversification. With the 10 year treasury yield being so low (compared to the 2.5% yield when you wrote those posts), I was wondering what you *would* recommend holding for diversification while following an equity glide path. Is ^IEF still the way to go? Thanks again.
Yeah, it’s a tough one. I don’t recommend holding much in bonds while still working.
But in retirement, you need some safe assets. Very few people can afford a 100% equity allocation. Maybe some bloggers with a working spouse and a ton of blog income (effectively a bond allocation). For us normal retirees, we need some safe assets even if expected returns are low right now. So, IEF is still the way to go for retirees! 🙂
Hello – thank you so much for your simulations, logic, visuals and recommendations. I’m looking at a 50-60 year horizon and really appreciate this. I think my biggest misunderstanding and curiosity is how to relate this to some other conservative approaches I was planning for – namely cash reserves. I had planned to be 80 equity / 20 bonds at early retirement and also have 3-5 years in cash reserves so I wouldn’t even have to sell anything if there are market dips early on… I will probably still have the cash and equity in house as backup resources ….
but based on what I’m learning here, it seems like the 20% bonds is a sufficient hedge, especially if I chose to do the active glide path and return to 100% equities later. In other words, it’s okay to sell bonds during market dips in early retirement. I am combining this post with your other safe withdrawal rates work and plan to withdraw 3.25% max for first 10-15 years. Would you suggest to go ahead and withdraw the full sum annually, and build a cash reserve even if my expenses come in under 3.25%?
I’ll keep reading and re-reading! Thanks in advance.
Cash reserves would work in (almost) the same way. But bonds have the additional benefit that their value often goes up during recessions (duration effect) while cash, MM, CDs, etc. merely preserve their value.
I have no strong feelings about annual vs. quarterly vs. monthly frequency. All should work roughly equally.
Thank you for your response! I am now planning to do no more than 5% cash in my portfolio to make sure I’m 15% bonds to hedge the stocks during the recession. I have been re-reading and using your google sheets! I will probably sell off quarterly and that way I can make sure I don’t exceed cash %. Thank you!
Thanks for all of your writing, I’ve found it the most thorough and useful work out there.
Managing sequence of returns risk using a glidepath appeals to me in these volatile times, and with financial systems seemingly taking on unprecedented risks.
In this post you’ve provided initial safe withdrawal rates for various glidepaths. How would you combine the glidepath technique with a dynamic CAPE-based withdrawal rate calculation, as you’ve described here and elsewhere:
https://earlyretirementnow.com/2017/08/30/the-ultimate-guide-to-safe-withdrawal-rates-part-18-flexibility-cape-based-rules/
If I was using a 60% -> 100% glidepath how would I calculate and adjust the SWR throughout the glidepath? It seems that if I applied the formula from your 30 August post directly, the SWR would be overly low at the start of retirement due to the high bond allocation.
Thanks again,
Craig
Good question. Haven’t simulated that yet.
My suspicion is that one would still use the CAPE rule calibrated to a 75/25 or 80/20 portfolio (likely a=1.75%, b=0.5), even when starting out with a slightly different allocation.
Hi ERN! Hopefully an easy question regarding the logistics of glidepaths…
When you’re calculating your monthly increase (let’s say .3% active/month), how do you account for equity market increases when the market is NOT at an all time high?
Example –
Previous month equity allocation was 63% equities and it was a great month but not an all time high. Current allocation is something higher than .3% – let’s say it’s now 63.7% equities. Do you adjust to 64% equities (63.7% current + .3%) or do you let it ride because it’s higher than the old 63% equities + .3%?
Hope you’re doing well! Thanks!
If the previous target was 63% and another month passed you now set the target to 63.3%, not 64%.
Hi ERN. Maybe if I ask the question a little differently based on your reply. Is it 63.3% of the current valuation or 63.3% of the original valuation. I would think the former.
63.3% of the current portfolio. 🙂
Hi Big ERN: I am interested in following case which I think has happened to a lot of retired investors over the past few years:
I want to use an ascending equity glide path 60% equity to 100% equity over a number of years using a 0.4% per month passive approach. But it happens that equities greatly increase in value over a year so that my equity:bond mix goes from 60%:40% to 70%:30%. Can I just keep that increased % of equity and continue on from there?
Or do I need dial back to 65%:35% mix by selling stock and buying bonds and then continue my steady 0.4% per month slope upward?
It’s up to you. The simulations in Parts 19/20 were done under the assumption of strictly rebalancing every year to the target, so you would miss out on the continued equity rally in that case. The GP really only helps you if there’s a meltdown right after you retire. If there’s none, you can be relaxed about the exact GP. 🙂
I personally think if your aim is to get to 100% equities and the market is helping you to get there faster, without you needing to sell your debt and buy equities, then I think it is a good thing. Rebalancing should be done only after you get to your target allocation. Equities could just keep rising and you will miss out if you sell them on the way.
Yeah. If there’s a rally, you might be out of the woods already. IT’s up to you: do you want to realize some gains and put money into a safe asset? Or ride the momentum?
Hi!
Thanks for a fantastic analysis. Between SRR articles and this one, it’s helped me to visualize a strategy I’ve employed since I started investing in 2001. During the 3 crashes (tech, housing, COVID) , I’ve increased my equities position. In 2008, even used margin to go above 100% equities, and in recent COVID crash converted bonds to stocks.
What do you think about an “equity glide path in the accumulation phase? Or more precisely, how large of a decrease in equity ATH would you lever up and come out with a higher cagr (minus margin rate) on a 1/3/5 year time span?
Hi ERN,
Your glide path series has been really inspirational for me. Although I am using it while I am working and I have inflows coming in. I find the glide path approach to get to my target allocation of 70% equities from my current 30% equities, is a much better way of doing it, rather than any other way.
I just wanted to add one thing. In your glidepath slope, you have used a linear percent increase each month. I did some simulations and what I found was that getting from 30% to 40%, with 1% increment per month, I only spent about 4% of my debt fund corpus. But Getting from 40% to 50% you deplete 8.8% of your debt corpus. Getting from 50% to 60%, you deplete 13.15% of your debt corpus Getting from 60% to 70%, you deplete 19% of your debt corpus!
So I find that at high equity allocation levels, the pace at which my debt corpus depletes could be unsettling for me. Hence I have modified the slope that every 10 month period, I only expend 4% of my debt fund corpus.
The downside is that with the approach of constant 1% monthly increase I get from 30% to 70% in 40 months. But with the reducing slope approach, in 40 months I get to only 58% allocation.
To me this sounds like a not bad compromise, given it is way better for my risk tolerance.
Would love to hear your views
If you want to see my simulation:
Glide Path with linear 1% monthly equity increase
https://imgur.com/lMQvBqu
Glide Path with reducing slope monthly equity increase
https://imgur.com/WZbKpBt
Some Assumptions.
1)Expecting equities to stay constant over the period, as base case scenario. They can increase but that helps you such that you dont have to deploy your planned amount of debt to equity. If equities fall, it is good and you are depleting your debt faster but you are buying lower.
2)My corpus I am measuring in Indian Rupees and the debt corpus generates about 6% returns and my new inflow is 400k Rupees every year and my current networth is 670 million Rupees and 30% of it is in equities right now.
I still prefer the linear approach. If the idea is that you simply use your bond portion to live off while leaving the equity portion untouched, then the GP should be roughly linear, shifting about an amount similar to the SWR from bonds to stocks, i.e., around 0.3% linearly per month.
Hi ERN,
I want to start by saying that I really like your blog, it’s very informative and helpful!.
I have 2 questions regarding glidepaths:
1) Suppose you retire with 1,000,000$ with AA of 60/40 (stocks/bonds) and you use the passive glidepath of 0.3% per month to get to 100% stocks.
Do you calculate this glide percentage from the current portfolio amount or from the initial portfolio amount?. Moreover, is that percentage fixed or can it be affected by market crashes for example?.
An example to clarify my question:
Let’s assume that in the first month of your retirement, the stock market went down by 50% and the bonds value didn’t change, so now you have a total of 700,000$ with AA of 43/57.
Assuming you decide that you can still retire with that amount,
Would you increase the stock allocation by 0.3%? meaning you’d add 2100$ to the stocks? (0.3% of 700,000$).
if I’m correct, I assume that you’d continue doing so (increase the stocks percentage monthly by 0.3% of the current portfolio amount) until your reach 100% stocks, right?.
2) let’s assume that upon retirement or during the first 10 critical years of retirement the market crashes, how do you know whether it’s lethal to your early retirement or you can continue with the retirement? can you deduce it somehow from the obtained withdrawal rate after the crash?. anything else?.
thanks a lot!.
Thanks. You rebalance your portfolio every month and target the % allocation based on the portfolio at that time. So, if 10 months into the GP you now target a 63/37 allocation, you rebalance to 63%*700,000=441,000 equities, the rest bonds.
2) you can’t deduce anything for sure. But if you calibrate the SWR to one that would have succeeded in 1929 and the 1970s, and you experience a drop less severe than what happened back then, you can probably still rest easy.
Thanks for your clarifications!.
1) Just to be sure that I fully understand the strategy (I’m planning on using it in my early retirement which starts now) :).
Please let me know if the following example is correct:
let’s use my original example 60%->100% with 0.3% passive glidepath steps:
60/40 AA: 1M$ total. 600,000$ in stocks and 400,000$ in bonds.
in the 1st month, stocks went down by 50%, so at the beginning of 2nd month we have:
43/57 AA: 700,000$ total, 300,000$ in stocks and 400,000$ in bonds.
so we rebalance to:
60.3\39.7 AA (+0.3% to stocks): 422,100$ in stocks and 277,900$ in bonds.
in the 2nd month, stocks went up by 10%, so at the beginning of the 3rd month we have:
~62.55\37.45 AA: 742,210$ total, 464,310$ in stocks and 277,900$ in bonds.
so we rebalance to:
60.6\39.4 AA (+0.3% to stocks): 449,779$ in stocks and 292,430$ in bonds.
Am I correct?.
2) Any chance you know what that SWR would be?
According to this article I found:
https://retireearlyhomepage.com/restud1.html
the SWR for retirement at 09/1929 should be around 3.10% for 60 years retirement, does it make sense?.
Thanks again for all the help! :).
1) correct
2) I get about 3.35% for a 70/30 portfolio, 60y, no additional cash flows. See my Google Sheet, Part 28 of the series.
Thanks again!.
BTW, what’s your take on annual withdrawals?. why is it better to withdraw once a month?.
No sizable difference.