
June 17, 2020 – Welcome back to another post centered around Put Option Writing. Today we got a real treat because my blogging buddy, fellow option trader and frequent commenter “Spintwig” offered to do a guest post to perform an independent review of my trading strategy. If you don’t know Spintwig, he also retired in 2018 (at age 30!!!) from a career in ITnd now writes about FIRE and options strategies at his blog. He does a lot of interesting and important work, including careful and comprehensive back-tests of different option trading strategies, i.e., different underlying assets, different Deltas, different horizons (days to expiration), etc. I highly recommend you check out his work if you’re interested in option writing!
Oh, and following the guest post, I’ll also give a quick update on how my portfolio did during the crazy, scary volatility last week! Stay tuned!
Over to you Mr. Spintwig…
Thank you BigERN for the opportunity to peer review your options strategy and publically share the results with you and your readers. I’ve relied on your research in my own journey to and through FIRE and I’m happy to be able to add to the discussion and body of research.
A few years ago I stumbled upon BigERN’s blog as I was researching safe-withdrawal-rate topics. Among the material was a novel idea: selling put options on the S&P 500 index could mitigate sequence-of-return risk.
The concept was straightforward but I wanted to know if there was an optimal approach or if it could be applied to other indices and have similar results. Would it be advantageous to replace a traditional buy-and-hold portfolio with an options trading strategy? Unfortunately, there were no definitive or trustworthy answers to this question on the internet so I set out to do my own research and publish what I find.
Research Basics
The act of evaluating how a trading strategy performed over time is called backtesting. What I wanted to do was backtest various option strategies on the S&P 500 to see how they perform. I won’t bore you with the details of my research methodology; the takeaway is that the backtest results are publicly documented, fully transparent and, most importantly, compared against a relevant buy-and-hold benchmark.
There are two key attributes to keep in mind when evaluating performance: compound annual growth rate (CAGR, or sometimes called geometric return) and volatility. The timing and severity of volatility is the driving factor behind sequence of returns risk.
According to BigERNs data, an investor is better able to handle equity volatility, and consequently reduce sequence of returns risk, by writing options on an equity index as opposed to investing in the index directly. Let’s see how BigERNs option strategy performs when maximizing the effects of the central limit theorem by performing a formal backtest. The option strategy will then be compared against popular buy-and-hold benchmarks.
Backtest Structure
In BigERN’s 3rd update on option writing, he makes note of a few details regarding his strategy. In particular:
- Positions are opened every Monday that expire Wednesday, every Wednesday that expire Friday and every Friday that expire Monday
- Positions are held till expiration
- The time value target is roughly equivalent to a 5-delta position
- 2-2.5x leverage is used
- The underlying is SPX (the S&P 500 index). I’ll be substituting this with SPY (the S&P 500 ETF) for the purposes of making the strategy more accessible to those with smaller accounts.
This is enough information to perform a backtest. To spice things up, let’s see what happens when different amounts of leverage are used. Also, there’s a popular strategy that says to close short option trades at 50% max profit to boost performance. We’ll look at that as well.
As for the benchmark (data courtesy of Portfolio Visualizer), let’s compare against the following buy-and-hold portfolios with dividends reinvested:
- 100% SPY
- 80/20 SPY / IEF
- 60/40 SPY / IEF
[ERN: The SPY is one of the most widely used S&P 500 index ETFs and the IEF is a popular ETF to get exposure to (intermediate) 7-10-year U.S. Treasury Bonds. ]
The backtest will measure from Feb 21 2018 through June 5, 2020.
[ERN: The way I understand the underlying calculations that spintwig sent to me, the SPY and SPY/IEF returns refer to the Feb 2018 to May 2020 monthly returns from Portfoliovisualizer.com, so the returns don’t line up 100% with the put strategy returns!]
Feb 21 2018 is a special date in that it’s right after Monday-expiring weekly options on SPY were introduced (see SEC release 34-82733).
[ERN: Too bad this doesn’t capture the Feb 5, 2018 drop, but so be it! We do have enough vol spikes in there, including the fourth quarter of 2018 and February/March 2020!]
All in, we have the following backtest configuration:
- Symbol: SPY
- Strategy: Short Put
- Start Date: 2018-02-21
- End Date: 2020-06-05
- Position Entry:
- every Monday
- every Wednesday
- every Friday
- Trade Timing: 3:46pm ET
- Strike Selection
- 5 delta +/- 0.5 delta, closest to 5
- Position Exit:
- 50% max profit or expiration, whichever comes first
- hold-till-expiration
The nitty-gritty details and assumptions of the backtesting methodology such as margin collateral, margin calls, moneyness of positions, commission, slippage and more can be found here.
Let’s see how the strategy performs!
Backtest Results
Starting Capital
Since backtests are backward-looking, hindsight bias can be used to identify the starting capital necessary to achieve various leverage targets.
The rule of thumb is 20% of margin utilization = 1x leverage. Thus, using all available margin is comparable to 5x leverage.

Due to the dynamic nature of options, maximum margin utilization is not a linear function. In other words, the capital needed for 2x leverage is not exactly half the capital needed for no leverage (1x).
Compound Annual Growth Rate


Here we see the returns of BigERN’s strategy, namely the 5D 2x hold till expiration, outperforms 2 of the 3 benchmarks with regard to geometric return.
Since we know his leverage target is between 2-2.5x and thus the CAGR will be between 7.03% and 9.79%, we can reasonably conclude that his strategy outperforms or is on par with all relevant benchmarks.
[ERN: This is a slightly unfair comparison because it ignores the fact that my strategy is purely on margin whereas the benchmark portfolios eat up your entire margin cash. Specifically, with my put writing strategy, you have essentially all of your margin cash available to earn some additional interest income. But depending on how crazy you go with pumping up your yield, it will also increase the risk. 🙂 So, a fair comparison would have been to subtract a cash yield from the SPY/IEF benchmarks or add some interest-bearing asset to the put strategy returns!]
Meanwhile, exiting trades at 50% max profit lowered returns. This is from a combination of 1) lower premium capture, which we’ll see next, as well as 2) increased commission drag (the cost to close a position).
[ERN: Exiting the position early after earning 50% of the profit only makes sense if you immediately write another option so as to avoid any zero-delta days. In other words, if my Wednesday options already earned almost all their premium on Tuesday, I might as well close them and sell a new batch of options with either the Wednesday or Friday expiration. That will increase your revenue but also your risk!]
Premium Capture

Premium capture is the same across leverage targets, which is expected. By managing trades at 50% max profit we see average premium capture is closer to 50%.
Another way of looking at this table is: when holding till expiration, losses consume 44.57% of profits. When taking profits, leave a little less than half of the proceeds in the trading account for the eventual loss.
Speaking of losses, how often does this BigERN’d strategy lose?
Win Rate

Not very often – less than 4% of the time. However, those losses are substantial. Just 3.33% of the trades wipe out nearly half of the gains!
[ERN: Yeah, you got that right! The spirit of the strategy is “picking up nickels in front of a steamroller,” so the occasional loss can be substantial! It’s not “Picking up Benjamins in front of a baby stroller” for sure!]
There were 330 trades in the 5D hold-till-expiration backtest; 11 of them were losers. The average win was $13.29 and the average loss was $163.45. The largest win was $93.50 and the largest loss was $428.50.
[ERN: For comparison, I had 9 loss events during that time. During the high-vol periods, I normally reduced my Delta a little bit (as detailed in last week’s post) so, I might have avoided some of the losses along the way, though also at the expense of lower gross option revenue!]
Volatility

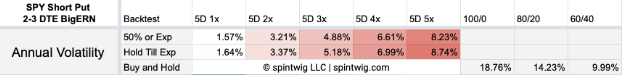
It’s easy to see that introducing and increasing leverage increases volatility.
BigERN’s strategy has 82% less volatility than a 100% SPY portfolio despite the strategy being based 100% on the SPY equity index. It even has 66% less volatility than a conservative 60/40 portfolio!
Sharpe Ratio
When we divide the compound annual returns by the annual volatility we get a number called the Sharpe Ratio. It describes a strategy’s risk-adjusted return, or how much return is generated per unit of risk.
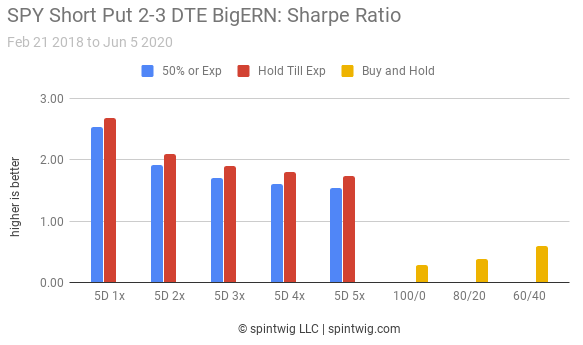

The BigERN strategy has a substantially higher Sharpe ratio than any of the buy-and-hold portfolios. Let’s dig a little deeper into the risk details to see what the max drawdown looks like.
Max Drawdown


The max drawdown of BigERN’s options strategy is a fraction of the benchmark portfolios. This is exactly what we want as it mitigates sequence of returns risk.
Overall Performance

BigERN’s strategy is highlighted in neon green. Commensurate with the high Sharpe ratio, the equity curve moves up and to the right while experiencing a fraction of the volatility associated with any of the buy-and-hold portfolios.
Discussion
BigERN’s strategy performance is pretty impressive and it appears to check all the boxes to solve the sequence of returns challenge – far lower volatility and ample returns. When we consider the fact that BigERN’s leverage target is a little above 2x, the bright green line is actually higher than all three buy-and-hold equity curves.
Despite the backtest duration being only 2 years and 3 months, there is a good mix of swift and deep declines along with strong and prolonged recoveries over the evaluation period. This timeframe should provide a decent survey of strategy performance over different market environments.
I’d like to turn it back over to BigERN to get his input and reaction.
OK, back to Karsten again:
In this day and age, everyone can just post on the web and showcase their awesome, foolproof strategies and how smart they are. But you lack credibility unless other people try for themselves and repeat and replicate your success.
That’s why I thought it was such a great idea to get Spintwig involved to perform an independent review. This was extremely helpful! Thanks for doing this!
Of course, I should state the obvious: my actual strategy, the way I implement it is still slightly different, for (at least) three reasons:
1: I don’t strictly adhere to the 5-Delta rule, as I outlined in last week’s post. Here’s my actual Delta over time. You can see that I started out with a slightly higher Delta but I’ve since scaled it back a little bit from a 6 to 7 Delta to a ~5 Delta. Also notice that occasionally I’m operating at a much lower Delta. Those periods coincide with the vol spikes (see the orange line, inverted scale on the right).

2: I occasionally trade some additional discretionary contracts, sometimes only intra-day, sometimes on the off-days (Tuesdays and Thursdays). I wrote about the philosophy last week!
3: I keep some additional interest and dividend-paying assets in my portfolio, so the margin cash isn’t sitting around and getting bored. So I like to look at both the put-option-only portion of the portfolio (comparable to Spintwig’s numbers) but also the total portfolio return with the interest/dividend-income-producing asset included. Over the same 2/21/18-6/5/20 time span, I had return and risk values just below the 3x strategy in Spintwig’s simulation even though I was running this at only about 2.4x leverage. I guess I added a little bit of extra return but also risk through my discretionary trades.

As I’ve mentioned here before, the biggest risk in my portfolio, recently came from holding some more exotic dividend-paying assets (muni bonds, leveraged muni bonds through closed-end funds and individual preferred shares), while the scary-sounding derivatives trading has a pretty low risk right now.
But despite all the differences, we still get qualitatively and quantitatively consistent results if we compare the ERN Puts Only strategy and the Spintwig 3x version.
A quick favor to ask before we get to the issue of last week’s market drop: Please head over to the site “Hack Your Wealth“. I chatted with my buddy Andrew on his podcast about FIRE, Sequence Risk, Safe Withdrawal Rates, the flaws of the 4% Rule and much more. I had a lot of fun and I’m sure you’ll all enjoy that episode, too!
A quick update on last week’s volatility spike
When I published my post last week on Wednesday I proudly declared how well the strategy has performed so far in 2020. Ironically, it took only a single day for Mr. Market to catch up and get me a little bit nervous. Shouldn’t have tempted the market Gods! 🙂
But fortunately, my portfolio survived the event. Just to be sure, it was a scary time, especially because the big drop occurred on Thursday, only one day into the 2-day option trade. But luckily, the market recovered again on Friday and only half my put options landed “in the money.” So the loss was manageable. Here’s the YTD P&L from the put writing strategy:

My strikes for June 12 we between 3010 and 3055. Since the index dropped all the way to 3,002 on Thursday we saw this significant intermittent loss on Thursday. But with the recovery on Friday I ended up with “only” half of my options in the money with strikes at 3050 and 3055. My other options with strikes at 3010, 3025 and 3030 were safe.
So, there you go! The strategy is still holding up pretty well despite the big drop last week!
Thanks BigERN! Good deal on managing the June 12 vol spike, too!
Hi Awesome work! What data source did you use for this?
Thanks! ORATS parsed the raw CBOE data and provided the trade logs. I used my own tools to parse the trade logs into something a bit more consumable.
Glad you liked it! Great guest post – thanks for doing this! 🙂
Big follower of the strategy and it’s got great results even thru volatile markets. Karsten – how do you treat your retirement accounts? Mostly just passive funds or do you replicate the same put writing strategy in there as well?
Retirement accounts are mostly passive index funds. I’ve started with some play money to trade individual stocks and do the covered call selling (that’s all I can do at Fidelity in an IRA). But that’s a lot of work. Not sure if that’s worth it…
Thanks Spintwig and ERN!
Spintwig – I had read your post comparing your put strategy to ERN’s, but looking forward to reading more of your research!
ERN – a question that came to mind that came to mind from the after-hours drop between 6/10/20 and 6/11/20:
Is there a reason (other than it being early in the west coast) that it would not be advantageous to sell your puts at market opening M/T/T instead of at closing M/W/F? The overlap of the expiring options isn’t important at your leverage but does matter for anyone using higher leverage like Spintwig’s above 5x (NOT that that’s what I’d do!) given margin requirements, although that’s the smaller factor in my “reasoning” (if you could call it such). Looking at YTD market moves, there were big swings up and down overnight. I remember seeing a graph back in April (from a reasonably trusted financial reporter, but I can’t find it now) that the market excluding the first 10 minutes of the day showed MUCH smoother daily returns over the 1-2 months in the chart (hard to express in words but the graph was fairly clear), and I would guess much of that is overnight movements. You’d need to sell closer to the money to reach the same delta / time value targets but wouldn’t that not matter in a (reasonably) efficient options market? I suppose the EMH argument for selling 20 minutes later in the trading day (10 into the next day instead of 10 in the prior day close) could be extrapolated into which delta you sell. That obviously doesn’t hold at the extremes given selling ATM puts like the CBOE research doesn’t have the same risk/return profile as your strategy, so I don’t have a good intuition and haven’t yet taken the backtest route given I wasn’t sure where to find that data until just now per Spintwig’s above link. I’m mostly basing it off the fact that implied vol is greater than realized vol / VIX (per your earlier posts and easy to check when making the trades) so I’d assume that is true first thing in the morning just as it is in the evening. Selling closer to the money but with much less vol could prove useful at reducing risk and made up for by either increasing leverage or stepping up just a tad in delta?
Appreciate the articles and the thought. You’re the best I’ve found online and I have recommended your blog to so many people. One of your previous options articles mentioned using Dave Ramsey to get out of debt then discarding him for investing. I tell people the same about many FIRE bloggers: use them to learn how to cut costs but come to ERN to know what your SWR needs to be and to execute the details of glidepaths, cash holdings, and asset holdings…with the added benefit of this GREAT series on options for nerds like me.
Tyler
Thanks for the compliments! 🙂
I’m not selling large quantities at the open, for sure. I spread out my 10 contracts into maybe 5 trades of 2 contracts each. Sometimes the first batch is right at the open. But you’re right, there is a lot of vol in those first 10 minutes. I often wait until things have settled a bit.
But I also believe in the EMH. Sometimes you wait to sell your contracts, the market actually moved down slightly but you still have to sell at a higher strike because some of the time value has already melted away.
So, long story short, my exact approach is not something I can distill into an easy rule/formula. It depends how I fell that day. But a general rule is that I can take some additional risks (including selling a same-day put at the open) if the overall portfolio delta is low. See Part 4.
Is there no scenario where you’d look to manage losses? Like last Thursday’s crazy -6% move could have extended further. Or do you just trust that the inherent low delta written is risk management enough?
I kind of wonder if you wrote a higher delta and put stops in at like a -300% loss or something if you’d collect more premium with a defined risk so your “losers” wouldn’t be as extreme and put you in the hole as bad.
I think I commented awhile ago that your bond holdings scared me more than your put writing 🙂 Seriously though, in hindsight would you have been better off just increasing your leverage in the put-write holdings to achieve the same total returns as your put-write + bonds portfolio? In other words, I don’t think the bonds are adding much from a risk-adjusted return perspective. I would love to test a strategy that uses more leverage but then buys some insurance with some of the extra returns such as holding short term put back ratios that would explode in value if we get another quick down move.
I’m not looking at any backtests when making this reply, but I would suspect your comment is generally true except in the extreme volatility spikes. Puts Writing article #2 has discussion of 1987’s Black Monday in the comments. Based on the data other commenters provided, ERN estimated he’d have lost 33% (21% market drop w/ 10% out of the money put sale @ 3x leverage – 3*(21%-10%) = 33%). Increase the leverage to 4.5x and he’d have lost 48%. The bonds/preferreds may increase his volatility in the ‘normal’ times, including 2000/2001 drop, 2008/2009 drop, etc. where vol ticks up steadily and the 2-day puts can generally stay ahead. The real issue is a crash where vol shoots through the roof and, when comparing to benchmark (in this case, a standard S&P500 holding), getting whipsawed where his options expire when he’d lose almost 50% but the catch-up is a slow and steady climb. By holding bonds or preferred equities, his portfolio would see the large dip but he wouldn’t be forced to liquidate so he’d ride it back over the next few months. In short, I would estimate the bonds/preferred serve as a hedge against the black swan, very fast draw down and if he’s able to generate the returns with low enough vol to support his SWR, that’s a wise hedge to take in retirement.
Ha, just replied to the original comment.
Yup, exactly! That downside skewness puts a lid on how much leverage I like to use with the options! 🙂
Yeah, that occurred to me. Good point. But going from 2.5x to 5x also creates too much negative skewness risk. In other words, in a bad enough market drop (Oct 1987) it would wipe out too much of your portfolio. With that in mind, I’d rather take my luck with preferred shares. At least they will always converge back to around $25. 🙂
I suppose I’m on a ‘no data’ kick given this is my third comment without data support! But I’d be interested to see the negative correlation on consecutive trading days, especially after big moves. If it’s strongly negative, it’d be scary to stare at the potential for back-to-back losses and that’s a risk inherent in the strategy, but it’d probably produce better long-term results by riding it out and giving the market a chance to bounce back. Looking at ERN’s chart for YTD, four of the six biggest P&L losses recovered by expiration and, while the other two hurt, he’s still produce steady returns YTD. Had he sold on those draw down days to cut his losses, YTD returns would be much worse. I would also imagine that times where the market dropped on back to back days tends to have a vol increase in the lead-up so the risk is somewhat mitigated. The first vol spike may be a surprise but thereafter he could try to stay ahead of it. All speculation without looking at the data but would be curious to see others’ comments.
That’s a good point. Even a stabilization of the index the next day will often already give you a big positive return. So, there’s a bit of a negative correlation in the daily short-put returns. This means that the monthly returns are less volatile than sqrt(21)*vol of daily returns. And it’s a reason not to manage the daily losses. 🙂
Risk is typically managed at order entry – i.e. position size (number of contracts) and delta. It’s absolutely a trust fall 🙂
With regard to stop losses, they generally underperform profit takers. Conceptual explanation why this is the case and supporting data: https://spintwig.com/how-to-trade-options-efficiently/#Profit_Targets
As for taking profits early, that tends to perform well when the ratio between trade fee and total premium received to open the trade is small. Since 2-3 DTE positions generate little premium in an absolute sense, commissions to close the positions is relatively large and causes the mechanic to underperform.
Probably there is such a scenario. But that day, I looked at the P&L of potential Friday market moves and decided it’s still within my risk model. So, even with another 5% loss on Friday, I would have not looked too bad.
This is fantastic! Thank you both, Spintwig and BigERN for the great work. I have been looking forward to seeing something like this for quite some time and this post is more than I could have hoped for!
I was somewhat disheartened to read of ERN’s concern that Spintwig used monthly puts, rather than the canoncial weeklies. But I wonder if that is accurate. In his specifications, Spintwig states:
Positions are opened every Monday that expire Wednesday, every Wednesday that expire Friday and every Friday that expire Monday.
Spintwig does acknowledge substituting SPY for SPX, but he makes no other modifications. Could either ERN or Spintwig explicitly clarify this point?
Thanks again.
Glad to here it’s helpful!
Just to clarify, the puts are indeed M, W, F. The monthly data BigERN noted is the benchmark data, which I pulled from Portfolio Visualizer.
The specific caveat is that the backtest started on Feb 21 while the benchmark P/L value reflected the entire month’s performance and not the last week only. Similarly, the option strategy ran through June 5 while the benchmark data concluded at May 31.
Rest assured, the backtest evaluated over 300 two-to-three DTE trades that were opened exclusively Mon, Wed, Fri.
Does ORATs let you delta hedge? Would be interesting to see if you added in negative deltas at a certain threshold to try and avoid a catastrophic loss although I suspect the hedging would be a drag overall.
Not explicitly but one can “merge” multiple strategies. I find it more reliable to keep it simple and do the merging in my own tools.
I explored using long puts to hedge against catastrophic losses: https://spintwig.com/spy-long-put-45-dte-options-backtest-optimal-hedging/#Compound_Annual_Growth_Rate-2
TLDR:
-any benefit of the hedge is more than offset by the continuous cost of premium decay
-a basic asset allocation adjustment outperforms a comparable delta hedge strategy
-delta hedge works quite well when one “gets lucky” and times the drop; my crystal ball is hazy though. And if I had a crystal ball I would hedge my SPY portfolio by closing the position and parking funds in a high-yield online savings account (or if tax implications are too substantial, going short SPX or MES).
For what it’s worth, a simple hedge to cash earning ~1.35% at today’s rates (I use Vio Bank and FirstIB) is a guaranteed way to both lower delta risk and generate revenue from the hedge. Sounds like the best of both worlds to me. I’m not a fan of going to bonds since spreads can blow out until (if?) the fed steps in.
agree. And again, delta hedging is a good tool to avoid painful losses in negative-momentum markets when you have long DTE short-puts.
Delta hedging would be useful of you do a high-delta strategy with a long time to expiration. Hard to do over short horizons.
Misunderstanding: I merely noted that the benchmark returns for the SPY/IEF portfolio were based on monthly returns from PortfolioVisualizer. The option returns were obviously based on M/W/F returns.
It’s a valuable contribution to this topic. I am very glad ERN is pointing out that much of his balance sheet is not in cash but in risky assets and that does change things a bit, it’s an important disclosure. Sadly, it is difficult to come to a consensus on what the true risk basis really is in this strategy. There are many choices; is it Reg-T margin (20% initial), Portfolio Margin (much less) or full notional? Is it really apples-apples if you are using full notional across the board when there are various leverage gearings in effect? By contradistinction if you are using less than full notional for the puts should you not also reduce basis in the SPY-based portfolio (that would treat both portfolios with the same down-side assumption)? That said, still a great eye-opener for many folks who are new to this. I have been selling puts (though never such low delta) for decades and I can say the findings here are applicable to higher delta strategies as well (using no leverage or even under-allocation).
There are two things that might yield (pun intended) value for this convo.
1. Re-running the test using 30DTE.
2. Scrap Sharpe and look at risk measures with Sortino or Treynor (D.S. focus).
Thanks to Spintwig for the data ditch-digging!
While not an exact mirror of Big ERNs strategy, there is this: https://spintwig.com/spy-short-put-0-dte-leveraged-options-backtest/
It’s a 0 DTE strategy that seeks to open a position every trading day. Leverage is maxed at 5x (100% margin utilization). Actual DTE ranges are 0-3 (3 DTE for a position opened Friday with a Monday close).
You’ll find 5, 10, 16, 30 and 50D strategies compared against a SPY total return benchmark.
Great feedback on the risk measurements. I’ll keep that in mind for future studies.
Can someone comment on which brokerages, besides Interactive Brokers, allow the use of the conservative bond funds or ETFs to count toward your base margin requirements? Do other brokerages require that the funds be held in a money market where you can’t earn any yield thus reducing the success of this strategy? If others allow the use of bond funds or bond ETFs, which ones and is there anything special that needs to happen to enable that capability with them?
I’m pretty sure they all do. The major ones at least – Schwab, Vanguard, Fidelity, etc. I just checked BND on Schwab and the margin requirement is 30%, which is consistent with all their other broad index ETFs.
I’m not aware of a master list by the major brokerages (other than IBKR, here: https://www.interactivebrokers.com/en/index.php?f=5168&cntry=usa&tag=United%20States&ib_entity=hk&ln=&b=FTP&e=GBO) that lists all securities with special margin requirements, so a little footwork may be necessary.
I don’t really have much to add, only that I was very happy to see a collaboration on this topic between you two since your respective blog posts on the topic have been a valuable resource for me, and, that I want to get emails about future comments too 😀
Nice! 🙂
Newbie question. ETrade shows all the OTM strike prices with deltas as decimals less than one. For example .05, .07, .09, etc.
Would a 5 delta position be what E trade shows as “-.05” Delta? In other words 100 shares times the .05 is how you get the 5 delta?
I believe you’re correct there.
Correct. 0.05 is often called 5-delta.
This has nothing to do with the 100x contract muliplier. It also works for contracts with a 50x (ES) or 1000x (crude oil), etc.
It’s 0.05 = 5% = Delta, regardless of the multiplier
Great stuff guys!
It seems like a challenge to measure risk when the return distribution is as skewed as it is in this strategy. I’m assuming you are using standard deviation as your measure of risk? Both SD and sharp ratio both are valid when distributions are relatively normal. I’m not arguing against the strategy, I just would claim that comparing a levered portfolio with skewed returns against an un-levered portfolio with normal-ish returns is not 100% valid.
Yeah, skewness looks scary with this strategy.
But keep in mind that even very skewed distributions become “almost-Normal” when averaged over 12-13 option trades a month.
See “Central Limit Theorem”
(https://earlyretirementnow.com/2017/07/12/we-are-so-skewed/)
Great continuation of this series. One challenge on becoming “almost normal”:
The Central Limit Theorem assumes that each distribution is independent of all the others. Are you confident that this is the case with your 12-13 trades?
I guess that would be the case if you are a fully signed up member of the EMH but you also discuss CAPE and future returns in your SWR series which would lean to some form of mean reversion and thus some dependence between your trades?!
The CLT does not give you perfectly Normal returns if you average over 12-13 contracts. But your skewness and kurtosis will get a lot closer to their Normal values when you go from daily->weekly->monthly
I think the CAPE is irrelevant for the daily put writing. Recall, the CAPE “predicts” equity returns over a 10-year horizon. The expected return differences are not noticeable over a 1-2-day horizon.
I agree CAPE is irrelevant. However, I think, mean reversion is relevant. CLT assumes independence. I am not convinced you are making 12-13 independent trades and that weakens the argument that you are approaching Normal.
We’re splitting hairs here. My trades 3x a week may not be perfectly independent. But they are pretty close. If you lose money on the Wednesday options, IV goes up and you’re selling way out of the money. It’s like a new deck of cards.
Now, is that enough independence for a stats Ph.D.? Probably not. The sample size of 12-13 per month is too low as well. But what matters here is that I get much closer to Normality than with stock returns. Never completely reach N(mu,sigma) but close enough for my purposes.
This is excellent for assessing a strategy’s performance! Thanks for all of this data (particularly maximum drawdown and Sharpe ratio vs. a few benchmarks).
What leveraged closed-end municipal bond funds do you like?
I got Nuveen’s: NMZ, NVG, NZF
And a few other: BAF, BTA, IQI, MEN, MFT, MUH.
Question for the group: Do you guys ever roll losses with the same strike price for higher premium?
Never.
See Section “Why not just keep selling puts at the last strike at which you lost money?” in the previous post on the topic (https://earlyretirementnow.com/2020/06/10/passive-income-through-option-writing-part-4/)
I have had put-selling as a core strategy for nearly 20 years. I would push back against the wholesale dismissal of rolling for duration at the same strike. My 20-year real world experience would show that there is a fair amount of potential in the strategy. So in general it cannot be dismissed. Much has to do with capital available, how much equity risk you have on and certainly if you have any leverage gearing. In this last case of managing a levered book I would agree one must be very cautious…very!. As regards the example supplied in the link ERN posted above I have another example of puts sold at both the 322 line and the 324 (mid February!!!, the mid-March marks were really something :O ) and those positions have been rolled and maintained to this day. I believe at Friday’s close the 322 was positive p/l and the 324 was close. There is much more to this topic but but having many, many years of trading many strategies I can say ruling for duration with short puts can be a test of fortitude but should not be dismissed wholesale.. there are just so many other factors that make the strategy useful or harmful. At the end of the day it’s all about being able to manage how much long ∆ you have during various market movements.
.02
How much extrinsic have you collected from rolling these deep ITM puts? At a certain point, isn’t it better to just buy and hold? Or perhaps lower your strike price so that you can collect extrinsic? If you roll deep ITM puts, you miss the chance to take advantage of high volatility as an option seller. But I do see the advantage of avoiding whipsaws.
If the puts are really deep ITM you’ll have very little time value and it’s all intrinsic value. You have essentially a leveraged long-equity portfolio.
It’s true that you quickly recover in a whipsaw scenario. But as a retiree I’m more concerned about the opposite: the negative momentum scenario. That’s bad for Sequence Risk!
True DITM puts suffer from premium anemia but with the vol levels as they were there was still some juice in the rolls (see response to James below). In my case I absolutely was NOT levered long. I still had large un-allocated cash throughout the whole period. I was looking to get bigger and actually looking for an opportunity to apply some gearing but the market had other ideas…. as it often does, did anyone really have the rally-from-hell in their forward view. As regards SORR the un-allocated cash levels speak to that.
@ James,
The below is the data on those two spicy 322 and 324 SPY puts sold in the third week of February.
As I mentioned in a comment below (answering an ERN comment) these blog exchanges often suffer from a lack of context or clarifying detail so I am going to supply some here. In my personal style of trading I have yet to use any leverage gearing, most often I am significantly under-allocated on a full notional : free cash (or CE) basis. A number of reasons for this including SOR management and a preference for getting paid better during elevated opportunity. In the Jan-early Feb time-frame I was holding very little equity risk in my multiple derivatives portfolios (I run several totaling some millions in the aggregate). In the days before the STO of the SPY 324p (the first of the two) the VIX was in the 14 range and not conditions were not attractive for selling much premium. On Feb 21 the fix had risen in excess of 20% to the 17 level which, while not a super attractive proposition it ,was worthy of what I like to call a bit of ‘chumming’ so I fed out 1-lot at 324 on Friday the 21st. Monday the 24th the VIX hit 20 which is my own personal threshold for opening positions in true size.. BUT… again with what was happening in the world I still only opened another 1-lot at the 322 strike. In other less precarious circumstances I would have been bigger. So this is how I wound up with the two short puts discussed. I want to be clear that while they are real trades they in now way represent a meaningful allocation in my case, not even close. This is an important point because as I said in my original post the benefit or harm in using a “roll-for-credits” approach is very context sensitive and depends on many factors. To be totally and completely honest what happened with hose 2 rascals was exactly what I had hoped for…. that the increase in volatility would continue and that those two puts would take major heat but ONLY because that heat would come with much better conditions to deploy cash. Within a few weeks indeed my position sizing did increase meaningfully with may short term (sometimes one-day) round-trip closes (all for money). I would have to research how quickly the negative marks on those original two puts were made up for by profitable closed puts that followed but I do recall it was a no more than a matter a week or two owing to the trade size and opportunity in the weeks to follow (I did supply some portfolio performance detail in my other response below). And finally, I want to say again that if you are running a levered book or even a close to fully allocated book, rolling for credits can have issues that might have you land-locked so I would advise anyone to really have some experience to know better where to follow that path. Certainly in a levered book you can take ERNs warning more to heart. All that said, here is the trade info you asked for on the SPY 324 & 322 puts (still opened and working).
Your question about strike adjustment for more premium is relevant but I was only responding to the specific question @Karl asked and ERN’s response. As regards your comment about rolling DITM puts at the cost of foregone opportunity you are absolutely seeing the trade-off correctly which is why I took some time to offer come clarifying context on how risk capacity comes in to play via position sizing and timing of tranche initiation.
I’m happy to supply detail from actual trade tickets if ERN can instruct on how to post.
SPY 324 put: Opened on Feb 21 with a current B.E. of 312.69.
Credits (including originating STO: 3.05, 3.90, 4.36.
SPY 322 put: Opened on Feb 24 with a current B.E. of 307.35
Credits (including originating STO: 6.08, 2.75, 2.02 3.80
I like your approach as an alternative to buy and hold. You are attempting to capture almost all of the intrinsic gains of the SP500 while adding some extrinsic on the side. I like it a bit better than always selling OTM options. although the goals of each strategy are different.
What I wonder, however, is whether the strategy can be improved with some simple rules. If the market drops 20%, perhaps it would be better to lower the strike price of your puts a bit? (Or let’s say the market drops 80% as a more extreme example.) If the market moves sideways for a while after the drop, you are not going to make much money rolling these deep ITM puts. On the other hand, if you lower your strike, you will capture more extrinsic. I was thinking of having a rule where you’d sell puts at the last strike where you lost money or 10% ITM, whichever is lower. That increases the extrinsic gains but also keeps low the odds that your short put will expire OTM, which is what we are trying to avoid (since if it expires OTM, we missed some extrinsic).
Well, you make my point better than I could have ever made it myself. Your positions just barely made it back to a profit, and all with a lot of volatility and huge drawdowns in between.
My put strategy had recovered the Feb losses on March 18. Now very solidly in the plus. All with less volatility and less severe drawdowns. Case closed; rolling the losses is a bad idea. And you were lucky that the market swung back quickly. You could have been rolling that loss for the next 3-5 years! 🙂
So, I don’t make these statements very often because in (personal) finance there are only very few absolute and universal truths. But in this instance I’d like to issue a “wholesale dismissal” of “rolling” the losses. It’s just a bad idea!
I have supplied some info in my responses above and below. I believe my two 300+ strike puts had been compensated for (and more) in a couple weeks maximum as well since a 2-lot is SPY is gum money my aggregate portfolio size. The bonus for all your readers here is that those two puts have provided some real fun observations and energized exchanges through some extremely rare trading times. Due to the actual allocations in my portfolio vol and draw-downs were actually very tame. But again, that is because the extrapolation of position size from one strategy to the other was not the case… by a large degree.
So I think I need to reiterate that the point I made about being extremely careful about rolling for credits WITH a leveraged book. . . . “…In this last case of managing a levered book I would agree one must be very cautious…very!” I can disclose factually that since 2011 (when I started my early retirement process and ramped up the trading significanly) I have never exited a campaign of strike-static short puts that, included rolling for credits, at a net loss zero times. I believe the longest duration of rolling was in 2011 where some early August puts finally closed profitably (after rolls) in early November so that was 3 months of holding somewhat full long Spooz ∆ in those tranches. From Aug 2011 to now that 3 month stretch was the longest time I have had to roll for duration in order to close the series of trades (static strike) for a profit. As regards the potential of rolling for 305 years I TOTALL AGREE that at the time that the markets dislocated the prospect of a 3-5 year period before break-even was on the table, I had actually viewed them that way in mid-march when the marks were clearly horrible. The said, I control that nasty prospect with trade size and those particular positions are very small given the (high) market and (low) volatility levels at a the time. Sadly these blog exchanges lack much context of how various strategies are actually being managed but the fact is that it is rare for me to be fully allocated (cash = full notional, and never levered) and I think it you can easily believe that with what actually happened in the past months that if my size on the mid Febs was very small (it was) and I had a lot of free cash into the down leg that got deployed under extremely favorable vol conditions I did) in the aggregate the (my) short put portfolio performed extremely well given the amount of premium old starting early March. Again, I readily agreed that with a levered book (as you run) rolling for credits is not the best idea, actually if you want the statistics to deliver on schedule you must mechanically manage as you advise. I believe I said as much concerning your particular strategy. So I’ll summarize a few things for clarity.
1. .”….and certainly if you have any leverage gearing. In this last case of managing a levered book I would agree one must be very cautious…very!” (so we are in total agreement there
2. In 20+ years (1997 to present) I have NEVER (not once) had to close a continuos SERIES of strike-static short puts at a net loss. And more importantly the duration of the problematic trade has not been been been more than several months. This includes many thousands of trades from mid 20011 (partial retirement) to now. Thats many years of real dollar experience. Again, I would never do that with any real leverage gearing but my particular situation has been much different where I have preferred to be under allocated most of the time and premium into opportunity.
3. Again from my original post: ” . . . rolling for duration with short puts can be a test of fortitude but should not be dismissed wholesale.. there are just so many other factors that make the strategy useful or harmful. At the end of the day it’s all about being able to manage how much long ∆ you have during various market movements.”
4. Finally, while it has not been specifically mentioned It is worth disclosing that I absolutely DO NOT advise the same approach for short calls. It is very common for me to have unbalanced strangles on and I am am always lighter (most often much lighter) on the short calls then the short puts and the short call are never handled the same way.
5. As regards you observation: “…Your positions just barely made it back to a profit, and all with a lot of volatility and huge drawdowns in between.” Again, this blog exchange prohibits much needed context/detail. It is obviously true the marks on those 322 and 324 (SPY) rascals were true bad (mid March) but again, we are discussing two very different approaches where (your) strategy is levered and mine is under allocated much of the time with plenty of balance sheet on the ready for better times (20+ VIX). That being the case in my particular situation the portfolio draw downs were not bad at all.
@James (above) asks for some info on rolling credits (particularly on the 300+ strikes) so I will take a few minutes later and gladly supply some data but for the moment I will supply the following actual data (for context):
From mid-Feb to now I have closed net $70k of put premium on an average of less than $1MM full notional risk. During the fury of March and April full notional risk was between $600k and $800k until early May when I crossed the $1MM risk (again full notional). Those are the numbers.
Wow, you are passionate about this topic!
We seem to agree that your loss rolling is a terrible idea for leveraged portfolios.
I would go further and argue that it’s also a terrible idea for portfolios without leverage.
You seem to be playing with two different time frames: 1997-2020 and 2011-2020. If you argue that your loss rolling never created an extended deep loss during 2011-2020 I believe you 100%. We never had an extended S&P500 drawdown during that time span.
If you make the same claim for 1997-2020 I call BS because if you had suffered a loss at an S&P level of somewhere around 1400 or 1500 you’d have to wait several years until you recovered from that. Not several months but several years. So, please for the record please confirm that your experience with the loss rolling you described here refers ONLY to 2011-2020, not 1997-2020.
In any case, you’re totally free to do with your portfolio whatever you want. But I find the return profile of your approach not very appetizing and I want my readers to know that this is a very inferior approach.
You’d have long drawdowns in a 2001 or 2008 scenario. It defeats the whole purpose of the put writing strategy, the idea that in a downward trending equity market you only lose once in the beginning but then make use of the higher IV and you can already claw back while the market keeps dropping. All these beautiful risk characteristics go out the window with your approach.
There’s plenty of research on this by the way:
“Covered Calls Uncovered” (https://www.cfainstitute.org/en/research/financial-analysts-journal/2015/covered-calls-uncovered). From the abstract: “The short volatility exposure realized a Sharpe ratio of nearly 1.0 but contributed only 10% of the risk. The equity reversal exposure contributed approximately 25% of the risk but provided little return in exchange.”
You are doubling up on the “reversal exposure” because you increase your equity delta after a big drop. That’s exactly the type of risk that is not compensated very well. What you want to do is to keep the delta as constant as possible (that portion has a Sharpe of about 1.0). And that’s exactly what I do. I readjust the delta to 0.05 every 1-2 trading days.
“Volatility-Managed Portfolios” (https://www.dropbox.com/s/4y24nnab001bd0l/JF_PublishedVersion_Moreira_Muir_2017.pdf?dl=0)
From the abstract: “Managed portfolios that take less risk when volatility is high produce large alphas, increase Sharpe ratios, and produce large utility gains for mean-variance investors.”
Again, your approach does the exact opposite: take on MORE equity risk during chaotic times.
So, long story short: The return patterns during 2020, in fact during the whole last 20 years show that you don’t want to do what you’re proposing. Your approach might have good AVERAGE returns, but the risk characteristics (vol, drawdowns, skewness, Sortino, etc.) will all look terrible. It’s a sequence risk nightmare.
Yes the main point was focused on the 2011-2020 period. The earlier period had put selling but there were periods along the way where trading activity slowed too greatly to be instructive hence the calling out of two periods. Also, as a matter of sheer luck I was almost out of the market entirely from spring of 2007 to Jan. 2009 as I was preparing for early retirement and liquidating capital to start the build of custom home mandated that de-risking. That said, I did sell some puts (very small positions) from time to time during the storm and I did not incur losses then as the volatility was so elevated and the saw-tooth pattern so wide (on the way down) that holding periods were extremely short before closing for money but I admit those trades were too few to be instructive at all. I don’t believe I discussed my process in enough detail for the comments to hold. The main thing is that I am never levered long and my days at risk are much lower than the studies you reference or your assumptions allow for nor do either recognize the pattern of trance initiation and closing rules. Additionally, if I am rarely fully allocated and often less than 50% allocated (always on a full notional value) I would never be ‘levered long’. I think this may been a point of confusion. Finally, I can see where your main objections are to the volatility aspects and the risk metrics derived from the portfolio’s volatility, This brings up the debate about the extent to which portfolio volatility serves as the proxy for risk. The fact is that volatility in and of itself is not risk, rather volatility is only a particular type of POTENTIAL risk informed largely by current and future liquidity requirements. Volatility becomes less and less important as liquidity becomes more and more secure (both current and forward liquidity). This is exactly my situation. I have, and keep, current cash needs well covered (high cash on balance sheet and several sources of future cash flows from others non-investment related sources). Investors in situations like mine can be far less concerned with portfolio volatility and turn to the main goal of being profitable to the greatest extent possible.
Again, I never advocated for the use of ‘rolling for credits/duration’ as core constiutent of a trading approach I was only answering another posters simple question about “ever rolling strikes”. The other comments I made were to supply context.
OK, thanks for clarifying.
We obviously think very differently about risk and volatility. I’ll just leave it at that.
Thanks BigERN!! Your blog has been extremely influential on learning about sequence of risk and avoiding the yield shield strategy which I was starting to implement before I discover your writings.
As a reader it would be appreciated if you could write a deep dive article on your private real estate investments. How tax efficient are they? How are they performing given the hit the economy has taken due to COVID? Any lessons learned?
Are you planning to deploy more capital to this strategy?
Keep up the amazing work and stay safe out there!
Hah, good point. It’s on my to-do list.
Short story: rentals showed slight signs of higher delinquencies. But we expect to get back to normal soon. I will deploy more money into the funds. But slowly and over time.
Hi Spintwig,
I wend down the rabbit hole of reading through your blog.
I noticed that in the comments you have stopped trading SPY options as a simple buy and hold outperforms.
You backtesting of Karsten’s method seems to show it outperforming buy and hold if I’m interpreting it correctly.
Does this change your approach at all? Would you continue with Buy and Hold or go back to options?
Great question!
As new research is performed new insights are gained and I’ve definitely considered resuming trading.
However, for now I remain a passive investor. I have too much equity exposure to implement a 0-3 DTE short put strategy. If I was starting with all cash or had no unrealized capital gains I’d go back to options.
Thanks for the reply Spintwig. 🙂
You’re definitely a true scientist in that you’re able to let the data/evidence guide you.
Thanks for your hard work.
Outprforms by what measure? Return or Sharpe Ratio?
I can’t seem to find it on hand easily but in the comments of Spintwig’s blog, they mentioned that they stopped trading options because the backtest showed that a simple buy and hold of SPY outperformed SPY options trading.
I don’t want to put words into Spintwig’s mouth because I can’t remember 100% but if I had to pick one, I think it was higher return?
Maybe Spintwig can clarify?
I’ve found it but I’m not sure how to link specifically to one comment so here’s the screenshot.
https://imgur.com/ueWQlPP
I guess I was putting words in their mouth. It doesn’t say outperform but that it’s better to buy and hold in all scenarios.
But it does seem like the back test of your method has changed their minds. 🙂
“…the data suggests I’m better off buying and holding in nearly all scenarios.”
That was my reason as to why I stopped trading options in fall 2019.
The question / comment was dated April 11 2020 which was before I started exploring “ultra-short” (0-3 DTE) option strategies and interpreting their results.
Yeah sorry Spintwig if I misrepresented what you said. I was going off my memory at the time.
Interesting that with quarterly and short week that you can trade all four days. I’m curious if quarterly expectations are any different than the weeklies.
Also curious how low the strikes will be to achieve $3 for the week.
Meant expiration
Not sure what you mean by quarterly expiration. You mean trading with a 3M to expiration? That’s too much gamma risk for me.
In March, I’ve sold some puts 20+% out of the money. That’s over 1-2 trading days. Ans for even a bit more than $3 revenue per week.
When vol is really low you’ll sometimes have to sell only 1.5-2% OTM. Which feels almost scarier that trading during March 2020. 🙂
Another post for the session: I have no idea what this guy is talking about
Likewise. 🙂
Sorry for confusion. This week of 6/29 due to timing of holiday has four unique expiration. The weeklies (M, W, Th) and a quarterly that expires tomorrow (Tu).
Just found it interesting, and opens the ability for some extra trades.
I know! I love it! I’m doing some extra trades this week!
Cheers!
Likewise!
Karsten, at some point you mentioned you were able to achieve within 0.1% tracking with the index in 2019 (SPY was 31%). Did you do that by selling 1.00cr per contract or were you going up higher on deltas? Were you rolling up aggressively when premium dipped below 50% of collected. What was your trading strategy to achieve this?
Pure coincidence. The P&L over/under the S&P went wild during the year and I just finished right about where the index did. About 31%+, 20% due to the fixed income portfolio and 11% due to options. But by no means would I have a 0.1% tracking error every month! 🙂
Even with my level of knowledge still cant believe how they fleeced me, compared to what I have been reading about people who have lost more. Iqoptions has to be the worst and how they can lie is unbelievable making me loose my hard earned 120k USD was astonishing. After a year constant turmoil I was able to recover my full investment from Iqoptions so much thanks and gratitude Geminihacks -.- com they were so professional and true to their word thank you so much. If you lost money trading Binary options reach out to Geminihacks -.- com
There’s nothing like earning money without doing much work for it. Getting that stimulus check was good. I think that earning on passive is everyone’s dream …
Putting the stimulus check into a passive ETF? That’s double-passive! Awesome! 🙂
I think the strategy is good for active traders, but for folks that don’t want to be glued to the screen, it’s too much work. Also not too fond of using too much leverage, it would negatively impact returns in long, multi-year bear markets (from what I saw, the strategy was only tested on a very short lived bear).
Perhaps a more profitable approach is to combine the put selling with a market filter.
I’m not glued to the screen. I can do my trades 3x a week in 2-3 minutes each. I’ve done my Wednesday trades on one single ski lift ride.
Excellent articles and thanks for sharing. Question, have you tried farther expiration dates, so you can lower the strike prices, increase premiums and reduce number of trades and maybe hedge against a big market declines buying puts far out of the money?
I started with longer DTE options and I’ve moved shorter and now as short as possible. I prefer the maximum # of gambles possible to make the Central Limit Theorem work for me. See Part 3 of the series for the rationale.
I feel obligated to let everyone who follows this know that Spintwig has just done it again, with another high-quality study. He tests with 5x leverage. What I like to do is “stress test” my portfolio to see what my buying power reduction would be with a 20% drop in the underlying (in the TOS platform). That gets me closer to BigERN’s 2.5x leverage. If anyone has a better idea for avoiding margin calls, I am always open for suggestions.
Spintwig’s new study sells to open a new position every day, so it’s hard to make a direct comparison with the study on this page of BigERN’s method. But it strongly suggests to me that using the BigERN 2.5x leverage and the BigERN sell-to-open on MWF (so that I am using my margin the same amount every day of the week) would do better at 16D instead of 2-10D. Of course, I don’t have the data, so I could be wrong.
https://spintwig.com/spy-short-put-0-7-and-45-dte-leveraged-options-backtest/#Premium_Capture
OK. I just did a little backtest for SPX puts 19 Feb to 25 Mar 2020. It lost about $25,000. The starting margin would be about $90,000. So much for running the BigERN method at 16D.
Yeah, too much Delta! Would have whipsawed you in March 2020! 🙂
Nice! Spintwig is on the top of his game for sure! 🙂
Appreciate the kind words! 🙂
Speaking of stress tests…
Not sure if anyone has any ideas how to get the data short of being a CBOE or clearing institution insider but I’d love to explore and generate insights on assignment events.
One of the limitations of a backtest [on American options] is that it assumes assignment does not occur. I’m curious how far ITM a position must go, on average, before the option seller has “x” % chance of being assigned.
Mostly an issue for options on dividend-paying individual stocks or ETFs. There might be a rationale to exercise a call option right before the ex-dividend date.
But for index options with a more gradual and steady div yield I’d suspect that all American options are held right to expiration.
Hi BigErn,
Thank you for your great work. As a seller of put options you are essentially selling insurance and it seems to be profitable until now. Do you ever expect this strategy to stop working, in the sense that people are willing to pay less for insurance? Could you detect this situation in advance?
What bothers me is that this strategy is already known for quite long, there is even a PUT index by CBOE. Why are hedge funds etc. not using the strategy, driving the options premiums lower? In addition, Spintwig already showed that the 45 DTE is not working…
Are there other markets where people are willing to pay more for insurance and sellling put options could be more profitable?
Selling insurance ahs been around for hundreds (thousands?) of years. It will likely not go away.
I’m more afraid that my mental capacity will go away eventually. If so, I’m shifting back to equity index funds. 🙂
Not sure what you mean by 45 DTE not working. Risk-adjusted returns of option selling are normally superior to just the plain market beta. Just the plain returns may certainly underperform the index.
Hedge funds are using this already.
I was referring to the backtest below, which showed 45DTE underperforming the last two years.
https://spintwig.com/spy-short-put-0-7-and-45-dte-leveraged-options-backtest/
I also found a global put write index:
https://www.nb.com/en/global/insights/putwrite-goes-global
It seems that this strategy also holds for other markets, although the backtest above does not include the Covid crash.
Had no idea there was an ex-US put-write index.
Can confirm – cash-secured puts on EEM outperformed the underlying with regard to both risk-adjusted and total return:
https://spintwig.com/eem-short-put-options-backtest-results/
Even more so when leverage is applied:
https://spintwig.com/eem-short-put-45-dte-leveraged-options-backtest/
Nice! EEM (iShares Emerging Market) has more vol and looks like a good candidate for this strategy!
I’m not surprised. The vol premium exists in many markets. Not just U.S. stocks, but also non-U.S. And also other asset classes (Bonds, currencies, commodities)
Hi ERN/Karsten, quick question for you. I am getting started with Interactive Brokers and one thing I noticed is that it looks like all the market data I am receiving from them is on a time delay. They are offering market data subscription services for real time data. Two questions if you would be so kind:
1) Do you subscribe to these services (and if so, which ones)?
and
2) Is there a source for real time data that doesn’t involve subscriptions and if so is it worth the trouble to use an outside source when trading in IB?
For options data you’ll need the following data subscription:
“OPRA Top of Book (L1) (US Option Exchanges)”
$1.50 per month for non-professional accounts.
https://www.interactivebrokers.com/en/index.php?f=14193
Have you traded or backtested adding any risk management to this 2DTE puts with some 2x – 3x stops ? to avoid that those .5% loosing trades whipe out months of profits.
Yes – the stop loss mechanic consistently underperforms the majority of the time. See: https://spintwig.com/spy-short-put-strategy-performance/#Sharpe_Ratio-2
Stop losses are not really risk management for options though. The options price can blow past the stop loss price and lock in losses significantly greater than the stop loss would suggest.
Risk management would be performed at order entry via 1) position sizing (number of contracts), 2) delta (lower delta target is less risky) and 3) purchasing a protective put (make the trade a spread).
For the 2-3 dte i understand size would be 1 SPY contract for every 30k in the account.?
at 5 delta , buying a protective put as a spread would make no sense would need to be a large spread for so little premium . naked would be the way to go . so size
Assuming 1x leverage (cash secured) and the strike is 300, yes, that would be 30k for a single put position.
Almost 2 months in and good so far…dodging early June drop and BAF up 6+% helps.
My SPX trades at TD Ameritrade seem to have -60k impact on buying power (One 3300 contract when index is 3373), which prevents me from writing new contracts at 1545 EST and letting old ones expire at 1600 EST. Not a problem, since I write a vertical one day and naked the next sale.
Confession: Got greedy today and added an extra put at 3310 (Fri expire) to yesterdays sale of 3295 (Friday expire). Hope I don’t get burned.
Any FB group or location where people share their put sales data?
Wow, thanks for sharing. Glad you have success so far.
I haven’t seen much discussion on FB or other forums on this topic. Any suggestions from other readers?
I’m planning to use this strategy but I’m starting from a much smaller scale which would probably require about 10 SPY contracts or a single SPX contract at first. I’m inclined to avoid SPX until I can purchase multiple contracts, allowing me to place separate orders throughout the day, but transactions costs seem like a significant issue.
If options cost $0.65 per contract:
SPY: $0.65 x 10 contracts x 3 trading days x 52 weeks = $1,014.00
SPX: $0.65 x 1 contract x 3 trading days x 52 weeks = $101.40
In an account with $150,000 targeting 5% p.a. ($7,500) then relative expense ratios are approximately:
SPY: $1,014 / $7,500 = 13.52%
SPX: $101.40 / $7,500 = 1.352%
The expense ratio gets even crazier for smaller account balances. These calculations also completely ignore bid/ask spreads and margin costs. Speaking of which, does IB charge interest on these collateralized margin balances?
Expenses probably deserves a dedicated post in this series. In the mean time, do you think it’s worth trading contracts once per week with weekly DTE instead of 3x per week with the shortest DTE? Perhaps there’s a specific broker or pricing plan that would be more appropriate?
I think the expense should be percent of account balance to align with traditional expense ratios.
I do wonder what you do ask account transitions between 1 SPX (say 125k) and 2 SPX (say 250k) contracts. Do I just accept lower leverage or add XSP?
Slight adjustment to your numbers…the 5% is on whole leveraged up balance, so for today it is 5% (or 5.5%) of 337,000, which is 17k or $325 per week. Then you expect ~50% losses and you are down to 8.5k.
Ideally you get some gain on margin cash, so 4% on the 150k. Total gain of 14.5k or close to 10% on your 150k.
Good call on the expense ratios! Options commissions for SPY might cost around 0.7% and SPX only 0.07% given that example with 150K balance. It’s great that the ratio scales down by an order of magnitude once SPX becomes more viable.
As you described, there’s a significant return so it’s still worth doing M/W/F trades with SPY despite the costs. I’ll have to try various adjustments (DTE, leverage, SPY vs. SPX, etc.) to see if there’s a more optimal combination to control costs without introducing additional risk that isn’t compensated for.
Also good question about how to fill in the gaps between SPX contracts. I’ll probably end up combining SPX + SPY to fully utilize the intended amount of margin cash. XSP could work too, especially for Canadians.
You’re right, expenses will be a concern for SPY options. I pay about $1.25 per SPX contract. So if I target $1.00 in income for a 2-day trade, I should target $1.0125 average sale price for the puts. And again, that’s the sale price (i.e., factoring in the b/a/ spread).
I’ve traded weekly options with Friday expiration for many years before going to M/W/F. It works but it’s a bit scary. A lot more can go wrong in 7 days!
I’m not charged margin interest in my current account setup.
I started yesterday and have a few updates:
I believe you mentioned this already but wanted to share again just in case others go down this path. One major downside to SPY is that these options settle in shares of SPY instead of cash. You could suddenly own a lot more S&P 500 than you expected without much warning. I’m not sure exactly what the best strategy is to deal with this yet, perhaps IBKR has an automated way to liquidate (other than a margin call of course!) to keep risk under control.
A separate issue I discovered involves partial execution. If you sell more than 1 contract at a time, the broker may split the order into separate executions, effectively producing greater commissions. This can make a big difference when selling many SPY contracts. One possible solution is to always set the “All or None” attribute on orders to prevent partial executions.
Lastly, the one thing I haven’t yet figured out is how to safely sell new contracts when existing contracts are outstanding. Delaying until deltas are extremely low on existing contracts gives up quite a bit of time value premia on new contracts. I’m not sure what to do about this yet. I thought of maybe extending DTE so all the contracts don’t expire at the same time: M -> F, W -> M, F -> W. That way new contracts would only temporarily increase leverage by 4/3x instead of 2x. The downside: longer DTE increases overall sequence risk.
After reading lots of other comments in this series I’ve realized that XSP is specifically designed to serve the same purpose as SPY (1/10 SPX) without all the drawbacks. It has cash settlement, 60/40 tax treatment, European exercise, etc. so I’m definitely using XSP from now on.
http://www.cboe.com/products/stock-index-options-spx-rut-msci-ftse/s-p-500-index-options/mini-spx-index-options-xsp
Yeah, they do cash settlement. But the commissions are painfully high.
I don’t like “Physical settlement” for the exat reason you mention. Cash settlement is much easier.
I never worry about partial execution. For SPX contracts the commission is almost exactly linear in the # of contracts.
You can definitely do longer DTE. But I still prefer the shortest possible DTEto maximize the # of independent bets I take over a given time window.
Dear all,
I see everybody is using SPY/SPX. However, have you considered other indexes? What I see on CBOE is that SPY has done great, emerging market did ok, but EAFE did terrible (still below 2008 value).
Wouldn’t it be prudent to diversify and create a global put write strategy? It could be that the next 10 years SPY will perform terrible and EAFE will do great.
What I notice is that option premiums for EEM (emerging marktets) and EFA (EAFE) are higher, probably compensating for the higher risks.
http://www.cboe.com/products/strategy-benchmark-indexes/putwrite-indexes
I haven’t used other indexes. I like the simplicity and liquidity of the SPX (and previously ES futures options). But I know lots of people do this with different underlyings. Including the whole palette of ETFs for all sorts of different indexes and even other asset classes (bonds, commodities).
Hi ERN,
As I’m starting to learn this, let’s see if this is correct:
– this afternoon Friday Aug. 28 at 2:45pm eastern time, .SPX ~ 3497.79
– .SPX Put Monday Aug. 31 for strike of 3,250 (~ -7% decline from Friday afternoon) quote was Bid 0.10 Ask 0.20
– if I had sold 1 .SPX 3,250 contract (100x multiplier) at say 0.15, i would have earned $15 premium
– if unfortunately .SPX were to decline by -10% by end of Monday Aug. 31 to ~3,148 (unlikely but not impossible)
– then my loss in that case would be $314,800 – $325,000 = ($10,200) offset by the $15 premium I earned.
– is that correct?
Yep. If SPX drops 10% on Monday morning and then fully recovers by Monday afternoon, you would also escape unscathed because SPX contracts can’t be exercised prior to expiration.
PS a 3250 strike is quite deep out of the money. The delta on that contract is -0.002 as I write, which is very low. Generally you’ll want to aim for around -0.05 if you want to earn meaningful premium. Micro deltas can pay well during times of extreme volatility, but at the moment you’re only getting $15.
Good point. That 3250 put had way too little premium. I normally target 0.50 to 1.00 premium over the weekend.
That sounds correct, yes.
Though I don’t see a 10% decline over the weekend when the VIX is in the 20s on Friday.
New subscriber. Thanks for the wealth of material covered here and also thanks to spintwig for the analysis of this strategy!
You bet, Rob! Thanks for the feedback! 🙂
Cheers! Holler if you have any data / methodology questions or backtest requests.
Confused by a technicality. DTE 3 trades are entered M, W & F at 3:46 (or perhaps earlier) and held until expiration. Since expiration is at 4 pm isn’t there a small 14 minute window each of these days where the old trade and the new one are both active? If so what is the impact on margin? If I try this method it would be in an IRA using cash secured puts. Would I need twice the cash to accommodate the small overlap (if it exists)? TIA
In practice, yes, it’s possible a small overlap could exist. It would require double the cash in order to remain cash secured for those 14 minutes (or would require one to exit the soon-to-expire position then open a new one).
The backtest methodology evaluates the portfolio once daily at the end of the day. Thus, the soon-to-expire position will have expired leaving only the new position in the account. The end-of-day portfolio state is a single open position; intraday overlap is not captured.
Any comment on this regarding the fact that in IRA, there will be no leverage? Based on what I can read, using leverage is really the only edge to get that extra alpha, isn’t it?
The broker will likely impose structural limitations (read: block opening of new positions) that ensure the account doesn’t become leveraged. In practice, one can let the position expire then open a new one first thing the next morning.
Leverage will amplify alpha as well as any lack of alpha.
Right, I remember reading something here that the real only edge we could get to beat the market and get some extra alpha is one possible through leverage so that’s why I was mentioning that maybe using this in an IRA may not be worth the time versus buy and hold (besides possibly reducing risk/volatility/drawdowns).
Maybe that’s too strict. I think the option writing has some excess return because you write insurance on the exact risk that’s creating the risk premium in stocks, i.e., the downside risk.
I would likely not use this in an IRA. If you’re bothered by taxes, simply scale up your leverage.
This is such a great response to the tax concern. Simple, elegant.
Thx! 🙂
To make the discussion of our option topic a little easier, I’ve added a Forum page to my blog. One subtopic is about options. Hope this helps!
https://earlyretirementnow.com/forum/
That’s a great idea! Unfortunately I’m having problems logging in. I tried with my current wordpress account and also created a brand new one, but was unable to log in.
Arghh, there’s a problem with the WP signup. Not sure when this will be fixed. Let me inquire and get update you later! 🙂
Should be working now! 🙂
I’ve joined up! 🙂
Awesome! 🙂
Neat! Thanks BigERN
Are there good reasons not to sell a call along with the put? It may be an illusion but it seems like a strangle could increase P/L without a dramatic impact on risk.
On paper it makes sense to sell both a call and put / strangle and make premium both ways. In practice the calls lose money (uncovered) or otherwise drag on portfolio performance (covered).
Specifically, short calls at the 45-DTE duration are either unprofitable or slightly profitable: https://spintwig.com/spy-short-call-45-dte-leveraged-options-backtest/#Discussion. In other words, it’s more profitable to skip the trade entirely.
At the 0-DTE duration performance is a little better: https://spintwig.com/spy-short-call-0-dte-cash-secured-options-backtest/. A leveraged version of this study is anticipated to be published Friday.
Also, there’s the “unlimited” risk characteristic (assuming it’s an uncovered call). Someone in [early] retirement may (should?) want to avoid such a risk profile.
Excellent analysis! Cash secured 0-DTE were profitable with the best risk adjusted returns at 5D. That’s what I’m considering to add onto the puts described in this series. I plan to use a similar leverage ratio as well around 2.25x. I look forward to that next study!
The unlimited risk characteristic does sound quite scary but I suspect it’s not a material concern on 0-DTE index contracts with a reasonable leverage ratio. I’ll seek out more research on that to make sure though!
Well, if the market snaps back you lose on the call. This strategy would have potentially hurt you during the recovery in 2020 (depending on how far OTM the calls had been).
Hi BigERN, this is some great stuff. I have two questions about your use of margin.
1. You say you are 2-2.5 times leveraged. Am I correct in understanding that this means each SPX spread you sell has a capital requirement that is 2-2.5 times lower than its width? For example, a 3500/3400 put spread will deduct 4,000 to 5,000 from your total options buying power.
2. You also say that margin cash is invested in bonds. Does this mean you borrow margin cash (@ an interest rate) to have them sit in a bond? If so, wouldn’t this be a loss?
Thanks for your informative posts!
1: I calculate the total exposure for the case the market were to go to zero. Example: a put with strike 3000 can lose $300,000. With a leverage of 2.5x I keep $120,000 in capital in my account.
2: No, I only invest my own capital in the bond market. I don’t borrow to invest more.
Very cool. I’m still struggling to understand why naked puts is so much better than 100 pt spreads. Can you explain?
I have reg t margins and can’t afford a single naked SPX put, but can do several 100 pt wide spreads. I suppose with portfolio margin (which I assume you have), you can do 2.5x naked puts? How does that work with your broker?
As far as I can tell, the only advantage to naked is that you can collect more premium due to not having to purchase the long leg. But spreads tie up less capital (10k at 100 pt width vs 120k at 2.5x leverage) therefore you can put more of them up. Why naked then? It doesn’t make much sense to me.
I have the “portfolio margin” setup and keep way more margin.
I wouldn’t say that 100pt spreads are inferior. There are pros and cons.
Cons:
you generate less income because you have to buy the deep-OTM put
even with my naked puts, I’ve never lost more than 100pts
Pros:
In the one never-before-seen black swan event you lose less with the 100pt spread.
But again: With my naked puts I’ve generated so much more income over the years that even a slightly bigger loss is still easily covered. 🙂
Very cool. I’m still struggling to understand why naked puts is so much better than 100 pt spreads. Can you explain?
I have reg t margins and can’t afford a single naked SPX put, but can do several 100 pt wide spreads. I suppose with portfolio margin (which I assume you have), you can do 2.5x naked puts? How does that work with your broker?
As far as I can tell, the only advantage to naked is that you can collect more premium due to not having to purchase the long leg. But spreads tie up less capital (10k at 100 pt width vs 120k at 2.5x leverage) therefore you can put more of them up. Why naked then? It doesn’t make much sense to me.
Edit: I think I accidentally posted a new comment.. my apologies!
Duplicate comment. Please see the reply to the other one! 🙂
Awesome, thanks for your reply!
I pray we never hit a black swan event (e.g. -1000 pts)! I also need to apply for portfolio margins!
Hi
Coming from a pure stocks background..struggling to get my head around why this delivers buy and hold beating returns. One would’ve thought such a basic and presumably now widely used options strategy would be almost completely efficient.
Is there a kind of average insurance risk premium the seller recieves in this strategy? Even if there is, isn’t it likely to be eroded as the truer average price of puts goes down? Basically..market makers are all over the options market – why does this work consistently? What would make you change your mind about future returns?
Thanks and great posts!
“Is there a kind of average insurance risk premium the seller recieves in this strategy?”
Yes. That’s the whole idea. Nobody pays you a risk premium for taking on upside risk. Lotteries tend to have a negative expected return. The downside risk is the scry risk and it’s the part that deserves a rich insurance premium. See here for more:
https://earlyretirementnow.com/2017/07/12/we-are-so-skewed/
I’m assuming you don’t really follow the 5% annualized yield nor 5 delta rules in general. A 5% annualized yield at the spx of ~3800 is 1.2 in premium per trade? That is unlikely, and even more unlikely with a 5 delta. I have been targeting .65 in premium per trade, or 10k per year this year on a 65k-100k portfolio (should be able to deposit 35k from paychecks this year) so about 10% return on the lower end. The $65 premiums are already higher than 5 delta, so I can’t imagine you’re getting anything lower than 13 on $100.
What do you think about vxx diagonals? Buy a leap, sell 2 month short in a 1:1 ratio. You get about 5 periods to breakeven if there is no spike. 10% of the portfolio hedged should be able to protect ~50% of the loss on the first spike, assuming no 1987. So if your loss was 5k on a contract, the hedge would increase by about 2k in value. Since you’re likely holding 5% of your portfolio in cash, another 5% combined to make the hedge would be about a small drag on the portfolio and that’s only if the spx makes huge gains.
That’s strange. When I’m selling, I’ve found the contracts with $1 premium are around 3 delta or sometimes lower. At least during this current IV environment.
Sorry, my brain was lagging. You’re correct.
Glad we’re on the same page! 🙂
Thanks Bob, for explaining!
Yeah, you can sell contracts with 5% yield and they’d have a delta way less than 5. The Vol environment is pretty neat right now…
My trade today (1/25):
Expiration: 1/27
Strike: 3575
Index at the time: 3830.88 (8:48 am West Coast time)
Premium: 1.00
Delta: about -0.02
As you can see, I don’t follow a strict rule. As I outlined in Part 4 (see heading “What strikes do I target?”) I look at multiple data points.
I will trade VXX options due to inferior tax treatment and record keeping requirements (itemizing all trades on my 1040). But I’d be interested in trading some VIX futures and VIX futures options along the lines you mentioned. It’s on my to-do list. 🙂
Hi Karsten and Spintwig,
I have been using a strategy very much based on these suggestions. I sell XSP 45 DTE 10D Puts using up to 2.5x leverage while investing 90% of the cash in VTEB and VGIT. This is working great. I have been doing this since Apr 2020 and every month except September has been double digits returns (net annualized). I have a 3.1 sharpe ratio, and all is good.
However, I have a question about dealing with the increasing value of the underlying (XSP). My issue is that has been increasing quickly, and I expect it to continue to outpace inflation over time. If today it is 388.50 or so then I might be selling Puts at 340. These each require $3400 of my margin capital and I sell it for ~$200. If, over time, the price of the underlying goes up 50% then it will be 582.75 and the same 45 DTE 10D Put will be at about 510. All else remaining equal (volatility, etc) should I expect to be able to sell the calls at $300 (200 * 1.5)? I assume that premium should go up with the underlying, right?
If I can currently sell 8 puts concurrently without going over my 2.5x leverage, I would have to decrease the number of puts to only 5 unless I increased my portfolio size along with the increase in the underlying. If we keep extrapolating, eventually I won’t be able to even sell a single put. Admittedly this is a long ways off, but I would like to use this strategy for the long-term.
How are you planning to deal with this?
– Do you use some of the profits to continuously expand the portfolio in some proportion to the underlying? What proportion?
– Do you hope that there will someday be an E-mini-mini?
– Do you not care and just hope to figure it out when/if you get there?
Am I missing something?
Thanks for all your hard work. I love reading all these case studies!
Hi Lenny
This is an excellent question! I see that exact phenomena happening all the time when running private backtests for clients.
The short version goes: yes, all else equal, premium will be commensurate relative to the underlying’s notional value.
If the options writing outperforms buy/hold underlying, the portfolio will eventually be able to support MORE contracts for a given amount of capital. The inverse, which is the scenario you painted, is also true. If options writing underperforms buy/hold underlying, then yes, extrapolated out, one will need to either inject additional capital into the account or hope for a notionally-smaller instrument as a single contract will be too large for the portfolio/risk parameters.
None of this takes into account the fact that withdrawals are being made from the profits in order to fund ones lifestyle (or taxes). In practice it’ll almost always be the case a single contract will eventually exceed the portfolio’s risk parameters.
For what it’s worth, there’s MES, which is the micro e-mini futures which may provide some additional runway at half the notional size of XSP. I touched on it a little bit at https://spintwig.com/how-to-trade-options-efficiently-part-3/#Micro_E-mini_Futures
The section summary is: 1 SPX = 2 /ES = 10 XSP/SPY = 20 /MES
Launch of MES options https://www.cmegroup.com/trading/equity-index/us-index/micro-e-mini-options.html
Thanks for the link! Not sure if this works for a far OTM strategy due to commissions. though…
Good point – there will likely be an increased P/L drag due to commissions. It looks like MES is 0.20 USD exchange fee + 0.02 regulatory fee, so 0.22 all in.
Since MES is 1/20th the size of SPX, the commission would also need to be 1/20th in order to maintain parity, ignoring slippage, liquidity and margin (SPAN) differences.
Perhaps I’ll publish a comparative study that highlights the impacts of commission drag.
Nice! Looking forward! 🙂
Thanks for the responses. I am also looking forward to the study. 🙂
Excellent questions about an important topic.
I have walked up the premium target much slower than the S&P’s rise. But that’s because I’m retired and I really only need that much income and not much more.
If you’re still accumulating you probably want to keep the premium growth about in line with the index growth. But also keep in mind that your margin cushion might not grow as quickly as the index. So, just from that side, you might be forced to either reign in the leverage or the option premium/Delta
Whew…I finally got around to reading all 5 parts of this topic along with all all the comments! I admit, I was a little intimidated by the idea of trading options initially but after spending a few hours reading through everything I feel like I now have a comfortable understanding of it all. Thanks Big ERN for patiently explaining everything in detail to us noobs! Thank you also Spintwig for generating all this backtest data!
I’m now ready to set up my IB account to begin selling a put on either SPX or ES. Big ERN or Spintwig, if you have a referral link feel free to let me know! I would like to get everyone’s feedback on the following:
1. With SP500 currently at 3906 I know I should have a portfolio of $130k if I want to sell one SPX at 3x leverage. I have an aftertax account with Vanguard in the amount of $65k between VTIAX and VTSAX and $80k cash I plan to move over to IB. I also have access to my HELOC in the event I might need to meet margin requirements. Would you feel comfortable selling one SPX contract or should I just sell one ES? I prefer not to realize any gains yet on the Vanguard account until I have a better idea of my income since this is my first full year of FIRE. I do understand having VTIAX and VTSAX will create more margin risk which is why I have my HELOC ready to transfer in case of a big drawdown.
2. Big ERN- with each SPX contract valued at $390k, are you still targeting $3/week premiums for each contract you sell?
You could start out much smaller with XSP or even smaller than that with MES. They all are tracking the same index.
Depending on how far out-of-the-money you are selling, you don’t need as much capital as you suggested. For example, if you trade XSP at 3 DTE just under 5D at 4.2D that is 381 (XSP is 1/10th the size of XSP). To maintain 3x leverage you would need just $12700 (381 * 100 / 3). Half that if you want to use MES.
You can also start by using a “paper money” account. IB has that available. This way you can learn the ropes and make mistakes without losing real money. I did this for a few months before starting with real money. Over the course of the past year I have slowly ramped up the size of my portfolio as I gained confidence in myself as well as the overall strategy.
Yes, I actually do plan to take advantage of the paper money account for at least two months while I get use to the platform and make beginner mistakes. I’m waiting on a $700 Citi new bank account bonus to post so this would be a perfect probationary period for me!
I think I still want to sell at least an ES (50x) since I have enough capital and the transaction cost will be lower than XSP. I just have to get a better understanding of how to finalize the put on ES when it is ITM.
They are European-style options, so if they expire ITM then it is settled in cash.
Yes, that’s a great advantage. Careful with the ES put options because they settle in the futures contract!
Good suggestions! Thanks! 🙂
1: You might be better off using the 50x ES mini options for now. Or alternatively, do a vertical spread of SPX options to limit the downside to maybe 100 points (=$10k)
2: I’m still doing 2.75-3.00 weekly premiums. The premium per contrct is less in % of the underlying, but I’m now using more leverage (about $140k margin for each short SPX put). I’m contemplating if I should move up the % yield and lower the # of contracts. So far my puts way OTM have worked out really well, though. Never got exercised in March 2020! 🙂
Thanks for the response! Instead of doing the vertical spread would it be better to sell my VTSAX position to have enough cash cushion for 3x leverage? Are you still targeting 5-7% yields when VIX is low? Also, is there a pretty strong negative correlation between SP500 and VIX where when VIX is high, SP500 tends to drop? If so, would it be good to research data of drops of 1% or more to determine better strike prices while also using the greek data?
Whoa, selling VTSAX might trigger too much in adverse tax effects. Maybe not a good idea…
I currently target around 3-4% yields (because the index has risen so much, I make the same or more income!)
I’m more concerned about a really low VIX (Jan 2018) than an elevated VIX.
Depends what you’re looking to optimize.
For 2-3DTE SPY/SPX short puts, a higher sharpe is usually achieved by lowering delta and increasing # of contracts.
You’ll typically get a greater total return with a higher delta and less contracts but the fact that a higher count / greater magnitude of losers occur at the higher deltas hurts sharpe more than the lower leverage helps.
This is based on various related backtests. YMMV.
Cheers!
As for the referral link, use the one at StockBrokers.com. It gives you a lifetime discount of 50bps on the first margin tier. In other words, margin rate for amounts from $1 to 100k is the same as for 100k-1M.
That’ll benefit you more than one of the referral links BigERN or I can offer.
As for the HELOC, if using IBKR it won’t matter. They offer rock bottom margin rates, in part, because they auto liquidate. You won’t have time to wire from the HELOC. Poof. Stopped out.
Looks like others provided input on instrument so I’ll let that convo continue.
Nice! Didn’t know about that one!
Thank you! I just signed up through that site!
Huge blog post. Too much informative & interesting post/. I also run a website that is similar to your niche. If you want to know more about trading visit my website.
I don’t endorse day trading and certainly not any kind of trading academy. Only makes the teacher rich.